Spark应用监控解决方案--使用Prometheus和Grafana监控Spark应用
Spark任务启动后,我们通常都是通过跳板机去Spark UI界面查看对应任务的信息,一旦任务多了之后,这将会是让人头疼的问题。如果能将所有任务信息集中起来监控,那将会是很完美的事情。
通过Spark官网指导文档,发现Spark只支持以下sink
Each instance can report to zero or more sinks. Sinks are contained in the org.apache.spark.metrics.sink package:
ConsoleSink: Logs metrics information to the console.CSVSink: Exports metrics data to CSV files at regular intervals.JmxSink: Registers metrics for viewing in a JMX console.MetricsServlet: Adds a servlet within the existing Spark UI to serve metrics data as JSON data.GraphiteSink: Sends metrics to a Graphite node.Slf4jSink: Sends metrics to slf4j as log entries.StatsdSink: Sends metrics to a StatsD node.
没有比较常用的Influxdb和Prometheus ~~~
谷歌一把发现要支持influxdb需要使用第三方包,比较有参考意义的是这篇,Monitoring Spark Streaming with InfluxDB and Grafana ,在提交任务的时候增加file和配置文件,但成功永远不会这么轻松。。。
写入influxdb的数据都是以application_id命名的,类似这种application_1533838659288_1030_1_jvm_heap_usage,也就是说每个任务的指标都是在单独的表,最终我们展示在grafana不还得一个一个配置么?
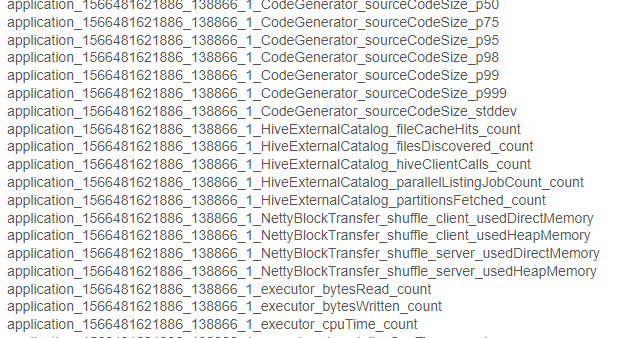
显然这个不是我想要的结果,最终目的就是:一次配置后每提交一个任务自动会在监控上看到。
谷歌是治愈一切的良药,终究找到一个比较完美的解决方案,就是通过graphite_exporter中转数据后接入Prometheus,再通过grafana展示出来。
所以,目前已经实践可行的方案有两个
方案一:
监控数据直接写入influxdb,再通过grafana读取数据做展示,步骤如下:
1.在spark下 conf/metrics.properties 加入以下配置
master.source.jvm.class=org.apache.spark.metrics.source.JvmSource

worker.source.jvm.class=org.apache.spark.metrics.source.JvmSource

driver.source.jvm.class=org.apache.spark.metrics.source.JvmSourc

executor.source.jvm.class=org.apache.spark.metrics.source.JvmSource
*.sink.influx.class=org.apache.spark.metrics.sink.InfluxDbSink
*.sink.influx.protocol=http
*.sink.influx.host=xx.xx.xx.xx
*.sink.influx.port=8086
*.sink.influx.database=sparkonyarn
*.sink.influx.auth=admin:admin
2.在提交任务的时候增加以下配置,并确保以下jar存在
--files /spark/conf/metrics.properties \
--conf spark.metrics.conf=metrics.properties \
--jars /spark/jars/metrics-influxdb-1.1.8.jar,/spark/jars/spark-influx-sink-0.4.0.jar \
--conf spark.driver.extraClassPath=metrics-influxdb-1.1.8.jar:spark-influx-sink-0.4.0.jar \
--conf spark.executor.extraClassPath=metrics-influxdb-1.1.8.jar:spark-influx-sink-0.4.0.jar
缺点:application_id发生变化需要重新配置grafana
方案二(目前在用的):
通过graphite_exporter将原生数据通过映射文件转化为有 label 维度的 Prometheus 数据
1.下载graphite_exporter,解压后执行以下命令,其中graphite_exporter_mapping需要我们自己创建,内容为数据映射文件
nohup ./graphite_exporter --graphite.mapping-config=graphite_exporter_mapping &
例如
mappings:

- match: '*.*.jvm.*.*'

  name: jvm_memory_usage

  labels:

    application: $1

    executor_id: $2

    mem_type: $3

    qty: $4
会将数据转化成 metric name 为 jvm_memory_usage,label 为 application,executor_id,mem_type,qty 的格式。
application_1533838659288_1030_1_jvm_heap_usage -> jvm_memory_usage{application="application_1533838659288_1030",executor_id="driver",mem_type="heap",qty="usage"}
2.配置 Prometheus 从 graphite_exporter 获取数据,重启prometheus
/path/to/prometheus/prometheus.ymlscrape_configs:
- job_name: 'spark'
static_configs:
- targets: ['localhost:9108']3.在spark下 conf/metrics.properties 加入以下配置
master.source.jvm.class=org.apache.spark.metrics.source.JvmSource

worker.source.jvm.class=org.apache.spark.metrics.source.JvmSource

driver.source.jvm.class=org.apache.spark.metrics.source.JvmSourc

executor.source.jvm.class=org.apache.spark.metrics.source.JvmSource
*.sink.graphite.class=org.apache.spark.metrics.sink.GraphiteSink
*.sink.graphite.protocol=tcp
*.sink.graphite.host=xx.xx.xx.xx
*.sink.graphite.port=9109
*.sink.graphite.period=5
*.sink.graphite.unit=seconds
4.提交spark任务的时候增加 --files /spark/conf/metrics.properties
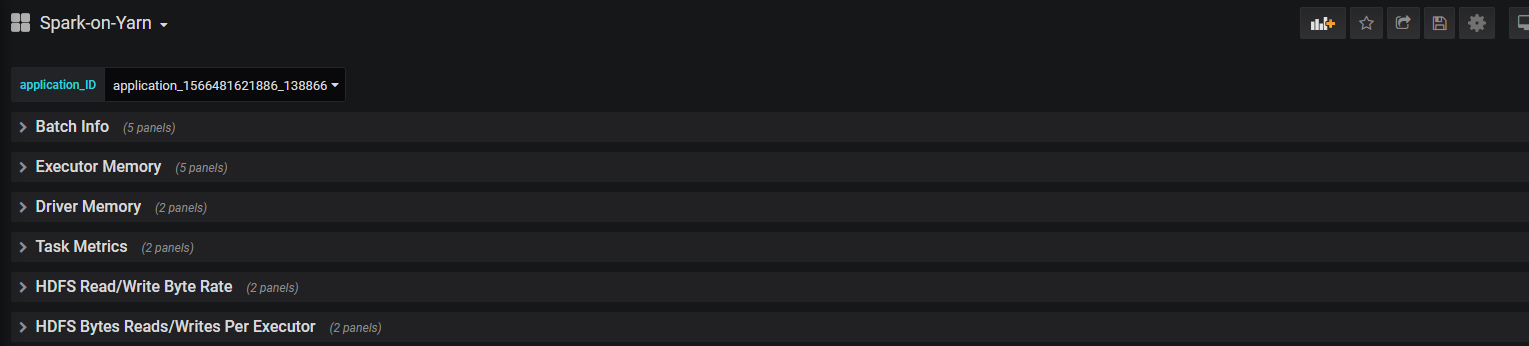
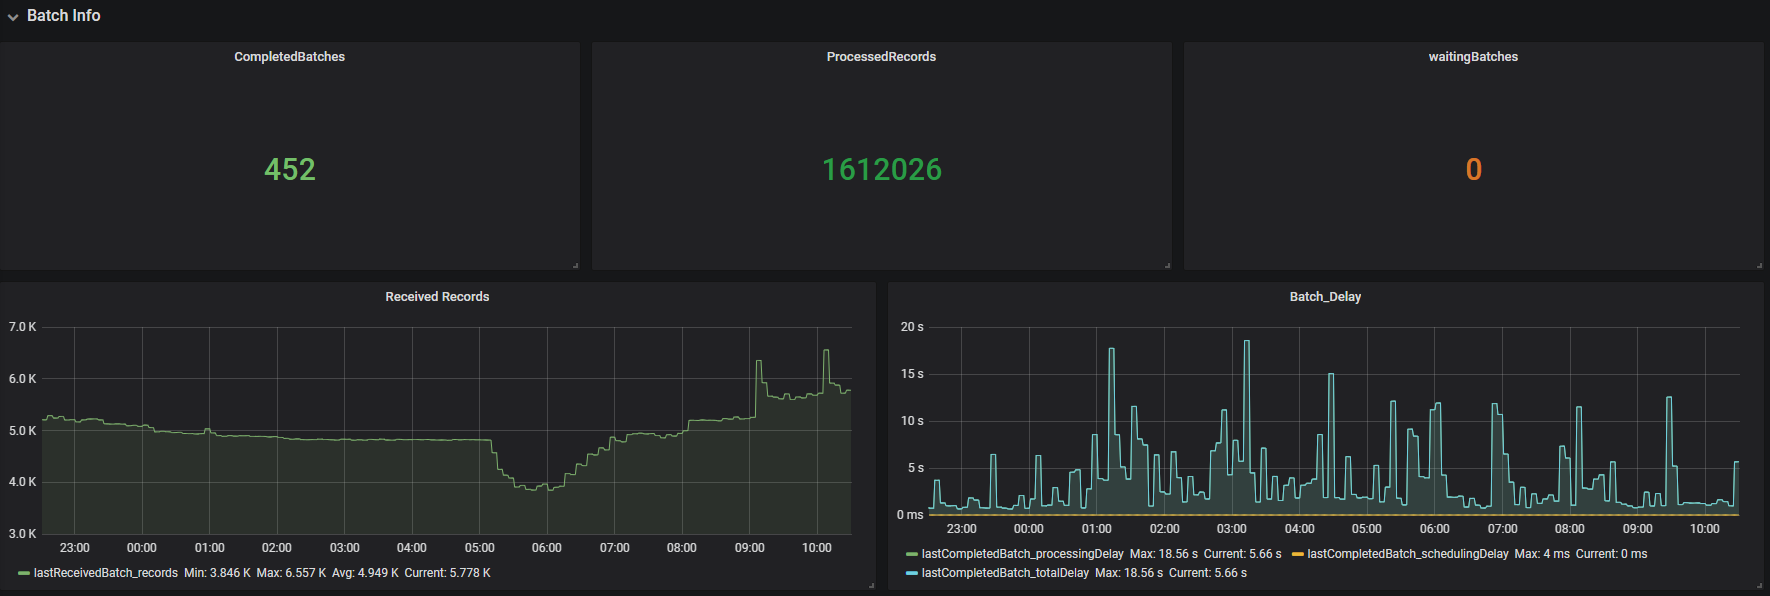
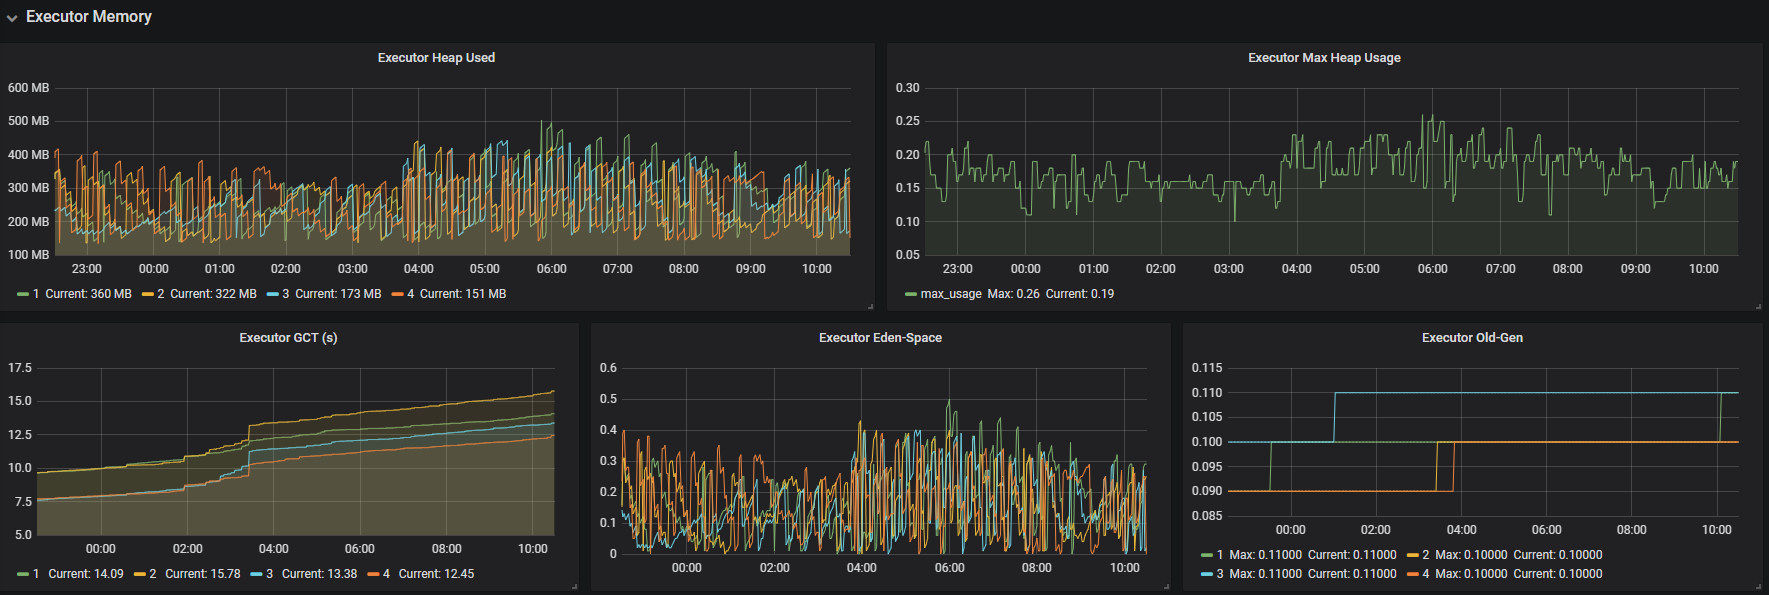
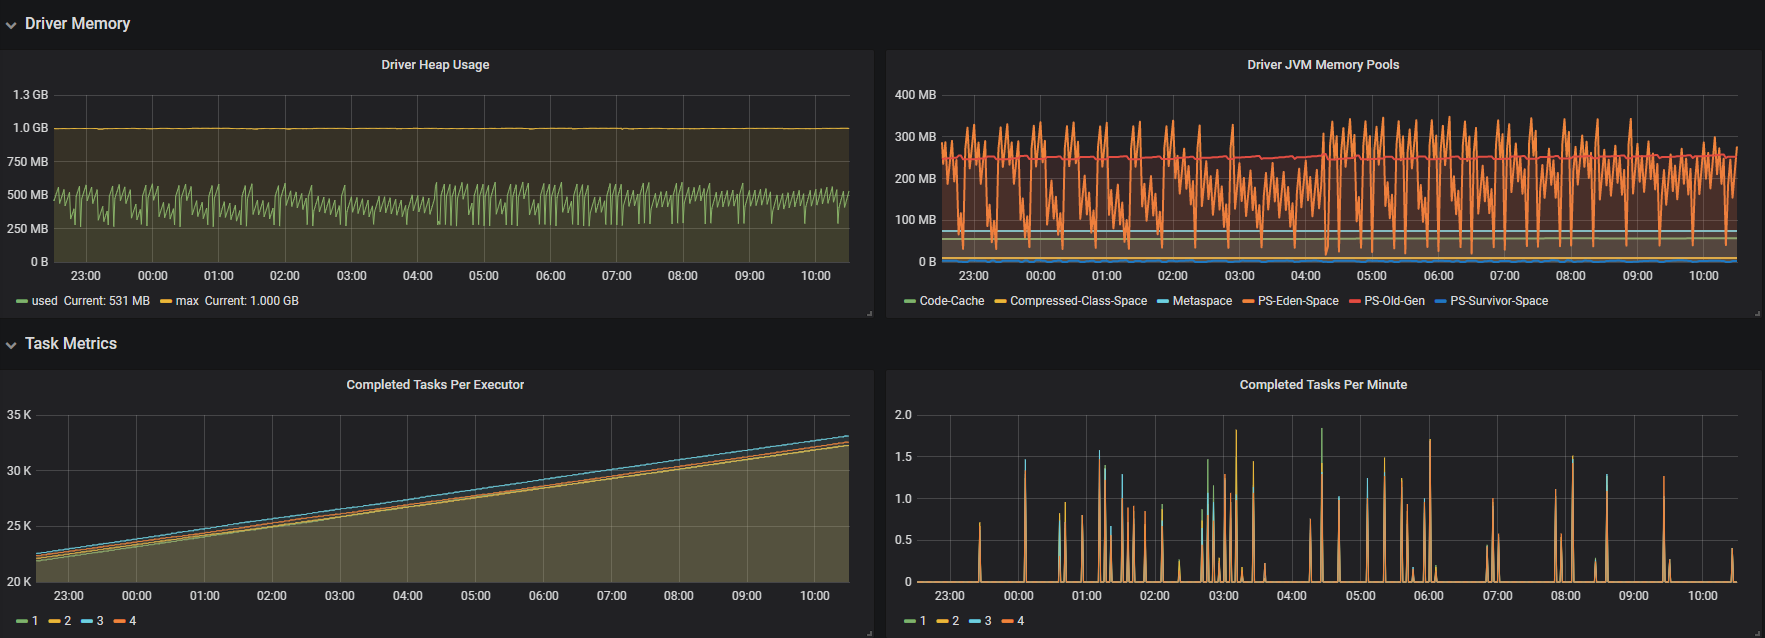
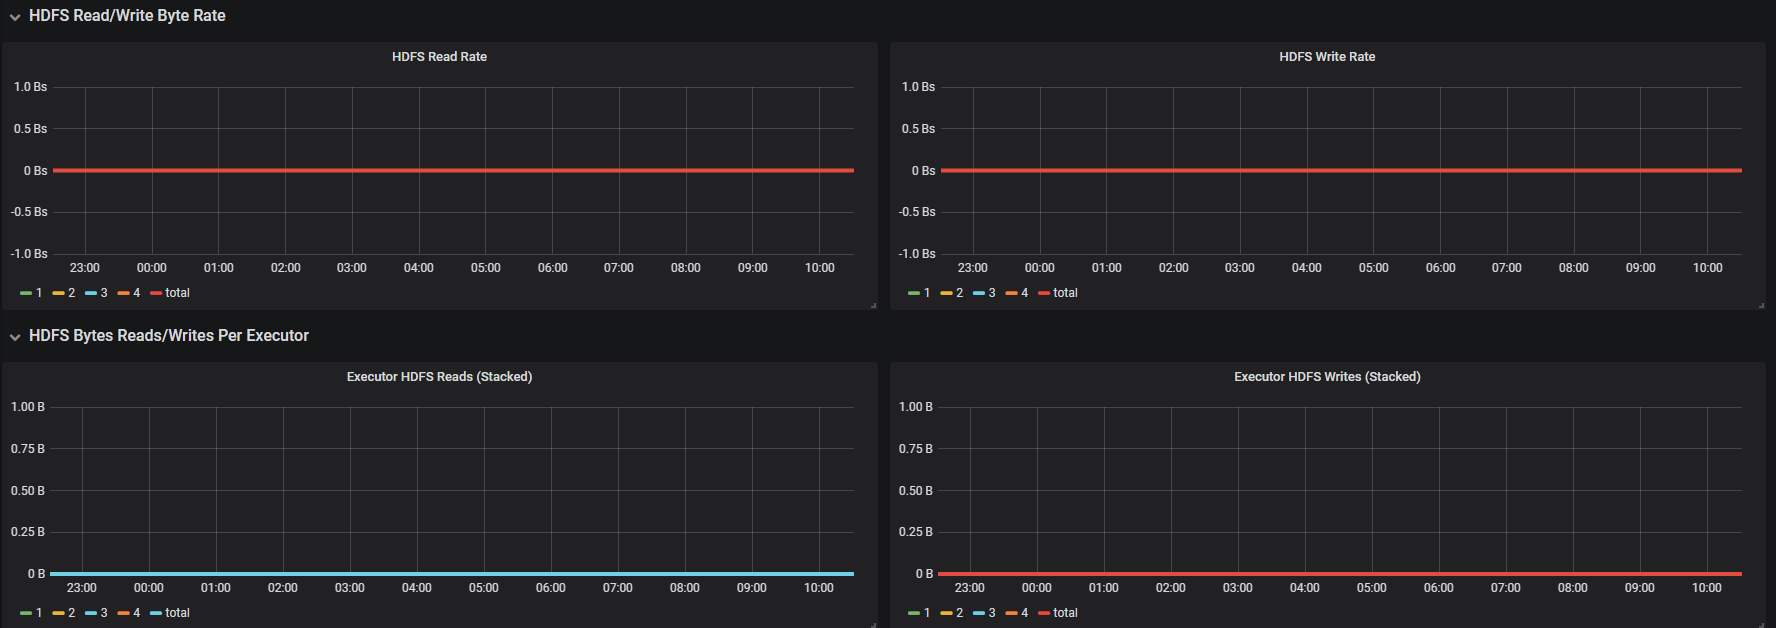
5.最后在grafana创建prometheus数据源,创建需要的指标,最终效果如下,有新提交的任务不需要再配置监控,直接选择application_id就可以看对应的信息
需要用到的jar包
https://repo1.maven.org/maven2/com/izettle/metrics-influxdb/1.1.8/metrics-influxdb-1.1.8.jar
https://mvnrepository.com/artifact/com.palantir.spark.influx/spark-influx-sink
模板
mappings:

- match: '*.*.executor.filesystem.*.*'

  name: filesystem_usage

  labels:

    application: $1

    executor_id: $2

    fs_type: $3

    qty: $4

- match: '*.*.executor.threadpool.*'

  name: executor_tasks

  labels:

    application: $1

    executor_id: $2

    qty: $3

- match: '*.*.executor.jvmGCTime.count'

  name: jvm_gcTime_count

  labels:

    application: $1

    executor_id: $2

- match: '*.*.executor.*.*'

  name: executor_info

  labels:

    application: $1

    executor_id: $2

    type: $3

    qty: $4

- match: '*.*.jvm.*.*'

  name: jvm_memory_usage

  labels:

    application: $1

    executor_id: $2

    mem_type: $3

    qty: $4

- match: '*.*.jvm.pools.*.*'

  name: jvm_memory_pools

  labels:

    application: $1

    executor_id: $2

    mem_type: $3

    qty: $4

- match: '*.*.BlockManager.*.*'

  name: block_manager

  labels:

    application: $1

    executor_id: $2

    type: $3

    qty: $4

- match: '*.driver.DAGScheduler.*.*'

  name: DAG_scheduler

  labels:

    application: $1

    type: $2

    qty: $3

- match: '*.driver.*.*.*.*'

  name: task_info

  labels:

    application: $1

    task: $2

    type1: $3

    type2: $4

    qty: $5
graphite_exporter_mapping
参考资料
https://github.com/palantir/spark-influx-sink
https://spark.apache.org/docs/latest/monitoring.html
https://www.linkedin.com/pulse/monitoring-spark-streaming-influxdb-grafana-christian-g%C3%BCgi
https://github.com/prometheus/prometheus/wiki/Default-port-allocations
https://github.com/prometheus/graphite_exporter
https://prometheus.io/download/
https://rokroskar.github.io/monitoring-spark-on-hadoop-with-prometheus-and-grafana.html
https://blog.csdn.net/lsshlsw/article/details/82670508
https://www.jianshu.com/p/274380bb0974
Spark应用监控解决方案--使用Prometheus和Grafana监控Spark应用的更多相关文章
- Prometheus Alertmanager Grafana 监控警报
Prometheus Alertmanager Grafana 监控警报 #node-exporter, Linux系统信息采集组件 #prometheus , 抓取.储存监控数据,供查询指标 #al ...
- 使用Docker部署监控系统,Prometheus,Grafana,监控服务器信息及Mysql
使用Docker部署监控系统,Prometheus,Grafana,监控服务器信息及Mysql 一.docker部署prometheus监控系统 1.1 配置安装环境 1.1.1 安装promethe ...
- 14、Docker监控方案(Prometheus+cAdvisor+Grafana)
上一篇文章我们已经学习了比较流行的cAdvisor+InfluxDB+Grafana组合进行Docker监控.这节课来学习Prometheus+cAdvisor+Grafana组合. cAdvisor ...
- Prometheus+Alertmanager+Grafana监控组件容器部署
直接上部署配置文件 docker-compose.yml version: '3' networks: monitor: driver: bridge services: prometheus: im ...
- 使用Prometheus和Grafana监控emqx集群
以 Prometheus为例: emqx_prometheus 支持将数据推送至 Pushgateway 中,然后再由 Promethues Server 拉取进行存储. 注意:emqx_promet ...
- 使用Prometheus和Grafana监控nacos集群
官方文档:https://nacos.io/zh-cn/docs/monitor-guide.html 按照部署文档搭建好Nacos集群 配置application.properties文件,暴露me ...
- 使用Prometheus和Grafana监控RabbitMQ集群 (使用RabbitMQ自带插件)
配置RabbitMQ集群 官方文档:https://www.rabbitmq.com/prometheus.html#quick-start 官方github地址:https://github.com ...
- Prometheus+Grafana监控SpringBoot
Prometheus+Grafana监控SpringBoot 一.Prometheus监控SpringBoot 1.1 pom.xml添加依赖 1.2 修改application.yml配置文件 1. ...
- Docker监控平台prometheus和grafana,监控redis,mysql,docker,服务器信息
Docker监控平台prometheus和grafana,监控redis,mysql,docker,服务器信息 一.通过redis_exporter监控redis 1.1 下载镜像 1.2 运行服务 ...
随机推荐
- MySql(Linux)
百度云:链接:http://pan.baidu.com/s/1jHQtPau 密码:elr8 官方下载网址:http://dev.mysql.com/downloads/mysql/
- linux初学者-DDNS配置篇
linux初学者-DDNS配置篇 如果DNS服务器要记录多台主机的IP,且这些主机的IP都是通过DHCPD服务自动获取的,那么将会造成很大的困难,因为在DNS设置时无法得知主机具体的IP.如果DHCP ...
- activeMQ_helloworld(一)
一.activeMQ下载,直接在Linux上wget http://mirror.bit.edu.cn/apache//activemq/5.14.5/apache-activemq-5.14.5-b ...
- 【iOS】iOS 调试快速定位程序在哪崩溃
iOS 开发过程中经常遇到程序崩溃.快速定位程序在哪崩溃的步骤如下: 1. 2. 3. 这样设置后,程序崩溃时会定位到崩溃的语句,如下: 原文链接:iOS开发何如在调试的时候轻松找到程序在哪里崩溃
- Linux 文件系统相关的基本概念
本文介绍 Linux 文件系统相关的基本概念. 硬盘的物理组成 盘片硬盘其实是由单个或多个圆形的盘片组成的,按照盘片能够容纳的数据量,分为单盘(一个硬盘里面只有一个盘片)或多盘(一个硬盘里面有多个盘片 ...
- KD-tree 专题「Hide and Seek · 巧克力王国」
Lockey的瞎理解 抄了一遍板子又水了俩题,感觉对KD-tree 稍稍理解了一点儿,唠叨一下(二维的KD-tree),如有错误请指出(Lockey 洗脸恭听) 普通平衡树维护的是一维的序列,但对于二 ...
- JAVA并发编程之倒计数器CountDownLatch
CountDownLatch 的使用场景:在主线程中开启多线程去并行执行任务,并且主线程需要等待所有子线程执行完毕后汇总返回结果. 我把源码中的英文注释全部删除,写上自己的注释.就剩下 70 行不到的 ...
- javaweb入门-----jsp概念
jsp是什么? JSP:Java Server Pages java服务器端页面 *可以理解为 一个特殊的页面,其中既可以直接定义html标签,又可以定义java代码 *用于简化书写 <% %& ...
- HDP Hive性能调优
(官方文档翻译整理及总结) 一.优化数据仓库 ① Hive LLAP 是一项接近实时结果查询的技术,可用于BI工具以及网络看板的应用,能够将数据仓库的查询时间缩短到15秒之内,这样的查询称之为Int ...
- ECharts图表插件(4.x版本)使用(一、关系图force节点显示为自定义图像/图片,带分类选择)
导读 ECharts,一个使用 JavaScript 实现的开源可视化库,可以流畅的运行在 PC 和移动设备上,兼容当前绝大部分浏览器(IE8/9/10/11,Chrome,Firefox,Safar ...