使用Prometheus监控bind9的DNS服务
- 首先编译bind_exporter,编译方式参见bind_exporter
- 创建一个systemd配置文件来运行bind_exporter
vi /etc/systemd/system/bind_exporter.service
内容如下,注意此处的用户和组使用与named程序相同的用户和组“named”。--web.listen-address为对外暴露的metric地址和端口,Prometheus从此处抓取bind_exporter的metrics;--bind.stats-url为本地bind服务绑定的地址和IP
[Unit]

Description=bind_exporter

Documentation=https://github.com/digitalocean/bind_exporter

Wants=network-online.target

After=network-online.target

[Service]

Type=simple

User=named

Group=named

ExecReload=/bin/kill -HUP $MAINPID

ExecStart=/opt/bind_exporter/bind_exporter \

  --bind.pid-file=/var/run/named/named.pid \

  --bind.timeout=20s \

  --web.listen-address=0.0.0.0: \

  --web.telemetry-path=/metrics \

  --bind.stats-url=http://localhost:53/ \

  --bind.stats-groups=server,view,tasks

SyslogIdentifier=bind_exporter

Restart=always

[Install]

WantedBy=multi-user.target
- 加载并启动bind_export
systemctl daemon-reload

systemctl restart bind_exporter.service
- 在/etc/named.conf中添加如下内容,注意“statistics-channels”是与“options”并列的,而不是位于“options”内部
statistics-channels {

  inet 127.0.0.1 port  allow { 127.0.0.1; };

};
重新启动named
service named restart
- 在Prometheus的yml文件中添加如下job,重新启动Prometheus即可
  - job_name: dns-master

    static_configs:

      - targets: ['10.85.6.66:9119']

        labels:

          alias: dns-master
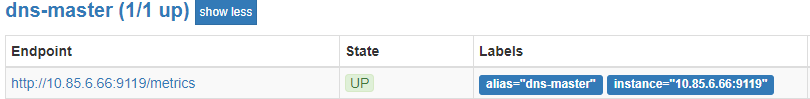
在Prometheus的targets中可以看到新加的内容
可以通过“curl http://10.85.6.66:9119/metrics”来获取bind_exporter支持的metrics以及方法,最常用的方法为“bind_up”,用于查看一个bind服务是否启动,值1表示启动成功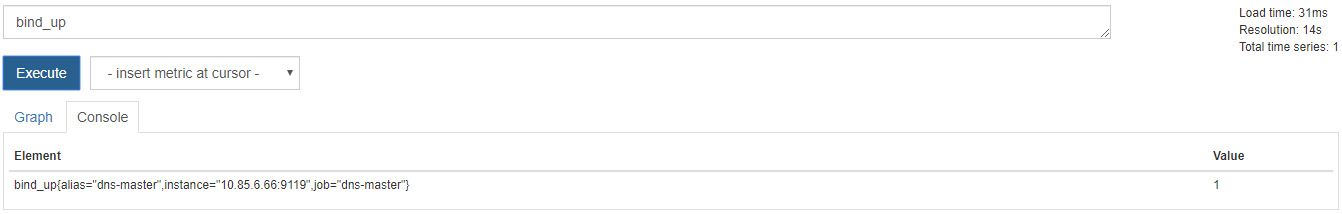
参考:
https://grafana.com/dashboards/1666
https://computingforgeeks.com/how-to-monitor-bind-dns-server-with-prometheus-and-grafana/
使用Prometheus监控bind9的DNS服务的更多相关文章
- prometheus监控(小试牛刀)
prometheus监控(小试牛刀) 环境:全部服务都是基于docker运行 本文略微草率,好文章在这里,特别好如下: https://www.cnblogs.com/tchua/p/11120228 ...
- Prometheus监控k8s集合
Prometheus监控k8s Prometheus监控k8s(1)-Prometheus简介 Prometheus监控k8s(2)-手动部署Prometheus Prometheus监控k8s(3) ...
- 使用Prometheus监控Golang服务-基于YoyoGo框架
Prometheus Prometheus是一个非常棒的工具,结合grafana能够让我在不写代码,或者少写代码的情况下搭建一套有效的监控体系.这里介绍一下Prometheus监控golang程序的方 ...
- 基于Centos7.4搭建prometheus+grafana+altertManger监控Spring Boot微服务(docker版)
目的:给我们项目的微服务应用都加上监控告警.在这之前你需要将 Spring Boot Actuator引入 本章主要介绍 如何集成监控告警系统Prometheus 和图形化界面Grafana 如何自定 ...
- 远见而明察近观若明火|Centos7.6环境基于Prometheus和Grafana结合钉钉机器人打造全时监控(预警)Docker容器服务系统
原文转载自「刘悦的技术博客」https://v3u.cn/a_id_181 我们知道,奉行长期主义的网络公司,势必应在软件开发流程管理体系上具备规范意识,即代码提交有CR(CodeReview),功能 ...
- Linux下DNS服务(Bind9)之Web管理利器-NamedManager部署说明
NamedManager 是一个基于Web的DNS管理系统,可用来添加.调整和删除DNS的zones/records数据.它使用Bind作为底层DNS服务,提供一个现代Ajax的Web界面,支持 IP ...
- Kubernetes集群部署史上最详细(二)Prometheus监控Kubernetes集群
使用Prometheus监控Kubernetes集群 监控方面Grafana采用YUM安装通过服务形式运行,部署在Master上,而Prometheus则通过POD运行,Grafana通过使用Prom ...
- 03 . Prometheus监控容器和HTTP探针应用
Eeporter是什么及来源? 是什么? 广义上讲所有可以向Prometheus提供监控样本数据的程序都可以被称为一个Exporter.而Exporter的一个实例称为target,如下所示,Prom ...
- 图文详解Prometheus监控+Grafana+Alertmanager告警安装使用
一:前言 一个服务上线了后,你想知道这个服务是否可用,需要监控.假如线上出故障了,你要先于顾客感知错误,你需要监控.还有对数据库,服务器的监控,等等各层面的监控. 近年来,微服务架构的流行,服务数越来 ...
随机推荐
- 用Python 打开程序的两中方法
1.ShellExecute函数 import win32api win32api.ShellExecute(0, 'open', 'notepad.exe', '', '', 0) # 后台执行 w ...
- C和C++的不同点
一.返回值 C中:如果函数未指定返回值类型,则默认为int c++中:如果一个函数没有返回值,返回值类型必须指定为void 二.参数列表 C中:如果函数没有指定参数列表,则默认可以接受任意多个参数 C ...
- linux学习13 Linux运维常用文件管理命令及系统变量基础
一.文件管理命令 1.cp命令,copy a.单源复制,cp [OPTION]... [-T] SOURCE DEST 如果DEST不存在:则事先创建此文件,并复制源文件的数据流至DEST中. 如果D ...
- cockroachdb docker-compose 本地集群运行以及prometheus监控
cockroachdb 官方提供的是一个直接使用docker 运行的方式,但是使用docker-compose 会比较方便,可以快速搭建一个集群 同时官方也提供了prometheus 的metrics ...
- type of的返回值有哪些
typeof 10; // number typeof 'time'; //string typeof undefined; // undefined typeof null; // object t ...
- 一篇JavaScript技术栈带你了解继承和原型链
作者 | Jeskson 来源 | 达达前端小酒馆 1 在学习JavaScript中,我们知道它是一种灵活的语言,具有面向对象,函数式风格的编程模式,面向对象具有两点要记住,三大特性,六大原则. 那么 ...
- attempt to call method 'getDataString' (a nil value)
错误: LUA ERROR: [: attempt to call method 'getDataString' (a nil value) 在合并cocos和quick的时候,在EventCusto ...
- Codeforces 828F Best Edge Weight - 随机堆 - 树差分 - Kruskal - 倍增算法
You are given a connected weighted graph with n vertices and m edges. The graph doesn't contain loop ...
- 面试问烂的 MySQL 四种隔离级别,看完吊打面试官!
阅读本文大概需要 5.6 分钟. 来源:网络 什么是事务 事务是应用程序中一系列严密的操作,所有操作必须成功完成,否则在每个操作中所作的所有更改都会被撤消.也就是事务具有原子性,一个事务中的一系列的操 ...
- Gamma阶段第一次scrum meeting
每日任务内容 队员 昨日完成任务 明日要完成的任务 张圆宁 #91 用户体验与优化:发现用户体验细节问题https://github.com/rRetr0Git/rateMyCourse/issues ...