SciTech-Mathmatics-Probability+Statistics: How to Read and Interpret a $\large Regression\ Table$
How to Read and Interpret a Regression Table
BY ZACH BOBBITTPOSTED ON MARCH 20, 2019
https://www.statology.org/read-interpret-regression-table/
In statistics, regression is a technique that can be used to analyze the relationship between predictor variables and a response variable.
When you use software (like R, SAS, SPSS, etc.) to perform a regression analysis, you will receive a regression table as output that summarize the results of the regression. It's important to know how to read this table so that you can understand the results of the regression analysis.
This tutorial walks through an example of a regression analysis and provides an in-depth explanation of how to read and interpret the output of a regression table.
A Regression Example
Suppose we have the following dataset that shows the total number of hours studied, total prep exams taken, and final exam score received for 12 different students:
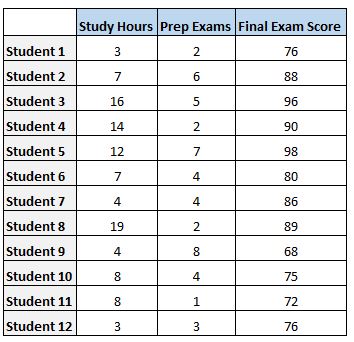
Regression analysis data example
To analyze the relationship between hours studied and prep exams taken with the final exam score that a student receives, we run a multiple linear regression using hours studied and prep exams taken as the \(\large predictor\ variables\) and final exam score as the \(\large response\ variable\).
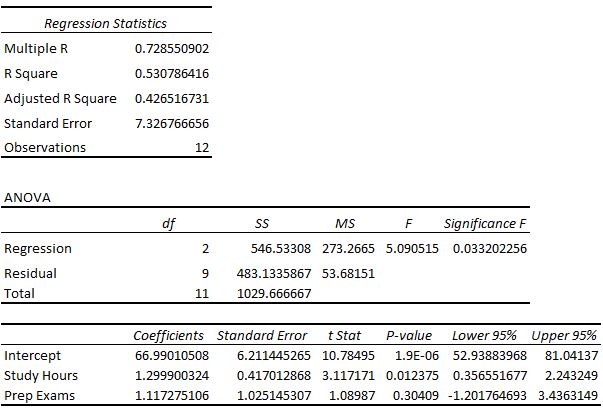
We receive the following output:
Examining the Fit of the Model
The first section shows several different numbers that measure the fit of the regression model, i.e. how well the regression model is able to "fit" the dataset.
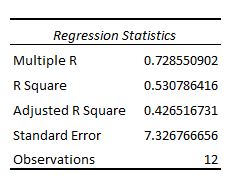
Here is how to interpret each of the numbers in this section:
Multiple R
Multiple R is the square root of R-squared (see below)
This is the \(\large correlation\ coefficient\). It measures the strength of the linear relationship between the predictor variables and the response variable. A multiple R of 1 indicates a perfect linear relationship while a multiple R of 0 indicates no linear relationship whatsoever.
In this example, the multiple R is 0.72855, which indicates a fairly strong linear relationship between the predictors study hours and prep exams and the response variable final exam score.
R-Squared
This is often written as \(\large r^2\), and is also known as the \(\largevcoefficient\ of\ determination\). It is the proportion of the variance in the response variable that can be explained by the predictor variable.
The value for R-squared can range from 0 to 1. A value of 0 indicates that the response variable cannot be explained by the predictor variable at all. A value of 1 indicates that the response variable can be \(\large perfectly\ explained\ without\ error\) by the predictor variable.
In this example, the R-squared is 0.5307, which indicates that 53.07% of the variance in the final exam scores can be explained by the number of hours studied and the number of prep exams taken.
Related: What is a Good R-squared Value?
Adjusted R-Squared
This is a modified version of R-squared that has been adjusted for the number of predictors in the model. It is always lower than the R-squared. The adjusted R-squared can be useful for comparing the fit of different regression models to one another.
In this example, the Adjusted R-squared is 0.4265.
Standard Error of the Regression
The standard error of the regression is the average distance that the observed values fall from the regression line. In this example, the observed values fall an average of 7.3267 units from the regression line.
Related: Understanding the Standard Error of the Regression
Observations
This is simply the number of observations in our dataset. In this example, the total observations is 12.
Testing the Overall Significance of the Regression Model
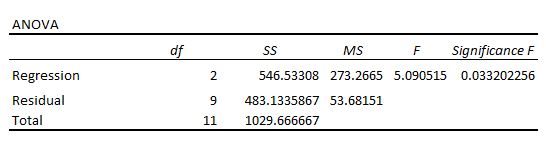
The next section shows the degrees of freedom, the sum of \(\large squares\), \(\large mean\ squares\), \(\large F statistic\), and overall significance of the regression model.
Here is how to interpret each of the numbers in this section:
Regression degrees of freedom
This number is equal to: the number of regression coefficients – 1. In this example, we have an intercept term and two predictor variables, so we have three regression coefficients total, which means the regression degrees of freedom is 3 – 1 = 2.
Total degrees of freedom
This number is equal to: the number of observations – 1. In this example, we have 12 observations, so the total degrees of freedom is 12 – 1 = 11.
Residual degrees of freedom
This number is equal to: total df – regression df. In this example, the residual degrees of freedom is 11 – 2 = 9.
Mean Squares
The regression mean squares is calculated by regression SS / regression df. In this example, regression MS = 546.53308 / 2 = 273.2665.
The residual mean squares is calculated by residual SS / residual df. In this example, residual MS = 483.1335 / 9 = 53.68151.
F Statistic
The f statistic is calculated as regression MS / residual MS. This statistic indicates whether the regression model provides a better fit to the data than a model that contains no independent variables.
In essence, it tests if the regression model as a whole is useful. Generally if none of the predictor variables in the model are statistically significant, the overall F statistic is also not statistically significant.
In this example, the F statistic is 273.2665 / 53.68151 = 5.09.
Significance of F (P-value)
The last value in the table is the p-value associated with the F statistic. To see if the overall regression model is significant, you can compare the p-value to a significance level; common choices are .01, .05, and .10.
If the p-value is less than the significance level, there is sufficient evidence to conclude that the regression model fits the data better than the model with no predictor variables. This finding is good because it means that the predictor variables in the model actually improve the fit of the model.
In this example, the p-value is 0.033, which is less than the common significance level of 0.05. This indicates that the regression model as a whole is statistically significant, i.e. the model fits the data better than the model with no predictor variables.
Testing the Overall Significance of the Regression Model
The last section shows the coefficient estimates, the standard error of the estimates, the** t-stat**, p-values, and confidence intervals for each term in the regression model.
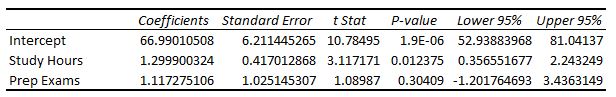
Here is how to interpret each of the numbers in this section:
Coefficients
The coefficients give us the numbers necessary to write the estimated regression equation:
\(\large y_hat = b0 + b_1 \mul x_1 + b_2 \mul x_2\).
In this example, the estimated regression equation is:
\(\large \text{final exam score} = 66.99 + 1.299(Study\ Hours) + 1.117(Prep\ Exams)\)
Each individual coefficient is interpreted as the average increase in the response variable for each one unit increase in a given predictor variable, assuming that all other predictor variables are held constant. For example, for each additional hour studied, the average expected increase in final exam score is 1.299 points, assuming that the number of prep exams taken is held constant.
The intercept(截距, 此例是Z轴的) is interpreted as the expected average final exam score for a student who studies for zero hours and takes zero prep exams. In this example, a student is expected to score a 66.99 if they study for zero hours and take zero prep exams. Be careful when interpreting the intercept of a regression output, though, because it doesn't always make sense to do so.
For example, in some cases, the intercept may turn out to be a negative number, which often doesn't have an obvious interpretation. This doesn't mean the model is wrong, it simply means that the intercept by itself should not be interpreted to mean anything.
Standard Error, t-stats, and p-values
The standard error is a measure of the uncertainty around the estimate of the coefficient for each variable.
The t-stat is simply the coefficient divided by the standard error. For example, the t-stat for Study Hours is 1.299 / 0.417 = 3.117.
The next column shows the p-value associated with the t-stat. This number tells us if a given response variable is significant in the model. In this example, we see that the p-value for Study Hours is 0.012 and the p-value for Prep Exams is 0.304. This indicates that Study Hours is a significant predictor of final exam score, while Prep Exams is not.
$\large \text{Confidence Interval for Coefficient Estimates} $
The last two columns in the table provide the lower and upper bounds for \(\large \text{a 95% confidence interval}\) for \(\large \text{the coefficient estimates}\).
For example, the coefficient estimate for Study Hours is 1.299, but there is some uncertainty around this estimate. We can never know for sure if this is the exact coefficient. Thus, a 95% confidence interval gives us a range of likely values for the true coefficient.
In this case, the 95% confidence interval for Study Hours is (0.356, 2.24).
Notice that this confidence interval does not contain the number "0", which means we're quite confident that the true value for the coefficient of Study Hours is non-zero, i.e. a positive number.By contrast, the 95% confidence interval for Prep Exams is (-1.201, 3.436).
Notice that this confidence interval does **contain the number "0", which means that the true value for the coefficient of Prep Exams could be zero, i.e. non-significant in predicting final exam scores.
Additional Resources
Understanding the Null Hypothesis for Linear Regression
Understanding the F-Test of Overall Significance in Regression
How to Report Regression Results
SciTech-Mathmatics-Probability+Statistics: How to Read and Interpret a $\large Regression\ Table$的更多相关文章
- Probability&Statistics 概率论与数理统计(1)
基本概念 样本空间: 随机试验E的所有可能结果组成的集合, 为E的样本空间, 记为S 随机事件: E的样本空间S的子集为E的随机事件, 简称事件, 由一个样本点组成的单点集, 称为基本事件 对立事件/ ...
- How do I learn machine learning?
https://www.quora.com/How-do-I-learn-machine-learning-1?redirected_qid=6578644 How Can I Learn X? ...
- 不就ideas嘛,谁没有!
20160214 survey of current RDF triple storage systems survey of semantic web stack inference mechani ...
- Advice for students of machine learning--转
原文地址:http://www.mimno.org/articles/ml-learn/ written by david mimno One of my students recently aske ...
- Machine and Deep Learning with Python
Machine and Deep Learning with Python Education Tutorials and courses Supervised learning superstiti ...
- [book]awesome-machine-learning books
https://github.com/josephmisiti/awesome-machine-learning/blob/master/books.md Machine-Learning / Dat ...
- SCI&EI 英文PAPER投稿经验【转】
英文投稿的一点经验[转载] From: http://chl033.woku.com/article/2893317.html 1. 首先一定要注意杂志的发表范围, 超出范围的千万别投,要不就是浪费时 ...
- QM4_Probability
Basic Concepts Probability concepts Terms Random variable A quantity whose possible values are uncer ...
- Open Source Book For ML
The following is a list of free, open source books on machine learning, statistics, data-mining, etc ...
- How do I learn mathematics for machine learning?
https://www.quora.com/How-do-I-learn-mathematics-for-machine-learning How do I learn mathematics f ...
随机推荐
- 把 Java WebApi 快速转为 Mcp-Server(使用 Solon AI MCP)
solon-ai-mcp,提供了各种 mcp 相关能力,支持 java8, java11, java17, java21, java24 .是 solon-ai 项目的重要组成部分,也可以嵌入到 sp ...
- 关于网传微信聊天记录提取工具"留痕"盗取个人信息的分析
今天早上看到一篇文章,是关于一个微信聊天记录提取工具泄露个人信息的内容,于是我就好奇,看了一下作者的 github,然后也是自己小小的分析了一下 1.官方地址 Github: https://gith ...
- 【经验】IDA|python 脚本怎么使用反汇编的变量,以及获取反汇编地址上的值,附 IDA的output窗口被不小心关掉了的打开方式
文章目录 IDA脚本怎么用变量--怎么获取目标文件内的值(python) 1 获取地址 2 获取地址上的值 可能出现的问题:NameError: name 'Byte' is not defined ...
- 创建mysql容器
docker run -d --name node2 -e "container=docker" --privileged=true new/centos_sshd /usr/ ...
- C#/.NET/.NET Core技术前沿周刊 | 第 38 期(2025年5.12-5.18)
前言 C#/.NET/.NET Core技术前沿周刊,你的每周技术指南针!记录.追踪C#/.NET/.NET Core领域.生态的每周最新.最实用.最有价值的技术文章.社区动态.优质项目和学习资源等. ...
- AD 侦查-AS-REP 烘烤攻击
本文通过 Google 翻译 AD Recon – AS-REP Roasting Attacks 这篇文章所产生,本人仅是对机器翻译中部分表达别扭的字词进行了校正及个别注释补充. 导航 0 前言 1 ...
- AI 极客低代码平台快速上手 --生成Python代码
1.侧栏菜单选择"Python": 点击代码区右上角的"代码魔法棒"图标,在弹出的确认面板中点击"确认"按钮,一秒生成基于FastApi最新 ...
- 【公众号搬运】gap
.markdown-body { line-height: 1.8; font-weight: 400; font-size: 16px; word-spacing: 2px; letter-spac ...
- 基于CentOS Stream 8的物联网数据采集与展示方案
系统架构全景图 图表 一.系统平台优化(CentOS Stream 8) 1. 系统基础配置 bash # 1. 系统更新与加固 sudo dnf update -y sudo dnf install ...
- tcpdump工具使用
一.简单介绍 tcpdump命令是一款sniffer工具,它可以打印所有经过网络接口的数据包的头信息,也可以使用-w选项将数据包保存到文件中,方便以后分析. 二.使用语法 语法: tcpdump (选 ...