
D3.js绘制平行坐标图
参照:https://syntagmatic.github.io/parallel-coordinates/ 和 https://github.com/syntagmatic/parallel-coordinates
源码:
<!DOCTYPE html>

<html lang="en">

<head>

    <meta charset="UTF-8">

    <title>原始数据平行坐标图</title>

    <link rel="stylesheet" type="text/css" href="static/css/d3.parcoords.css">

    <link rel="stylesheet" type="text/css" href="static/css/style.css">

    <style>

        body, html {

            margin: 0;

            padding: 0;

            width: 100%;

            height: 100%;

        }

        /* parcoords */

        #nutrients {

            position: fixed;

            bottom: 4px;

            height: 180px;

            width: 98%;

            padding: 8px 1% 0;

            border-top: 1px solid #d0d0d0;

        }

        #nutrients text {

            font-size: 10px;

        }

        /* data table styles */

        #grid {

            position: fixed;

            bottom: 192px;

            width: 100%;

            height: 160px;

            overflow: auto;

            border-top: 1px solid #d0d0d0;

        }

        .row, .header {

            clear: left;

            font-size: 10px;

            line-height: 16px;

            height: 16px;

            width: 2000px;

            padding: 0 16px;

        }

        .row:nth-child(odd) {

            background: rgba(0, 0, 0, 0.05);

        }

        .header {

            font-weight: bold;

        }

        .cell {

            float: left;

            overflow: hidden;

            white-space: nowrap;

            width: 100px;

            height: 18px;

        }

        .col-0 {

            width: 180px;

        }

    </style>

    <script src="static/js/d3.min.js"></script>

    <script src="static/js/d3.parcoords.js"></script>

    <script src="static/js/divgrid.js"></script>

    <script src="static/js/underscore.js"></script>

    <script src="static/js/scatterplot.js"></script>

</head>

<body>

<div id="nutrients" class="parcoords"></div>

<svg id="scatter"></svg>

<div id="grid"></div>

<script id="brushing">

    var parcoords = d3.parcoords()("#nutrients");

    var transparency = d3.scale.pow()

        .exponent(0.15)

        .range([1, 0.12]);

    var colorList = ["#a50026", "#d73027", "#f46d43", "#fdae61", "#fee090", "#ffffbf", "#e0f3f8", "#abd9e9", "#74add1", "#4575b4", "#313695", "#67001f", "#b2182b", "#d6604d", "#f4a582", "#fddbc7", "#ffffff", "#e0e0e0", "#bababa", "#878787", "#4d4d4d", "#1a1a1a", "#40004b", "#762a83", "#9970ab", "#c2a5cf", "#e7d4e8", "#f7f7f7", "#d9f0d3", "#a6dba0", "#5aae61", "#1b7837", "#00441b"];

    var scatter = scatterplot()

        .key(function (d) {

            return d.name

        })

        .width(document.body.clientHeight - 350)

        .height(document.body.clientHeight - 350);

    // load csv file and create the chart

    d3.csv('data/nutrients.csv', function (data) {

        var colorMap = {};

        _(data).chain()

            .pluck('group')

            .uniq()

            .each(function (d, i) {

                colorMap[d] = colorList.length > i ? colorList[i] : "black";

            });

        var color = function (d) {

            return colorMap[d.group];

        };

        transparency.domain([1, data.length]);

        parcoords

            .data(data)

            .hideAxis(["name"])

            .alpha(transparency(data.length))

            .color(color)

            .composite("darken")

            .margin({top: 24, left: 140, bottom: 12, right: 0})

            .mode("queue")

            .render()

            .brushMode("1D-axes");  // enable brushing

        scatter.data(data)("#scatter");

        // create data table, row hover highlighting

        var grid = d3.divgrid();

        d3.select("#grid")

            .datum(data.slice(0, 10))

            .call(grid)

            .selectAll(".row")

            .on({

                "mouseover": function (d) {

                    parcoords.highlight([d])

                },

                "mouseout": parcoords.unhighlight

            });

        // update data table on brush event

        parcoords.on("brush", function (d) {

            parcoords.alpha(transparency(d.length));

            scatter.show(d);

            d3.select("#grid")

                .datum(d.slice(0, 30))

                .call(grid)

                .selectAll(".row")

                .on({

                    "mouseover": function (d) {

                        parcoords.highlight([d])

                    },

                    "mouseout": parcoords.unhighlight

                });

        });

        window.onresize = function () {

            parcoords.width(document.body.clientWidth);

            parcoords.resize();

            scatter

                .width(document.body.clientHeight - 350)

                .height(document.body.clientHeight - 350)

                .update();

        };

    });

</script>

</body>

</html>
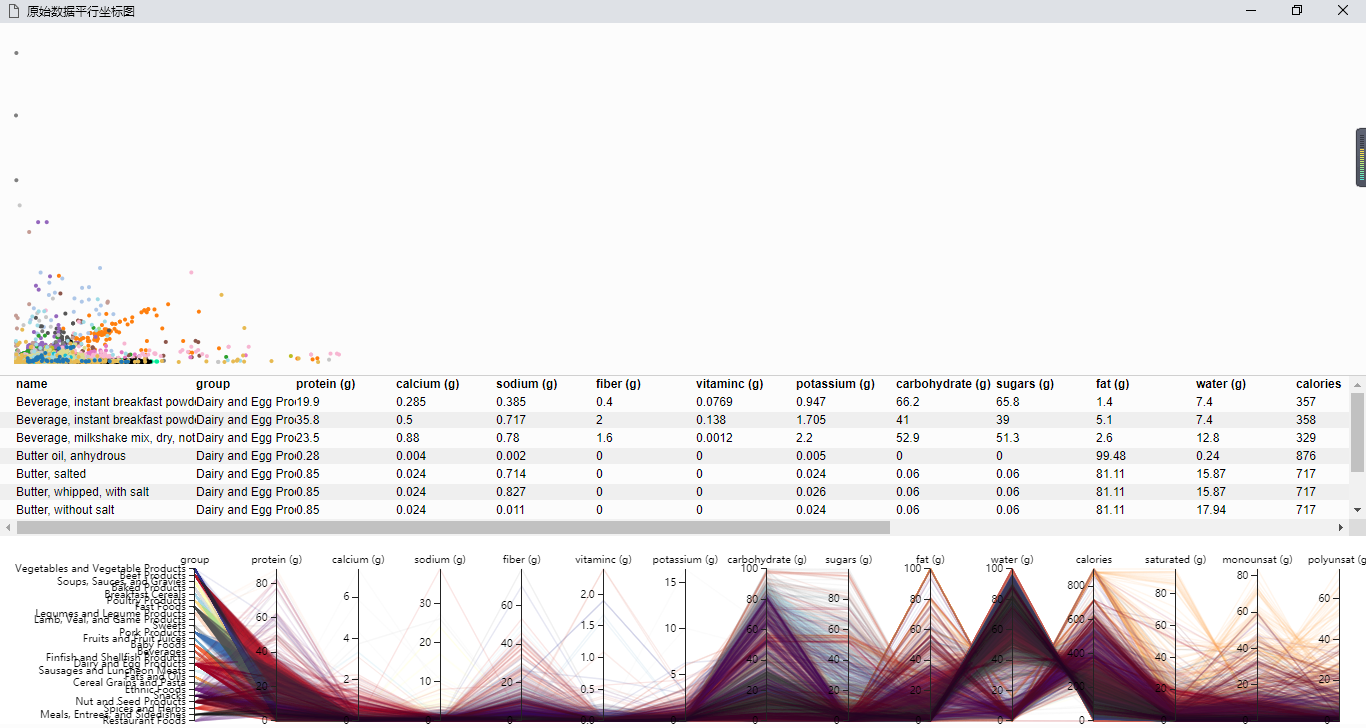
效果截图:
D3.js绘制平行坐标图的更多相关文章
- 利用d3.js绘制雷达图
利用d3,js将数据可视化,能够做到数据与代码的分离.方便以后改动数据. 这次利用d3.js绘制了一个五维的雷达图.即将多个对象的五种属性在一张图上对照. 数据写入data.csv.数据类型写入typ ...
- [js]d3.js绘制拓扑树
echart也支持拓扑树了 所需的json数据格式: children嵌套 vis.js也支持绘制拓扑树 数据格式: nodes: {id, label, title} edges: {from, t ...
- 利用d3.js绘制中国地图
d3.js是一个比較强的数据可视化js工具. 利用它画了一幅中国地图,例如以下图所看到的: watermark/2/text/aHR0cDovL2Jsb2cuY3Nkbi5uZXQvc3ZhcDE=/ ...
- d3.js 绘制极坐标图(polar plot)
0.引言 在极坐标系中,任意位置可由一个夹角和一段相对原点(极点)的距离表示.也就是说,我们可以用 (angle,r) 来表示极坐标系中的点. 1.数据 假设我们有如下数据集[ [10, 0.2], ...
- d3.js 绘制北京市地铁线路状况图(部分)
地铁线路图的可视化一直都是路网公司的重点,今天来和大家一起绘制线路图.先上图. 点击线路按钮,显示相应的线路.点击线路图下面的站间按钮(图上未显示),上报站间故障. 首先就是制作json文件,这个文件 ...
- D3.js绘制 颜色:RGB、HSL和插值 (V3版本)
颜色和插值 计算机中的颜色,常用的标准有RGB和HSL. RGB:色彩模式是通过对红(Red).绿(Green).蓝(Blue)三个颜色通道相互叠加来得到额各式各样的颜色.三个通道的值得范围都 ...
- R和Tableau平行坐标图
R平行坐标图 library(lattice)data(iris)parallelplot( ~ iris[1:4], iris, groups = Species, horizontal.a ...
- iOS绘制坐标图,折线图-Swift
坐标图,经常会在各种各样的App中使用,最常用的一种坐标图就是折线图,根据给定的点绘制出对应的坐标图是最基本的需求.由于本人的项目需要使用折线图,第一反应就是搜索已经存在的解决方案,因为这种需求应该很 ...
- D3.js (v3)+react框架 基础部分之认识选择集和如何绘制一个矢量图
首先需要下载安装d3.js : yarn add d3 然后在组建中引入 : import * as d3 from 'd3' 然后定义一个方法,在componentDidMount()这个钩子 ...
随机推荐
- python切片、列表解析、元组
1.列表解析 test = [x**2 for x in range(1,11)] 2.切片 test1 = ["a","b","c",&q ...
- Win10 安装配置Android sdk及adb环境变量
今天在新买的win10系统笔记本上安装配置adb,开始觉得挺简单的事,公司win7电脑上有现成的,但实际过程中……没想的那么简单了!好了,废话少说,直接正题. 研究了好一会下,总算搞定,总结如下: 1 ...
- Utimate Visual 2013 突然间无法新建项目工程解决
问题: 我用的Win7 安装的VS2013,这一段时间用的好好的,突然间新建工程师向导页面跳转不过去... 解决: 参考:http://stackoverflow.com/questions/1225 ...
- ARM汇编程序中的伪指令
转自http://blog.chinaunix.net/uid-13701930-id-336459.html 4.1 ARM汇编器所支持的伪指令 在ARM汇编语言程序里,有一些特殊指令助记符,这些助 ...
- Logstash 算术运算操作
需求:input为json,output为ES,需使用filter提取json中的某个字段,并执行加法.加法.乘法等算法操作 思路:mutate过滤器+ruby过滤器实现 避坑:根据ES及Logsta ...
- 20145233《网络对抗》Exp5 MSF基础应用
20145233<网络对抗>Exp5 MSF基础应用 实验问题思考 什么是exploit,payload,encode exploit是发现了的可以利用的安全漏洞或者配置弱点,这类模块存储 ...
- Discuz!和jQuery冲突的解决办法
Common.js是官方自带的,我没改过它,所以不可能出错,所以问题就应该是两者冲突了.导致的结果我也发现了,前台的DIY功能不能用了. 我还花了很多时间在那里研究冲突的地方,后来还是没能解决.之 ...
- WPF 添加OCX控件
1. 在计算机上安装OCX控件 2.创建WPF应用程序 3.打开工具箱 4.单击COM 组件选项卡上,选择安装的控件,,然后单击确定,将控件添加到工具箱 5.在解决方案资源管理器,右键单击UserCo ...
- EasyFastCMS系列教学课程——1、三层框架的搭建
在本系列教程中,我们以一个大型CMS系统的完整开发流程为例,和大家一起探讨net开发的经验和教训.在本程序中,我们采用了流行的三层/N层框架+仓储模式的架构模式.项目分层示意图: 各层的主要用 ...
- 支付机构MRC模
一.电商RFM模型 RFM模型是一个简单的根据客户的活跃程度和交易金额贡献所做的分类.因为操作简单,所以较为常用. 近度R:R代表客户最近的活跃时间距离数据采集点的时间距离,R越大,表示客户越久未发生 ...