Highcharts 基本曲线图;Highcharts 带有数据标签曲线图表;Highcharts 异步加载数据曲线图表
Highcharts 基本曲线图
实例
文件名:highcharts_line_basic.htm
<html>

<head>

<meta charset="UTF-8" />

<title>Highcharts 教程 | 菜鸟教程(runoob.com)</title>

<script src="http://apps.bdimg.com/libs/jquery/2.1.4/jquery.min.js"></script>

<script src="http://code.highcharts.com/highcharts.js"></script>

</head>

<body>

<div id="container" style="width: 550px; height: 400px; margin: 0 auto"></div>

<script language="JavaScript">

$(document).ready(function() {

   var title = {

      text: '城市平均气温'

   };

   var subtitle = {

      text: 'Source: runoob.com'

   };

   var xAxis = {

      categories: ['Jan', 'Feb', 'Mar', 'Apr', 'May', 'Jun',

         'Jul', 'Aug', 'Sep', 'Oct', 'Nov', 'Dec']

   };

   var yAxis = {

      title: {

         text: 'Temperature (\xB0C)'

      },

      plotLines: [{

         value: 0,

         width: 1,

         color: '#808080'

      }]

   };

   var tooltip = {

      valueSuffix: '\xB0C'

   }

   var legend = {

      layout: 'vertical',

      align: 'right',

      verticalAlign: 'middle',

      borderWidth: 0

   };

   var series =  [

      {

         name: 'Tokyo',

         data: [7.0, 6.9, 9.5, 14.5, 18.2, 21.5, 25.2,

            26.5, 23.3, 18.3, 13.9, 9.6]

      },

      {

         name: 'New York',

         data: [-0.2, 0.8, 5.7, 11.3, 17.0, 22.0, 24.8,

            24.1, 20.1, 14.1, 8.6, 2.5]

      },

      {

         name: 'London',

         data: [3.9, 4.2, 5.7, 8.5, 11.9, 15.2, 17.0,

            16.6, 14.2, 10.3, 6.6, 4.8]

      }

   ];

   var json = {};

   json.title = title;

   json.subtitle = subtitle;

   json.xAxis = xAxis;

   json.yAxis = yAxis;

   json.tooltip = tooltip;

   json.legend = legend;

   json.series = series;

   $('#container').highcharts(json);

});

</script>

</body>

</html>
View Cod
以上实例输出结果为:

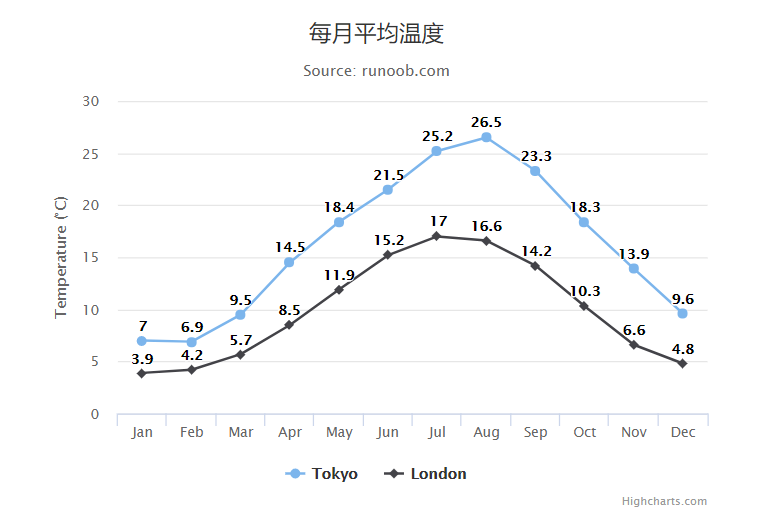
Highcharts 带有数据标签曲线图表
实例
文件名:highcharts_line_labels.htm
<html>

<head>

<meta charset="UTF-8" />

<title>Highcharts 教程 | 菜鸟教程(runoob.com)</title>

<script src="http://apps.bdimg.com/libs/jquery/2.1.4/jquery.min.js"></script>

<script src="http://code.highcharts.com/highcharts.js"></script>

</head>

<body>

<div id="container" style="width: 550px; height: 400px; margin: 0 auto"></div>

<script language="JavaScript">

$(document).ready(function() {

   var title = {

      text: '每月平均温度'

   };

   var subtitle = {

      text: 'Source: runoob.com'

   };

   var xAxis = {

      categories: ['Jan', 'Feb', 'Mar', 'Apr', 'May', 'Jun',

         'Jul', 'Aug', 'Sep', 'Oct', 'Nov', 'Dec']

   };

   var yAxis = {

      title: {

         text: 'Temperature (\xB0C)'

      }

   };

   var plotOptions = {

      line: {

         dataLabels: {

            enabled: true

         },

         enableMouseTracking: false

      }

   };

   var series= [{

         name: 'Tokyo',

         data: [7.0, 6.9, 9.5, 14.5, 18.4, 21.5, 25.2, 26.5, 23.3, 18.3, 13.9, 9.6]

      }, {

         name: 'London',

         data: [3.9, 4.2, 5.7, 8.5, 11.9, 15.2, 17.0, 16.6, 14.2, 10.3, 6.6, 4.8]

      }

   ];

   var json = {};

   json.title = title;

   json.subtitle = subtitle;

   json.xAxis = xAxis;

   json.yAxis = yAxis;

   json.series = series;

   json.plotOptions = plotOptions;

   $('#container').highcharts(json);

});

</script>

</body>

</html>
以上实例输出结果为:

Highcharts 异步加载数据曲线图表
导入 data.js 文件
异步加载数据需要引入以下js 文件:
<script src="http://code.highcharts.com/modules/data.js"></script>
配置
X 轴
以每周为间隔设置 X 轴:
var xAxis = {

   tickInterval: 7 * 24 * 3600 * 1000, // 一周

   tickWidth: 0,

   gridLineWidth: 1,

   labels: {

      align: 'left',

      x: 3,

      y: -3

   }

};
Y 轴
以每周为间隔设置 Y 轴:
配置两个 Y 轴:
var yAxis = [{ // 左边 Y 轴

      title: {

         text: null

      },

      labels: {

         align: 'left',

         x: 3,

         y: 16,

         format: '{value:.,0f}'

      },

      showFirstLabel: false

  },{ // 右边 Y 轴

      linkedTo: 0,

      gridLineWidth: 0,

      opposite: true,

      title: {

         text: null

      },

      labels: {

         align: 'right',

         x: -3,

         y: 16,

         format: '{value:.,0f}'

      },

      showFirstLabel: false

   }

];
plotOptions
plotOptions用于设置图表中的数据点相关属性。
 var plotOptions = {

   series: {

      cursor: 'pointer',

      point: {

         events: {

            click: function (e) {

               hs.htmlExpand(null, {

                  pageOrigin: {

                     x: e.pageX || e.clientX,

                     y: e.pageY || e.clientY

                  },

                  headingText: this.series.name,

                  maincontentText: Highcharts.dateFormat('%A, %b %e, %Y', this.x)

                     + ':<br/> ' + this.y + ' visits',

                  width: 200

               });

            }

         }

      },

      marker: {

        lineWidth: 1

      }

   }

}
实例
文件名:highcharts_line_ajax.html
<html>

<head>

   <title>Highcharts 教程 | 菜鸟教程(runoob.com)</title>

   <script src="http://apps.bdimg.com/libs/jquery/2.1.4/jquery.min.js"></script>

   <script src="http://code.highcharts.com/highcharts.js"></script>

   <script src="http://code.highcharts.com/modules/data.js"></script>

</head>

<body>

<div id="container" style="width: 550px; height: 400px; margin: 0 auto"></div>

<script language="JavaScript">

$(document).ready(function() {

   var title = {

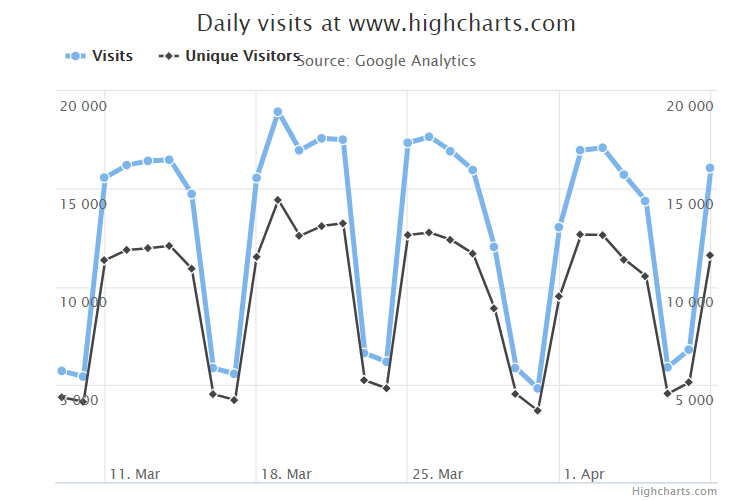
      text: 'Daily visits at www.highcharts.com'

   };

   var subtitle = {

      text: 'Source: Google Analytics'

   };

   var xAxis = {

      tickInterval: 7 * 24 * 3600 * 1000, // one week

      tickWidth: 0,

      gridLineWidth: 1,

      labels: {

         align: 'left',

         x: 3,

         y: -3

      }

   };

   var yAxis = [{ // left y axis

         title: {

            text: null

         },

         labels: {

            align: 'left',

            x: 3,

            y: 16,

            format: '{value:.,0f}'

         },

         showFirstLabel: false

      },{ // right y axis

         linkedTo: 0,

         gridLineWidth: 0,

         opposite: true,

         title: {

            text: null

         },

         labels: {

            align: 'right',

            x: -3,

            y: 16,

            format: '{value:.,0f}'

         },

         showFirstLabel: false

      }

   ];

   var tooltip = {

      shared: true,

      crosshairs: true

   }

   var legend = {

      align: 'left',

      verticalAlign: 'top',

      y: 20,

      floating: true,

      borderWidth: 0

   };

   var plotOptions = {

      series: {

         cursor: 'pointer',

         point: {

            events: {

               click: function (e) {

                  hs.htmlExpand(null, {

                     pageOrigin: {

                        x: e.pageX || e.clientX,

                        y: e.pageY || e.clientY

                     },

                     headingText: this.series.name,

                     maincontentText: Highcharts.dateFormat('%A, %b %e, %Y', this.x)

                        + ':<br/> ' + this.y + ' visits',

                     width: 200

                  });

               }

            }

         },

         marker: {

            lineWidth: 1

         }

      }

   }

   var series =  [{

         name: 'All visits',

         lineWidth: 4,

         marker: {

            radius: 4

         }

      }, {

         name: 'New visitors'

      }]

   var json = {};

   json.title = title;

   json.subtitle = subtitle;

   json.xAxis = xAxis;

   json.yAxis = yAxis;

   json.tooltip = tooltip;

   json.legend = legend;

   json.series = series;

   json.plotOptions = plotOptions;

   $.getJSON('http://www.highcharts.com/samples/data/jsonp.php?filename=analytics.csv&callback=?',function(csv){var data ={

         csv: csv

      };

      json.data = data;

      $('#container').highcharts(json);});});</script></body></html>
以上实例输出结果为:

Highcharts 基本曲线图;Highcharts 带有数据标签曲线图表;Highcharts 异步加载数据曲线图表的更多相关文章
- vue+echarts 动态绘制图表以及异步加载数据
前言 背景:vue写的后台管理,需要将表格数据绘制成图表(折线图,柱状图),图表数据都是通过接口请求回来的. 安装 cnpm install echarts --s (我这里用了淘宝镜像,不知道同学自 ...
- Highcharts 异步加载数据曲线图表
导入 data.js 文件 异步加载数据需要引入以下js 文件: <script src="http://code.highcharts.com/modules/data.js&quo ...
- highcharts.js两种数据绑定方式和异步加载数据的使用
一,我们先来看看异步加载数据的写法(这是使用MVC的例子) 1>js写法 <script src="~/Scripts/jquery-2.1.4.min.js"> ...
- 新手教程:不写JS,在MIP页中实现异步加载数据
从需求谈起:在 MIP 页中异步加载数据 MIP(移动网页加速器) 的 加速原理 除了靠谱的 MIP-Cache CDN 加速外,最值得一提的就是组件系统.所有 JS 交互都需要使用 MIP 组件实现 ...
- winform异步加载数据到界面
做一个学习记录. 有两个需求: 1.点击按钮,异步加载数据,不卡顿UI. 2.把获取的数据加载到gridview上面. 对于需求1,2,代码如下: public delegate void ShowD ...
- 向上滚动或者向下滚动分页异步加载数据(Ajax + lazyload)[上拉加载组件]
/**** desc : 分页异步获取列表数据,页面向上滚动时候加载前面页码,向下滚动时加载后面页码 ajaxdata_url ajax异步的URL 如data.php page_val_name a ...
- 淘宝购物车页面 智能搜索框Ajax异步加载数据
如果有朋友对本篇文章的一些知识点不了解的话,可以先阅读此篇文章.在这篇文章中,我大概介绍了一下构建淘宝购物车页面需要的基础知识. 这篇文章主要探讨的是智能搜索框Ajax异步加载数据.jQuery的社区 ...
- [WP8.1UI控件编程]Windows Phone大数据量网络图片列表的异步加载和内存优化
11.2.4 大数据量网络图片列表的异步加载和内存优化 虚拟化技术可以让Windows Phone上的大数据量列表不必担心会一次性加载所有的数据,保证了UI的流程性.对于虚拟化的技术,我们不仅仅只是依 ...
- Jquery zTree结合Asp.net实现异步加载数据
zTree结合Asp.net实现异步加载数据 实现简单操作 zTree 下载 api 访问 :http://www.ztree.me/v3/main.php 例子中用到json数据转化 newtons ...
随机推荐
- C# comport 打印图像
public string GetLogo() { string logo = ""; if (!File.Exists(@"C:\bitmap.bmp")) ...
- Django:学习笔记(7)——模型进阶
Django:学习笔记(7)——模型进阶 模型的继承 我们在面向对象的编程中,一个很重要的的版块,就是类的继承.父类保存了所有子类共有的内容,子类通过继承它来减少冗余代码并进行灵活扩展. 在Djang ...
- 46. Permutations (全排列)
Given a collection of distinct numbers, return all possible permutations. For example,[1,2,3] have t ...
- BZOJ 5427: 最长上升子序列
$f[i] 表示长度为i的最长上升子序列的最后一位的最小值是多少$ 对于普通的$LIS我们可以二分确定位置去更新$ 再来考虑对于这个,如果有某一位没有确定的话 那么这一位是可以随便取的,也就是说,所有 ...
- 保持简单----纪念丹尼斯•里奇(Dennis Ritchie)
http://www.ruanyifeng.com/blog/2011/10/dennis_ritchie.html
- Spring Boot @DeleteMapping
使用DELETE方式进行交互 说明:ResponseData为自定义返回体{String code, String msg, List<?> data} PollutionData 为 ...
- python单元测试框架pytest——fixture函数(类似unitest的setup和teardown)
pytest的setup和teardown函数(曾被一家云计算面试官问到过). pytest提供了fixture函数用以在测试执行前和执行后进行必要的准备和清理工作.与python自带的unitest ...
- oracle存储过程(返回列表的存储结合游标使用)总结 以及在java中的调用
这段时间开始学习写存储过程,主要原因还是因为工作需要吧,本来以为很简单的,但几经挫折,豪气消磨殆尽,但总算搞通了,为了避免后来者少走弯路,特记述与此,同时亦对自己进行鼓励. 以下是我在开发项目中第一次 ...
- CSS Position(定位)
CSS Position(定位) 一.CSS Position(定位) position 属性指定了元素的定位类型. position 属性的五个值: static relative fixed ab ...
- Mysql 整理错误
Mysql 启动报PID错误 Starting MySQL..ERROR! The server quit without updating PID file (/usr/local/mysql/da ...
