
使用Telegraf + Influxdb + Grafana 监控SQLserver服务器的运行状况
使用Telegraf + Influxdb + Grafana 监控SQLserver服务器的运行状况
前言
本文在Debian9下采用Docker的方式安装Telegraf + Influxdb + Grafana对服务器进行监控。
首先我们需要在一台Server上安装Debian9作为监控主机,这个监控主机可以配置为可监控多台Server。
安装Docker
如果之前已经安装过旧版本的Docker,先移除旧版本的安装
sudo apt-get remove docker docker-engine docker.io containerd runc
更新apt-get
sudo apt-get update
安装依赖项
	sudo apt-get install \

    apt-transport-https \

    ca-certificates \

    curl \

    gnupg2 \

    software-properties-common
添加Docker的GPG key,命令执行成功后会显示一个OK
curl -fsSL https://download.docker.com/linux/debian/gpg | sudo apt-key add -
添加Docker的apt-get源
sudo add-apt-repository \

   "deb [arch=amd64] https://download.docker.com/linux/debian \

   $(lsb_release -cs) \

   stable"
更新apt-get源
sudo apt-get update
安装Docker
sudo apt-get install docker-ce docker-ce-cli containerd.io
验证Docker是否安装成功
sudo docker run hello-world
执行以上的命令将会从服务器上拉取hello-world的docker镜像,然后再运行,如果看到Hello from Docker!的字样代表安装成功。
安装Docker-compose
sudo curl -L "https://github.com/docker/compose/releases/download/1.24.0/docker-compose-$(uname -s)-$(uname -m)" -o /usr/local/bin/docker-compose
修改权限
sudo chmod +x /usr/local/bin/docker-compose
检查是否安装成功
root@TRPG:/opt/monitoring# docker-compose --version

docker-compose version 1.24.0, build 0aa59064
安装Docker镜像
新增一个用于安装的目录
mkdir /opt/monitoring && cd /opt/monitoring
为InfluxDB和Grafana创建一个配置文件docker-compose.yml,内容如下
version: "2"

services:

  grafana:

    image: grafana/grafana

    container_name: grafana

    restart: always

    ports:

      - 3000:3000

    networks:

      - monitoring

    volumes:

      - grafana-volume:/var/lib/grafana

  influxdb:

    image: influxdb

    container_name: influxdb

    restart: always

    ports:

      - 8086:8086

    networks:

      - monitoring

    volumes:

      - influxdb-volume:/var/lib/influxdb

networks:

  monitoring:

volumes:

  grafana-volume:

    external: true

  influxdb-volume:

    external: true
以上配置文件为Influxdb和Grafana配置了相同的网络,同时分别为他们配置了外部存储区域,外部存储的好处是可以避免Docker重启时数据和配置文件丢失。
创建Dokcer的网络和外部存储
docker network create monitoring

docker volume create grafana-volume

docker volume create influxdb-volume
使用一下命令查看是否建立成功
kevin@TRPG:/opt/monitoring# docker network ls

NETWORK ID          NAME                DRIVER              SCOPE

21e7cf397dda        bridge              bridge              local

130831cce642        host                host                local

f58bbb798bea        monitoring          bridge              local

a285f4ff4c69        none                null                local

kevin@TRPG:/opt/monitoring# docker volume ls

DRIVER              VOLUME NAME

local               grafana-volume

local               influxdb-volume
如果可以看到我们创建的网络及存储后,就可以开始拉取Influxdb的镜像,当中包含一些参数及用户名和密码
docker run --rm \

  -e INFLUXDB_DB=telegraf -e INFLUXDB_ADMIN_ENABLED=true \

  -e INFLUXDB_ADMIN_USER=admin \

  -e INFLUXDB_ADMIN_PASSWORD=supersecretpassword \

  -e INFLUXDB_USER=telegraf -e INFLUXDB_USER_PASSWORD=secretpassword \

  -v influxdb-volume:/var/lib/influxdb \

  influxdb /init-influxdb.sh
使用docker-compose启动
docker-compose up -d
检查是否运行成功
kevin@TRPG:/opt/monitoring# docker ps

CONTAINER ID        IMAGE               COMMAND                  CREATED             STATUS              PORTS                    NAMES

ddc05619ab66        grafana/grafana     "/run.sh"                47 seconds ago      Up 46 seconds       0.0.0.0:3000->3000/tcp   grafana

73efef324306        influxdb            "/entrypoint.sh infl…"   47 seconds ago      Up 45 seconds       0.0.0.0:8086->8086/tcp   influxdb
以上,Influxdb和grafana都安装和启动成功,从上面的信息可以看到Influxdb使用端口tcp 8086,Grafana使用端口tcp 3000,在浏览器打开IP:3000就可以看到Grafana的登录界面了,默认的用户名及密码都是admin,首次登陆后会提示修改密码。
登录到Grafana后,选择Add datasource ,类型选择InfluxDB,配置界面如下图
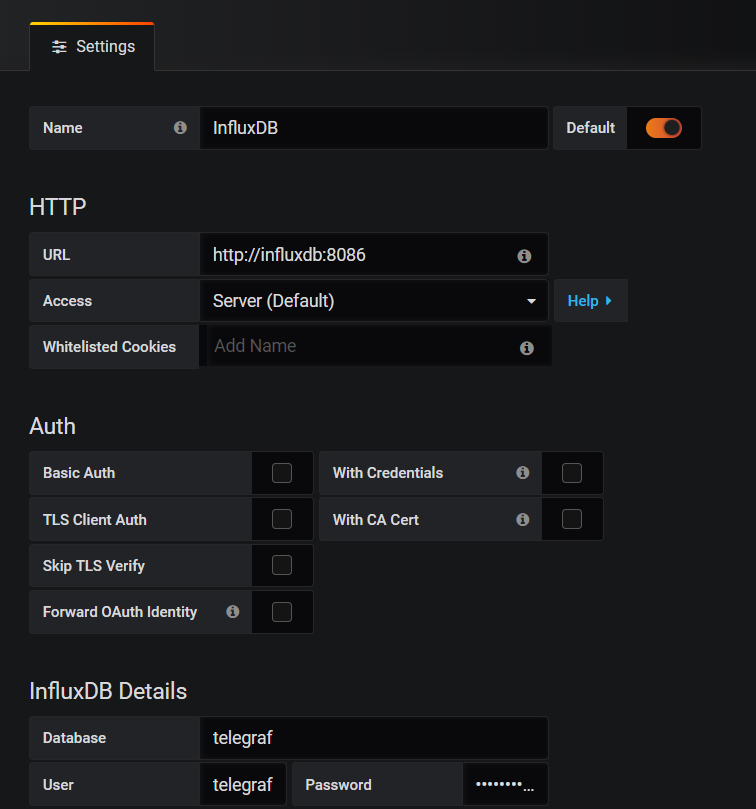
URL的部分输入的influxdb是表示之前创建的镜像名称,因为两个镜像共用了同一个网络,因此可以使用网络发现的功能,然后下面的Save & Test按钮测试配置是否成功。
在需要收集数据的服务器上安装Telegraf
到以下地址下载Telegraf的windows版本。
将下载所得文件解压缩。
将Telegraf安装为Windows服务
切换到Telegraf的存放目录下,执行一下命令安装至Windows 服务
telegraf.exe --service install
此时Telegraf的服务状态还是出于停止的状态
配置Telegraf收集相关数据
在数据库中创建Telegraf的登录用户
USE master;

GO

CREATE LOGIN [telegraf] WITH PASSWORD = N'mystrongpassword';

GO

GRANT VIEW SERVER STATE TO [telegraf];

GO

GRANT VIEW ANY DEFINITION TO [telegraf];

GO
修改配置文件如下
[[outputs.influxdb]]

  urls = ["http://192.168.0.207:8086"]

  ## The target database for metrics; will be created as needed.

  database = "telegraf"

  retention_policy = ""

  write_consistency = "any"

  ## Timeout for HTTP messages.

  timeout = "5s"

  ## HTTP Basic Auth

  username = "telegraf"

  password = "password"

 # Read metrics from Microsoft SQL Server

[[inputs.sqlserver]]

  ## Specify instances to monitor with a list of connection strings.

  ## All connection parameters are optional.

  ## By default, the host is localhost, listening on default port, TCP 1433.

  ##   for Windows, the user is the currently running AD user (SSO).

  ##   See https://github.com/denisenkom/go-mssqldb for detailed connection

  ##   parameters.

  servers = [

    "Server=127.0.0.1;Port=1433;User Id=telegraf;Password=yourpassword;app name=telegraf;log=1;",

  ]

  ## Optional parameter, setting this to 2 will use a new version

  ## of the collection queries that break compatibility with the original

  ## dashboards.

  query_version = 2

  ## If you are using AzureDB, setting this to true will gather resource utilization metrics

  # azuredb = false

  ## If you would like to exclude some of the metrics queries, list them here

  ## Possible choices:

  ## - PerformanceCounters

  ## - WaitStatsCategorized

  ## - DatabaseIO

  ## - DatabaseProperties

  ## - CPUHistory

  ## - DatabaseSize

  ## - DatabaseStats

  ## - MemoryClerk

  ## - VolumeSpace

  exclude_query = [ 'DatabaseIO', 'PerformanceCounters', 'WaitStatsCategorized', 'DatabaseProperties', 'CPUHistory', 'DatabaseSize', 'DatabaseStats', 'MemoryClerk', 'VolumeSpace' ]
测试是否连接成功
telegraf.exe --config telegraf_sql.conf -test
另外可至GITHUB下载Grafana的配置文件和对应的telgraf配置文件
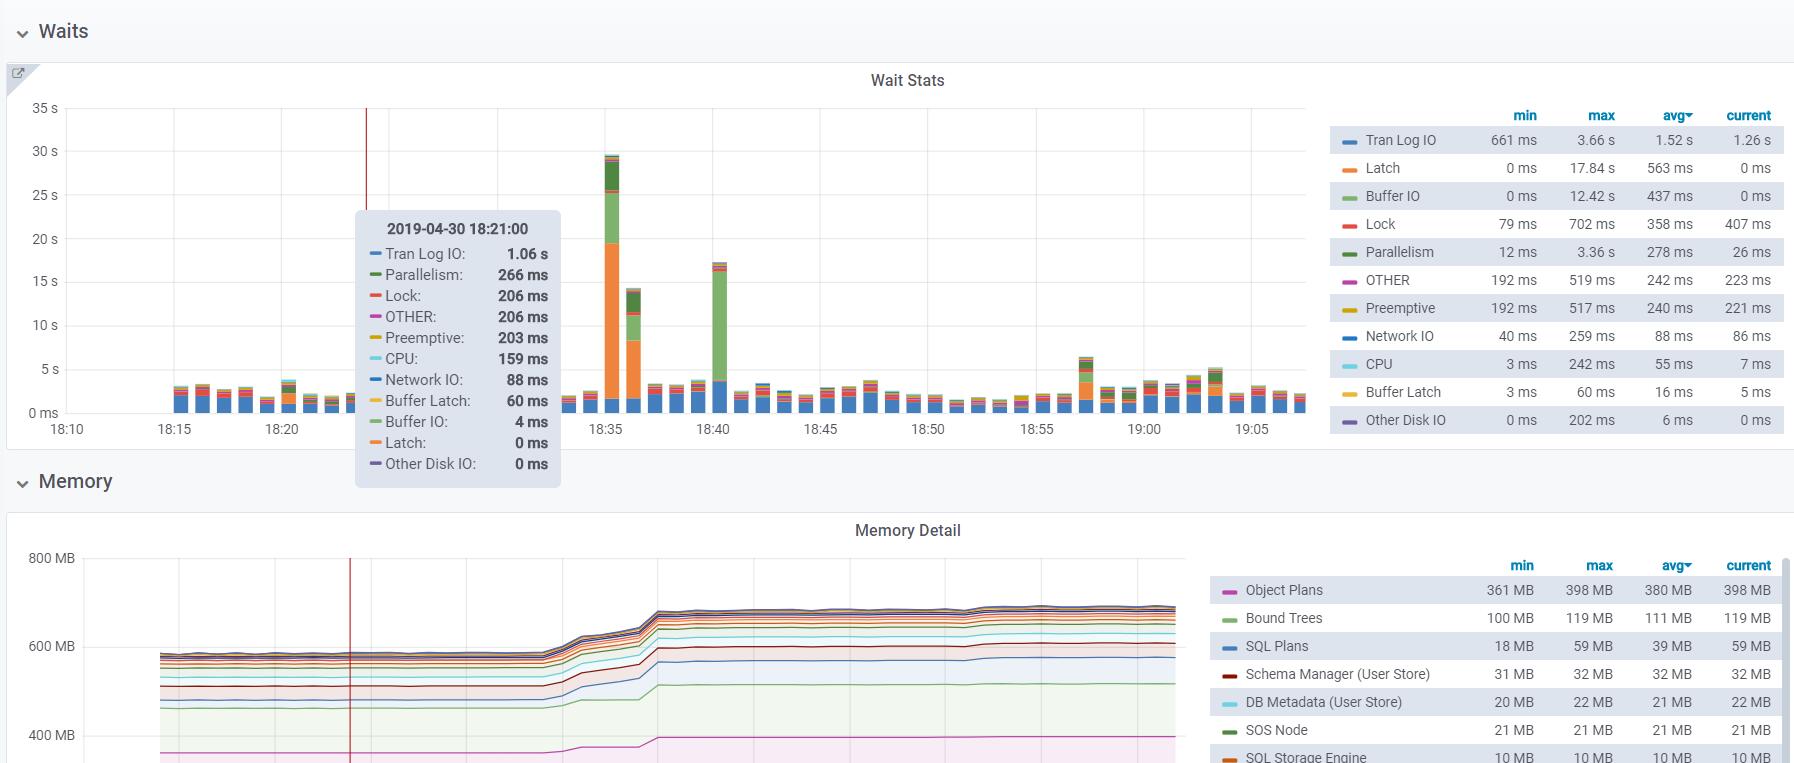
最终结果如下图
使用Telegraf + Influxdb + Grafana 监控SQLserver服务器的运行状况的更多相关文章
- 搭建 Telegraf + InfluxDB + Grafana 监控遇到几个小问题
1:如果同一台服务器上安装有多个MongoDB实例,telegraf.conf 中关于 MongoDB 如何配置?配置数据在[INPUT PLUGINS的[[inputs.mongodb]]]部分. ...
- Telegraf+InfluxDB+Grafana搭建服务器监控平台
Telegraf+InfluxDB+Grafana搭建服务器监控平台 tags:网站 个人网站:https://wanghualong.cn/ 效果展示 本站服务器状态监控:https://statu ...
- 基于telegraf+influxdb+grafana进行postgresql数据库监控
前言 随着公司postgresql数据库被广泛应用,尤其是最近多个项目在做性能测试的时候都是基于postgresql的数据库,为了确定性能瓶颈是否会出现在数据库中,数据库监控也被我推上了日程.在网上找 ...
- Telegraf+InfluxDB+Grafana快速搭建实时监控系统 监控postgresql
Telegraf+InfluxDB+Grafana快速搭建实时监控系统 监控postgresql
- [转帖] 基于telegraf, influxdb, grafana 建立 esxi 监控
[系统集成] 基于telegraf, influxdb, grafana 建立 esxi 监控 https://www.cnblogs.com/hahp/p/7677420.html 之前在 nagi ...
- Spring Boot Actutaur + Telegraf + InFluxDB + Grafana 构建监控平台之应用数据分析
本节将引入完美的granafa仪表板,在上节的基础上,并提出自己的一些监控数据的总结和看法 你可以有一个类似于这个的Dashboard,会引入监控Zimbra协作 本节环境采用的是centos7系统, ...
- [系统集成] 基于telegraf, influxdb, grafana 建立 esxi 监控
之前在 nagios 上建立了 esxi 监控,指标少.配置麻烦.视觉效果差.最近我把 esxi 监控迁移到了 influxdb+grafana 平台上,无论是监控指标.可操作性还是视觉效果都有了很大 ...
- Telegraf+Influxdb+Grafana自动化运维监控
概述:Telegraf收集信息,influxdb时序数据库存储数据,grafana平台展示数据,并进行监控告警,组成一个自动化运维监控平台. 一.influxdb InfluxDB是一个由Infl ...
- cAdvisor+InfluxDB+Grafana 监控Docker
容器的监控方案其实有很多,有docker自身的docker stats命令.有Scout.有Data Dog等等,本文主要和大家分享一下比较经典的容器开源监控方案组合:cAdvisor+InfluxD ...
随机推荐
- Spring与Redis的实现
前言 Redis作为缓存还是相当不错的,一定程度上缓解了数据库的IO操作,具体不多说,具体网上查找资料. 实战 不多说,直接上代码. 第一步:所需要的依赖 <!-- redis --> & ...
- Linux虚机密码破解
1 重启机器,在机器读秒时按回车键 2 选择要启动的操作系统按 e 3 选择kernel所在行按 e 4 末尾输入空格 single 5 敲回车 在按 b 系统将进入单用户模式 然后 可以 通过 p ...
- 一条跨库更新数据的sql
UPDATE [db1].[dbo].[R_ResAndBook] SET SectionID=TT2.newsecidFROM [SmartCampus].[dbo].[R_ResAndBo ...
- input子系统分析之一:框架
内核版本:3.9.5 输入设备总类繁杂,包括按键,键盘,触摸屏,鼠标,摇杆等等,它们本身都是字符设备,不过内核为了能将这些设备的共性抽象出来,简化驱动的开发,建立了一个Input子系统.Input子系 ...
- Apache Hive (一)Hive初识
转自:https://www.cnblogs.com/qingyunzong/p/8707885.html Hive 简介 什么是Hive 1.Hive 由 Facebook 实现并开源 2.是基于 ...
- solr的客户端操作:使用solrj进行curd操作
导入相关的jar包 <dependency> <groupId>org.apache.solr</groupId> <artifactId>solr-s ...
- Ant学习--简单实例入门
步骤1.创建工程文件夹名字 F:\Helloworld 步骤2.编写java代码: package com.netease; public class Ant_test { public static ...
- spark属性
应用属性 属性名 缺省值 意义 spark.app.name (none) The name of your application. This will appear in the UI and i ...
- c# ?和??
先看如下代码: string strParam = Request.Params["param"]; if ( strParam== null ) { strParam= ...
- svn服务,svnserve开机启动
在服务器(我的环境是centos6.5)上部署完svn之后,一般都希望每次重启的时候svn服务能够随着启动.上网搜索了一下,一般有两种做法: 一.启动脚本+/etc/rc.local启动 1. 在某个 ...