【原创】大数据基础之Hadoop(3)yarn数据收集与监控
yarn常用rest api
1 metrics
# curl http://localhost:8088/ws/v1/cluster/metrics
The cluster metrics resource provides some overall metrics about the cluster. More detailed metrics should be retrieved from the jmx interface.
{

  "clusterMetrics":

  {

    "appsSubmitted":0,

    "appsCompleted":0,

    "appsPending":0,

    "appsRunning":0,

    "appsFailed":0,

    "appsKilled":0,

    "reservedMB":0,

    "availableMB":17408,

    "allocatedMB":0,

    "reservedVirtualCores":0,

    "availableVirtualCores":7,

    "allocatedVirtualCores":1,

    "containersAllocated":0,

    "containersReserved":0,

    "containersPending":0,

    "totalMB":17408,

    "totalVirtualCores":8,

    "totalNodes":1,

    "lostNodes":0,

    "unhealthyNodes":0,

    "decommissionedNodes":0,

    "rebootedNodes":0,

    "activeNodes":1

  }

}
2 scheduler
# curl http://localhost:8088/ws/v1/cluster/scheduler
A scheduler resource contains information about the current scheduler configured in a cluster. It currently supports both the Fifo and Capacity Scheduler. You will get different information depending on which scheduler is configured so be sure to look at the type information.
{

    "scheduler": {

        "schedulerInfo": {

            "capacity": 100.0,

            "maxCapacity": 100.0,

            "queueName": "root",

            "queues": {

                "queue": [

                    {

                        "absoluteCapacity": 10.5,

                        "absoluteMaxCapacity": 50.0,

                        "absoluteUsedCapacity": 0.0,

                        "capacity": 10.5,

                        "maxCapacity": 50.0,

                        "numApplications": 0,

                        "queueName": "a",

                        "queues": {

                            "queue": [

                                {

                                    "absoluteCapacity": 3.15,

                                    "absoluteMaxCapacity": 25.0,

                                    "absoluteUsedCapacity": 0.0,

                                    "capacity": 30.000002,

                                    "maxCapacity": 50.0,

                                    "numApplications": 0,

                                    "queueName": "a1",

...
3 apps
# curl http://localhost:8088/ws/v1/cluster/apps
With the Applications API, you can obtain a collection of resources, each of which represents an application. When you run a GET operation on this resource, you obtain a collection of Application Objects.
支持参数:
* state [deprecated] - state of the application
* states - applications matching the given application states, specified as a comma-separated list.
* finalStatus - the final status of the application - reported by the application itself
* user - user name
* queue - queue name
* limit - total number of app objects to be returned
* startedTimeBegin - applications with start time beginning with this time, specified in ms since epoch
* startedTimeEnd - applications with start time ending with this time, specified in ms since epoch
* finishedTimeBegin - applications with finish time beginning with this time, specified in ms since epoch
* finishedTimeEnd - applications with finish time ending with this time, specified in ms since epoch
* applicationTypes - applications matching the given application types, specified as a comma-separated list.
* applicationTags - applications matching any of the given application tags, specified as a comma-separated list.
{

  "apps":

  {

    "app":

    [

       {

          "finishedTime" : 1326815598530,

          "amContainerLogs" : "http://host.domain.com:8042/node/containerlogs/container_1326815542473_0001_01_000001",

          "trackingUI" : "History",

          "state" : "FINISHED",

          "user" : "user1",

          "id" : "application_1326815542473_0001",

          "clusterId" : 1326815542473,

          "finalStatus" : "SUCCEEDED",

          "amHostHttpAddress" : "host.domain.com:8042",

          "progress" : 100,

          "name" : "word count",

          "startedTime" : 1326815573334,

          "elapsedTime" : 25196,

          "diagnostics" : "",

          "trackingUrl" : "http://host.domain.com:8088/proxy/application_1326815542473_0001/jobhistory/job/job_1326815542473_1_1",

          "queue" : "default",

          "allocatedMB" : 0,

          "allocatedVCores" : 0,

          "runningContainers" : 0,

          "memorySeconds" : 151730,

          "vcoreSeconds" : 103

       },

       {

          "finishedTime" : 1326815789546,

          "amContainerLogs" : "http://host.domain.com:8042/node/containerlogs/container_1326815542473_0002_01_000001",

          "trackingUI" : "History",

          "state" : "FINISHED",

          "user" : "user1",

          "id" : "application_1326815542473_0002",

          "clusterId" : 1326815542473,

          "finalStatus" : "SUCCEEDED",

          "amHostHttpAddress" : "host.domain.com:8042",

          "progress" : 100,

          "name" : "Sleep job",

          "startedTime" : 1326815641380,

          "elapsedTime" : 148166,

          "diagnostics" : "",

          "trackingUrl" : "http://host.domain.com:8088/proxy/application_1326815542473_0002/jobhistory/job/job_1326815542473_2_2",

          "queue" : "default",

          "allocatedMB" : 0,

          "allocatedVCores" : 0,

          "runningContainers" : 1,

          "memorySeconds" : 640064,

          "vcoreSeconds" : 442

       }

    ]

  }

}
收集shell脚本示例
metrics
#!/bin/sh

cluster_name="c1"

rms="192.168.0.1 192.168.0.2"

url_path="/ws/v1/cluster/metrics"

keyword="clusterMetrics"

log_name="metrics.log"

base_dir="/tmp"

log_path=${base_dir}/${log_name}

echo "`date +'%Y-%m-%d %H:%M:%S'`"

for rm in $rms

do

        url="http://${rm}:8088${url_path}"

        echo $url

        content=`curl $url`

        echo $content

        if [[ "$content" == *"$keyword"* ]]; then

                break

        fi

done

if [[ "$content" == *"$keyword"* ]]; then

        modified="${content:0:$((${#content}-1))},\"currentTime\":`date +%s`,\"clusterName\":\"${cluster_name}\"}"

        echo "$modified"

        echo "$modified" >> $log_path

else

        echo "gather metrics failed from : ${rms}, ${url_path}, ${keyword}"

fi
apps
#!/bin/sh

cluster_name="c1"

rms="192.168.0.1 192.168.0.2"

url_path="/ws/v1/cluster/apps?states=RUNNING"

keyword="apps"

log_name="apps.log"

base_dir="/tmp"

log_path=${base_dir}/${log_name}

echo "`date +'%Y-%m-%d %H:%M:%S'`"

for rm in $rms

do

        url="http://${rm}:8088${url_path}"

        echo $url

        content=`curl $url`

        echo $content

        if [[ "$content" == *"$keyword"* ]]; then

                break

        fi

done

if [[ "$content" == *"$keyword"* ]]; then

        if [[ "$content" == *"application_"* ]]; then

                postfix=",\"currentTime\":`date +%s`,\"clusterName\":\"${cluster_name}\"}"

                modified="${content:16:$((${#content}-20))}"

                echo "${modified//\"/\\\"}"|awk '{split($0,arr,"},"); for (i in arr) {print arr[i]}}'|xargs -i echo "{}$postfix" >> $log_path

        else

                echo "no apps is running"

        fi

else

        echo "gather metrics failed from : ${rms}, ${url_path}, ${keyword}"

fi
然后对接ELK
ELK
Logstash配置示例
metrics1:input json+filter mutate rename
input {

  file {

    path => "/tmp/metrics.log"

    codec => "json"

  }

}

filter {

  mutate {

    rename => {

      "[clusterMetrics][appsSubmitted]" => "[appsSubmitted]"

      "[clusterMetrics][appsCompleted]" => "[appsCompleted]"

      "[clusterMetrics][appsPending]" => "[appsPending]"

      "[clusterMetrics][appsRunning]" => "[appsRunning]"

      "[clusterMetrics][appsFailed]" => "[appsFailed]"

      "[clusterMetrics][appsKilled]" => "[appsKilled]"

      "[clusterMetrics][reservedMB]" => "[reservedMB]"

      "[clusterMetrics][availableMB]" => "[availableMB]"

      "[clusterMetrics][allocatedMB]" => "[allocatedMB]"

      "[clusterMetrics][reservedVirtualCores]" => "[reservedVirtualCores]"

      "[clusterMetrics][availableVirtualCores]" => "[availableVirtualCores]"

      "[clusterMetrics][allocatedVirtualCores]" => "[allocatedVirtualCores]"

      "[clusterMetrics][containersAllocated]" => "[containersAllocated]"

      "[clusterMetrics][containersReserved]" => "[containersReserved]"

      "[clusterMetrics][containersPending]" => "[containersPending]"

      "[clusterMetrics][totalMB]" => "[totalMB]"

      "[clusterMetrics][totalVirtualCores]" => "[totalVirtualCores]"

      "[clusterMetrics][totalNodes]" => "[totalNodes]"

      "[clusterMetrics][lostNodes]" => "[lostNodes]"

      "[clusterMetrics][unhealthyNodes]" => "[unhealthyNodes]"

      "[clusterMetrics][decommissionedNodes]" => "[decommissionedNodes]"

      "[clusterMetrics][rebootedNodes]" => "[rebootedNodes]"

      "[clusterMetrics][activeNodes]" => "[activeNodes]"

    }

    remove_field => ["clusterMetrics", "path"]

  }

#  ruby {

#    code => "event.set('@timestamp', LogStash::Timestamp.at(event.get('currentTime') + 28800))"

#  }

  date {

    match => [ "currentTime","UNIX"]

    target => "@timestamp"

  }

}
metrics2:filter json+filter mutate add_field
input {

  file {

    path => "/tmp/metrics.log"

  }

}

filter {

  json {

    source => "message"

  }

  mutate {

    add_field => {

      "appsSubmitted" => "%{[clusterMetrics][appsSubmitted]}"

      "appsCompleted" => "%{[clusterMetrics][appsCompleted]}"

      "appsPending" => "%{[clusterMetrics][appsPending]}"

      "appsRunning" => "%{[clusterMetrics][appsRunning]}"

      "appsFailed" => "%{[clusterMetrics][appsFailed]}"

      "appsKilled" => "%{[clusterMetrics][appsKilled]}"

      "reservedMB" => "%{[clusterMetrics][reservedMB]}"

      "availableMB" => "%{[clusterMetrics][availableMB]}"

      "allocatedMB" => "%{[clusterMetrics][allocatedMB]}"

      "reservedVirtualCores" => "%{[clusterMetrics][reservedVirtualCores]}"

      "availableVirtualCores" => "%{[clusterMetrics][availableVirtualCores]}"

      "allocatedVirtualCores" => "%{[clusterMetrics][allocatedVirtualCores]}"

      "containersAllocated" => "%{[clusterMetrics][containersAllocated]}"

      "containersReserved" => "%{[clusterMetrics][containersReserved]}"

      "containersPending" => "%{[clusterMetrics][containersPending]}"

      "totalMB" => "%{[clusterMetrics][totalMB]}"

      "totalVirtualCores" => "%{[clusterMetrics][totalVirtualCores]}"

      "totalNodes" => "%{[clusterMetrics][totalNodes]}"

      "lostNodes" => "%{[clusterMetrics][lostNodes]}"

      "unhealthyNodes" => "%{[clusterMetrics][unhealthyNodes]}"

      "decommissionedNodes" => "%{[clusterMetrics][decommissionedNodes]}"

      "rebootedNodes" => "%{[clusterMetrics][rebootedNodes]}"

      "activeNodes" => "%{[clusterMetrics][activeNodes]}"

    }

    convert => {

      "appsSubmitted" => "integer"

      "appsCompleted" => "integer"

      "appsPending" => "integer"

      "appsRunning" => "integer"

      "appsFailed" => "integer"

      "appsKilled" => "integer"

      "reservedMB" => "integer"

      "availableMB" => "integer"

      "allocatedMB" => "integer"

      "reservedVirtualCores" => "integer"

      "availableVirtualCores" => "integer"

      "allocatedVirtualCores" => "integer"

      "containersAllocated" => "integer"

      "containersReserved" => "integer"

      "containersPending" => "integer"

      "totalMB" => "integer"

      "totalVirtualCores" => "integer"

      "totalNodes" => "integer"

      "lostNodes" => "integer"

      "unhealthyNodes" => "integer"

      "decommissionedNodes" => "integer"

      "rebootedNodes" => "integer"

      "activeNodes" => "integer"

    }

    remove_field => ["message", "clusterMetrics", "path"]

  }

#  ruby {

#    code => "event.set('@timestamp', LogStash::Timestamp.at(event.get('currentTime') + 28800))"

#  }

  date {

    match => [ "currentTime","UNIX"]

    target => "@timestamp"

  }

}
app:input json
input {

  file {

    path => "/tmp/apps.log"

    codec => "json"

  }

}

filter {

#  ruby {

#    code => "event.set('@timestamp', LogStash::Timestamp.at(event.get('currentTime') + 28800))"

#  }

  date {

    match => [ "currentTime","UNIX"]

    target => "@timestamp"

  }

}
注意:
date插件得到的timestamp为UTC时区,
1)如果是存放到elasticsearch然后用kibana展示(kibana会自动根据浏览器时区做偏移),直接使用UTC时区就可以;
2)如果是存放到其他存储,想直接存储当前时区的时间,需要指定timezone,但是date插件使用UNIX格式时timezone不会生效,会使用系统默认时区,所以使用ruby插件转换时区;
Unix timestamps (i.e. seconds since the epoch) are by definition always UTC and @timestamp is also always UTC. The timezone option indicates the timezone of the source timestamp, but doesn't really apply when the UNIX or UNIX_MS patterns are used.
所有timezone:http://joda-time.sourceforge.net/timezones.html
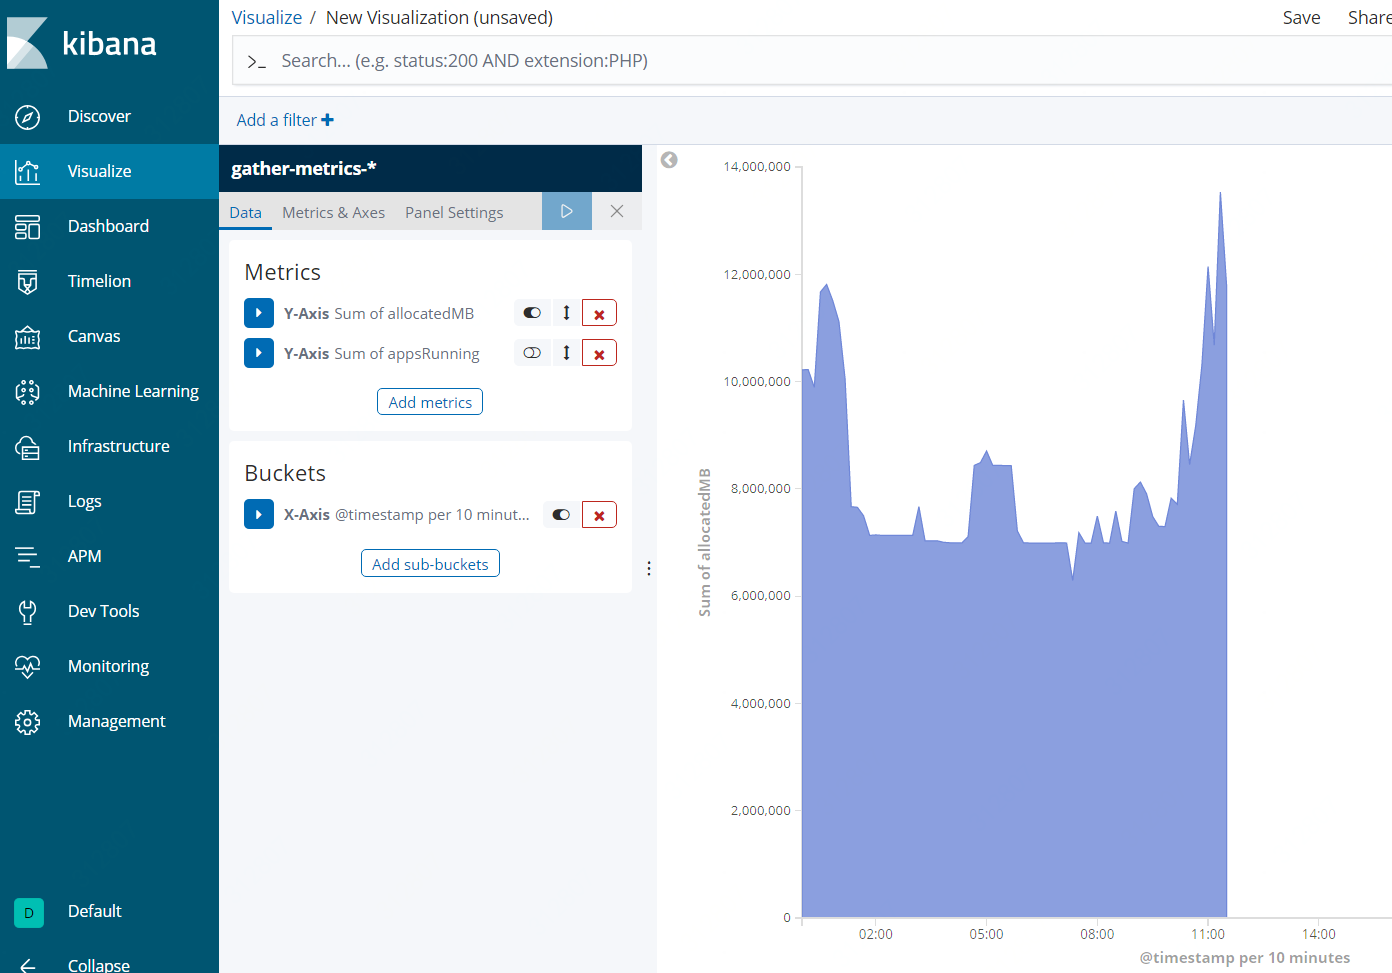
Kibana展示示例
参考:
https://hadoop.apache.org/docs/r2.7.3/hadoop-yarn/hadoop-yarn-site/ResourceManagerRest.html
https://discuss.elastic.co/t/new-timestamp-using-dynamic-timezone-not-working/97166
【原创】大数据基础之Hadoop(3)yarn数据收集与监控的更多相关文章
- 【原创】大数据基础之Hadoop(2)hdfs和yarn最简绿色部署
环境:3结点集群 192.168.0.1192.168.0.2192.168.0.3 1 配置root用户服务期间免密登录 参考:https://www.cnblogs.com/barneywill/ ...
- 【原创】大数据基础之Hadoop(1)HA实现原理
有些工作只能在一台server上进行,比如master,这时HA(High Availability)首先要求部署多个server,其次要求多个server自动选举出一个active状态server, ...
- 学习大数据基础框架hadoop需要什么基础
什么是大数据?进入本世纪以来,尤其是2010年之后,随着互联网特别是移动互联网的发展,数据的增长呈爆炸趋势,已经很难估计全世界的电子设备中存储的数据到底有多少,描述数据系统的数据量的计量单位从MB(1 ...
- 大数据基础总结---MapReduce和YARN技术原理
Map Reduce和YARN技术原理 学习目标 熟悉MapReduce和YARN是什么 掌握MapReduce使用的场景及其原理 掌握MapReduce和YARN功能与架构 熟悉YARN的新特性 M ...
- 大数据架构师基础:hadoop家族,Cloudera产品系列等各种技术
大数据我们都知道hadoop,可是还会各种各样的技术进入我们的视野:Spark,Storm,impala,让我们都反映不过来.为了能够更好的架构大数据项目,这里整理一下,供技术人员,项目经理,架构师选 ...
- 【大数据】了解Hadoop框架的基础知识
介绍 此Refcard提供了Apache Hadoop,这是最流行的软件框架,可使用简单的高级编程模型实现大型数据集的分布式存储和处理.我们将介绍Hadoop最重要的概念,描述其架构,指导您如何开始使 ...
- 大数据系列文章-Hadoop基础介绍(一)
Hadoop项目背景简介 2003-2004年,Google公开了部分GFS个Mapreduce思想的细节,以此为基础Doug Cutting等人用了2年的业余时间,实现了DFS和Mapreduce机 ...
- 【原创】大数据基础之Zookeeper(2)源代码解析
核心枚举 public enum ServerState { LOOKING, FOLLOWING, LEADING, OBSERVING; } zookeeper服务器状态:刚启动LOOKING,f ...
- 【原创】大数据基础之Impala(2)实现细节
一 架构 Impala is a massively-parallel query execution engine, which runs on hundreds of machines in ex ...
随机推荐
- react的jsx语法
在webpack.config.js中配置解析的loader { test:/\.jsx?$/, use:{ loader:"babel-loader", options:{ pr ...
- vue mock自己总结
cli安装mock模块 npm install mockjs 创建mock文件夹 配置及创建文件 当后端写好真实接口以后,我们只需删掉创建的mock.js文件和在main.js中导入假数据的那行 ...
- css3 box-shadow阴影(外阴影与外发光)讲解
基础说明: 外阴影:box-shadow: X轴 Y轴 Rpx color; 属性说明(顺序依次对应): 阴影的X轴(可以使用负值) 阴影的Y轴(可以使用负值) 阴影 ...
- Go语言协程
协程的特点 1.该任务的业务代码主动要求切换,即主动让出执行权限 2.发生了IO,导致执行阻塞(使用channel让协程阻塞) 与线程本质的不同 C#.java中我们执行多个线程,是通过时间片切换来进 ...
- Java使用J4L识别验证码
1.首先要下载j4l的相应文件和jar 下载地址:http://www.java4less.com/ocrtools/ocrtools.php?info=download 2.下载完成之后解压,文件目 ...
- [SCOI2009] 迷路
题目类型:拆点, 矩阵快速幂 转化为矩阵快速幂,好题! 传送门:>Here< 题意:给出邻接矩阵,求\(1\)到\(N\)恰好长度为\(T\)的路径方案数 解题思路 如果题目给出的是一个\ ...
- Java【第十篇】集合
Java 集合概述 Java 集合就像一种容器,可以把多个对象的引用放入容器中.Java 集合类可以用于存储数量不等的多个对象,还可用于保存具有映射关系的关联数组Java 集合可分为 Set.List ...
- [HAOI2008]糖果传递 结论题
题目描述 有\(n(n<1000000)\)个小朋友坐成一圈,每人有\(a_i\)个糖果.每人只能给左右两人传递糖果.每人每次传递一个糖果代价为\(1\),求使所有人糖果数相等的最小代价. 暴力 ...
- linux串口编程设置(转载)
(转载)在嵌入式Linux中,串口是一个字设备,访问具体的串行端口的编程与读/写文件 的操作类似,只需打开相应的设备文件即可操作.串口编程特殊在于串 口通信时相关参数与属性的设置.嵌入式Linux的串 ...
- Python之路(第十七篇)logging模块
一.logging模块 (一).日志相关概念 日志是一种可以追踪某些软件运行时所发生事件的方法.软件开发人员可以向他们的代码中调用日志记录相关的方法来表明发生了某些事情.一个事件可以用一个可包含可选变 ...