
ELK的高级篇(测试记录各种日志)
一、elk架构已经完成情况情况下
1)一个脚本收集多个日志,if 判断写入es的索引
[root@k8s6 conf.d]# cat file.conf

input {

    file{

        path => ["/var/log/messages", "/var/log/secure"]

        type => "system-log"

        start_position => "beginning"

    }

    file{

        path => ["/var/log/elasticsearch/myes.log"]

        type => "es-log"

        start_position => "beginning"

    }

}

filter{

}

output{

    if [type] == "system-log" {

        elasticsearch {

            hosts => ["192.168.10.22:9200"]

            index => "system-log-%{+YYYY.MM}"

        }

    }

    if [type] == "es-log" {

        elasticsearch {

            hosts => ["192.168.10.22:9200"]

            index => "es-log-%{+YYYY.MM}"

        }

    }

}
[root@k8s6 conf.d]# /opt/logstash/bin/logstash -f /etc/logstash/conf.d/file.conf 启动去kibana查看
Java日志为多行一个事件,需要被处理
2)调试遇到 中括号就为一个事件
[root@k8s6 conf.d]# cat /etc/logstash/conf.d/codec.conf

input {

    stdin {

        codec => multiline{

            pattern => "^\["

            negate => true

            what => "previous"

        }

    }

}

filter{

}

output{

    stdout {

        codec => rubydebug

    }

}
codec.conf
启动测试
[root@k8s6 conf.d]# /opt/logstash/bin/logstash -f /etc/logstash/conf.d/codec.conf

Settings: Default pipeline workers:

Pipeline main started

[你好啊

gitd^H^Hgird

hei, hai

[

{

    "@timestamp" => "2019-03-15T11:52:51.012Z",

       "message" => "[你好啊\ngitd\b\bgird\nhei, hai",

      "@version" => "",

          "tags" => [

        [] "multiline"

    ],

          "host" => "k8s6"

}
3)修改file文件,记录Java日志(es的日志)添加了codec参数
[root@k8s6 ~]# cat /etc/logstash/conf.d/file.conf

input {

    file{

        path => ["/var/log/messages", "/var/log/secure"]

        type => "system-log"

        start_position => "beginning"

    }

    file{

        path => ["/var/log/elasticsearch/myes.log"]

        type => "es-log"

        start_position => "beginning"

                codec => multiline{

            pattern => "^\["

            negate => true

            what => "previous"

        }

    }

}

filter{

}

output{

    if [type] == "system-log" {

        elasticsearch {

            hosts => ["192.168.10.22:9200"]

            index => "system-log-%{+YYYY.MM}"

        }

    }

    if [type] == "es-log" {

        elasticsearch {

            hosts => ["192.168.10.22:9200"]

            index => "es-log-%{+YYYY.MM}"

        }

    }

}
file.conf
启动之前,需要删除之前启动生成文件内容,由于在前台启动的,默认在家目录的隐藏文件 ls /root/ -a
正常在后台启动下: ls /var/lib/logstash/ -a
并且还要去es的head插件删除该节点
4)删除2内容和节点后,再次启动服务
[root@k8s6 ~]# /opt/logstash/bin/logstash -f /etc/logstash/conf.d/file.conf
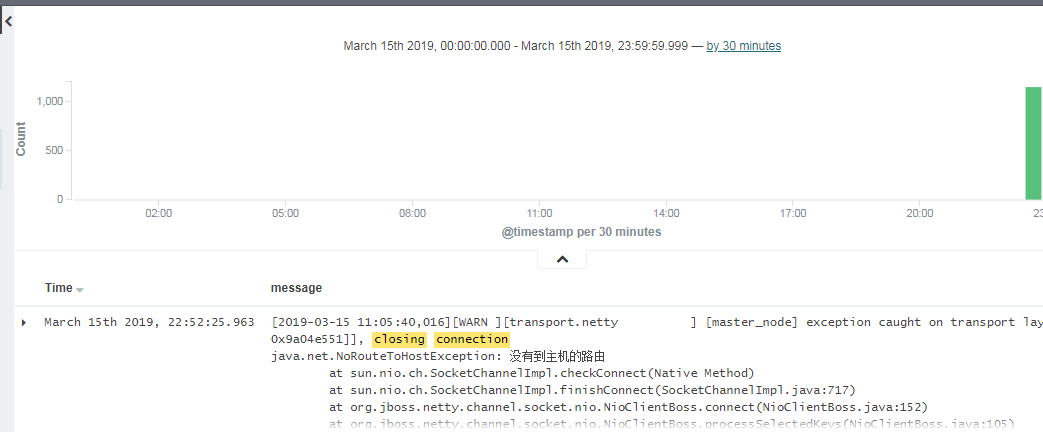
java的多行日志被分开
二、监控nginx日志
1)快速安装nginx
寻找:https://mirrors.aliyun.com/epel/
yum install -y nginx

wget https://mirrors.aliyun.com/epel/epel-release-latest-7.noarch.rpm

yum install wget -y

wget https://mirrors.aliyun.com/epel/epel-release-latest-7.noarch.rpm

rpm -ivh epel-release-latest-.noarch.rpm

yum instal nginx -y
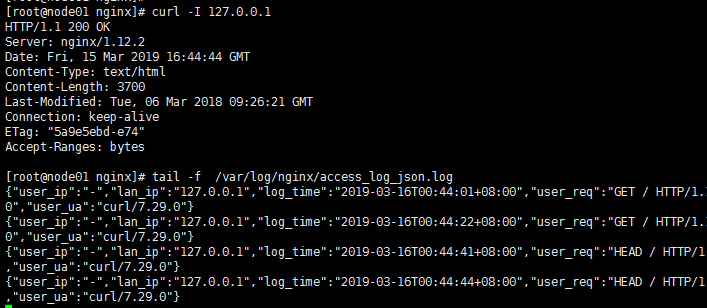
2)修改配置文件,存为json数据,只修改了部分
http {

    log_format  main  '$remote_addr - $remote_user [$time_local] "$request" '

                      '$status $body_bytes_sent "$http_referer" '

                      '"$http_user_agent" "$http_x_forwarded_for"';

    log_format access_log_json  '{"user_ip":"$http_x_real_ip","lan_ip":"$remote_addr","log_time":"$time_iso8601","user_req":"$request","http_code":"$status","body_bytes_sent":"$body_bytes_sent","req_time":"$request_time","user_ua":"$http_user_agent"}';

    access_log  /var/log/nginx/access_log_json.log  access_log_json;
3)屏幕输出nginx日志
[root@node01 conf.d]# cat /etc/logstash/conf.d/nginx.conf

input{

    file {

        path => "/var/log/nginx/access_log_json.log"

        codec => "json"

    }

}

filter{

}

output{

    stdout {

        codec => rubydebug

    }

}
nginx.conf
启动调试模式,测试
[root@node01 conf.d]# /opt/logstash/bin/logstash -f /etc/logstash/conf.d/nginx.conf

Settings: Default pipeline workers:

Pipeline main started

{

            "user_ip" => "-",

             "lan_ip" => "10.8.0.18",

           "log_time" => "2019-03-16T00:57:19+08:00",

           "user_req" => "GET / HTTP/1.1",

          "http_code" => "",

    "body_bytes_sent" => "",

           "req_time" => "0.000",

            "user_ua" => "Mozilla/5.0 (Windows NT 6.1; WOW64; Trident/7.0; rv:11.0) like Gecko",

           "@version" => "",

         "@timestamp" => "2019-03-15T16:57:20.127Z",

               "path" => "/var/log/nginx/access_log_json.log",

               "host" => "node01"

}
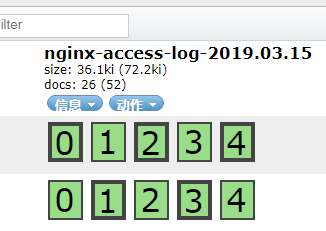
4)存入es服务,并屏幕输出调试。 写入之前先在家目录下删除.sincedb 文件
[root@node01 ~]# /etc/init.d/logstash start
[root@node01 conf.d]# cat /etc/logstash/conf.d/nginx.conf

input{

    file {

        path => "/var/log/nginx/access_log_json.log"

        codec => "json"

    }

}

filter{

}

output{

    elasticsearch {

        hosts => ["192.168.10.22:9200"]

        index => "nginx-access-log-%{+YYYY.MM.dd}"

    }

     stdout {

        codec => rubydebug

    }

}
/opt/logstash/bin/logstash -f /etc/logstash/conf.d/nginx.conf
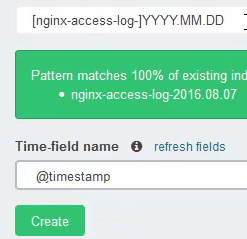
在kibana中配置时,注意时间格式
三、记录系统日志,rsyslog服务的日志文件
1)由于rsyslog系统文件较少,即所有机器都存在一起
思路,n1机器 启动logstash配置文件,监听514端口
其他机器修改 /etc/rsyslog.conf 配置
最后一行改为 *.* @@192.168.10.23:514 该服务的日志就会写入n1的logstash服务里
2)node1,的logstash配置文件如下,调试模式
[root@node01 conf.d]# cat syslog.conf

input{

    syslog {

        type => "system-syslog"

        port =>

    }

}

filter{

}

output{

     stdout {

        codec => rubydebug

    }

}
syslog.conf
[root@node01 conf.d]# /opt/logstash/bin/logstash -f /etc/logstash/conf.d/syslog.conf 启动服务
可以查看端口
[root@node01 ~]# netstat -lntup|grep

tcp6              :::                  :::*                    LISTEN      /java

udp6              :::                  :::*                                /java
其他机器修改配置文件
[root@k8s6 ~]# tail - /etc/rsyslog.conf

*.* @@192.168.10.23:

# ### end of the forwarding rule ###
[root@k8s6 ~]# systemctl restart rsyslog 重启服务,日志将发送到192.168.10.23的机器中
3)使用 logger 命令也可产生系统日志
[root@k8s6 ~]# logger hellow world
监听的日志
{

           "message" => "hellow world\n",

          "@version" => "",

        "@timestamp" => "2019-03-16T05:30:58.000Z",

              "type" => "system-syslog",

              "host" => "192.168.10.22",

          "priority" => ,

         "timestamp" => "Mar 16 13:30:58",

         "logsource" => "k8s6",

           "program" => "root",

          "severity" => ,

          "facility" => ,

    "facility_label" => "user-level",

    "severity_label" => "Notice"

}
3)存入es中的配置文件
[root@node01 conf.d]# cat /etc/logstash/conf.d/syslog.conf

input{

    syslog {

        type => "system-syslog"

        port =>

    }

}

filter{

}

output{

    elasticsearch {

        hosts => ["192.168.10.22:9200"]

        index => "system-syslog-%{+YYYY.MM}"

    }

}
"system-syslog-%{+YYYY.MM}"
在kibana中查询

四、监听tcp的日志
1.1)node01调试模式下启动服务
[root@node01 conf.d]# cat  /etc/logstash/conf.d/tcp.conf

input{

    tcp {

        type => "tcp"

        port => ""

        mode => "server"

    }

}

filter{

}

output{

    stdout {

        codec => rubydebug

    }

}
tcp.conf
启动监听程序 :[root@node01 conf.d]# /opt/logstash/bin/logstash -f /etc/logstash/conf.d/tcp.conf
查看端口
[root@node01 ~]# netstat -lntup|grep

tcp6              :::                 :::*                    LISTEN      /java
1.2)另一台机器模拟发送tcp日志
[root@k8s6 ~]# yum install nc -y

[root@k8s6 ~]# echo "hello" |nc 192.168.10.23
也可以发送文件 [root@k8s6 ~]# nc 192.168.10.23 6666 < /etc/resolv.conf
伪设备的发送方式 [root@k8s6 ~]# echo "hello world" > /dev/tcp/192.168.10.23/6666
1.3)查看监听的程序输出
[root@node01 conf.d]# /opt/logstash/bin/logstash -f /etc/logstash/conf.d/tcp.conf

Settings: Default pipeline workers:

Pipeline main started

{

       "message" => "hello",

      "@version" => "",

    "@timestamp" => "2019-03-16T08:00:49.445Z",

          "host" => "192.168.10.22",

          "port" => ,

          "type" => "tcp"

}
五、收集Apache日志
1.1)查看logstash的预定义插件
[root@node01 patterns]# pwd

/opt/logstash/vendor/bundle/jruby/1.9/gems/logstash-patterns-core-2.0./patterns

[root@node01 patterns]# head grok-patterns

USERNAME [a-zA-Z0-._-]+

USER %{USERNAME}

EMAILLOCALPART [a-zA-Z][a-zA-Z0-9_.+-=:]+

EMAILADDRESS %{EMAILLOCALPART}@%{HOSTNAME}

HTTPDUSER %{EMAILADDRESS}|%{USER}

INT (?:[+-]?(?:[-]+))

BASE10NUM (?<![-.+-])(?>[+-]?(?:(?:[-]+(?:\.[-]+)?)|(?:\.[-]+)))

NUMBER (?:%{BASE10NUM})

BASE16NUM (?<![-9A-Fa-f])(?:[+-]?(?:0x)?(?:[-9A-Fa-f]+))

BASE16FLOAT \b(?<![-9A-Fa-f.])(?:[+-]?(?:0x)?(?:(?:[-9A-Fa-f]+(?:\.[-9A-Fa-f]*)?)|(?:\.[-9A-Fa-f]+)))\b
/opt/logstash/vendor/bundle/jruby/1.9/gems/logstash-patterns-core-2.0.5/patterns
1.2)filter中,grok插件的使用
grok查看官网
https://www.elastic.co/guide/en/logstash/current/plugins-filters-grok.html
1.3)根据官网调试日志
[root@k8s6 conf.d]# cat /etc/logstash/conf.d/grok.conf

input{

    stdin {}

}

filter{

    grok {

        match => { "message" => "%{IP:client} %{WORD:method} %{URIPATHPARAM:request} %{NUMBER:bytes} %{NUMBER:duration}" }

    }

}

output{

    stdout {

        codec => rubydebug

    }

}
/etc/logstash/conf.d/grok.conf
1.4)启动查看日志输出
[root@k8s6 conf.d]# /opt/logstash/bin/logstash -f /etc/logstash/conf.d/grok.conf

Settings: Default pipeline workers:

Pipeline main started

55.3.244.1 GET /index.html  0.043

{

       "message" => "55.3.244.1 GET /index.html 15824 0.043",

      "@version" => "",

    "@timestamp" => "2019-03-16T09:25:51.670Z",

          "host" => "k8s6",

        "client" => "55.3.244.1",

        "method" => "GET",

       "request" => "/index.html",

         "bytes" => "",

      "duration" => "0.043"

}
/opt/logstash/bin/logstash -f /etc/logstash/conf.d/grok.conf
2.1)调试apache日志
寻找apache的日志插件
[root@node01 patterns]# vim /opt/logstash/vendor/bundle/jruby/1.9/gems/logstash-patterns-core-2.0./patterns/grok-patterns

COMBINEDAPACHELOG    找到这个
COMBINEDAPACHELOG
2.2)编辑apache的日志bug模式
[root@k8s6 conf.d]# cat apache-grok.conf

input{

    file {

        path => "/var/log/httpd/access_log"

        start_position => "beginning"

    }

}

filter{

    grok {

        match => { "message" => "%{COMBINEDAPACHELOG}" }

    }

}

output{

    stdout {

        codec => rubydebug

    }

}
apache-grok.conf
启动测试
[root@k8s6 conf.d]# /opt/logstash/bin/logstash -f /etc/logstash/conf.d/apache-grok.conf

Settings: Default pipeline workers:

Pipeline main started

{

        "message" => "::1 - - [16/Mar/2019:16:41:48 +0800] \"OPTIONS * HTTP/1.0\" 200 - \"-\" \"Apache/2.4.6 (CentOS) (internal dummy connection)\"",

       "@version" => "",

     "@timestamp" => "2019-03-16T10:26:41.882Z",

           "path" => "/var/log/httpd/access_log",

           "host" => "k8s6",

       "clientip" => "::1",

          "ident" => "-",

           "auth" => "-",

      "timestamp" => "16/Mar/2019:16:41:48 +0800",

           "verb" => "OPTIONS",

        "request" => "*",

    "httpversion" => "1.0",

       "response" => "",

       "referrer" => "\"-\"",

          "agent" => "\"Apache/2.4.6 (CentOS) (internal dummy connection)\""

}
3.1)写入es服务
[root@k8s6 ~]# cat /etc/logstash/conf.d/apache-grok.conf

input{

    file {

        path => "/var/log/httpd/access_log"

        start_position => "beginning"

    }

}

filter{

    grok {

        match => { "message" => "%{COMBINEDAPACHELOG}" }

    }

}

output{

    elasticsearch {

        hosts => ["192.168.10.22:9200"]

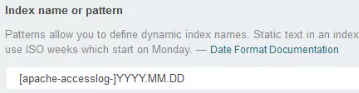
        index => "apache-accesslog-%{+YYYY.MM.dd}"

    }

}
kibana进行日志匹配
六、elk标准架构图,使用消息队列形式

1)elk架构修改
之前

数据 =》logstash =》es

修改

数据 =》logstash =》redis(消息队列) =》logstash =》es
支持的output插件
https://www.elastic.co/guide/en/logstash/current/output-plugins.html
2)安装启动redis
测试redis

yum install redis -y

修改redis配置文件

vim /etc/redis.conf

    daemonize no ==> daemonize yes 改为后台运行

    bind 192.168.10.23  修改ip地址

启动redis

[root@node01 ~]# systemctl start redis

[root@node01 ~]# netstat -lntup|grep redis

tcp               192.168.10.23:      0.0.0.0:*               LISTEN      /redis-server

[root@node01 ~]# redis-cli -h 192.168.10.23 -p

192.168.10.23:>
启动redis
3.1)测试 logstash与redis测试
[root@node01 ~]# cat /etc/logstash/conf.d/redis.conf

input{

    stdin {}

}

output{

    redis {

        host => "192.168.10.23"

        port => ""

        db => ""

        data_type => "list"

        key => "demo"

    }

}
logstash/conf.d/redis.conf
启动logstash服务
[root@node01 ~]# /opt/logstash/bin/logstash -f /etc/logstash/conf.d/redis.conf

Settings: Default pipeline workers:

Pipeline main started

hello

hello weodda

agaeawegaw
添加了3个值
3.2)在redis中查看
[root@node01 ~]# redis-cli -h 192.168.10.23 -p 6379
192.168.10.23:6379> info
db6:keys=1,expires=0,avg_ttl=0
192.168.10.23:6379> select 6
OK
192.168.10.23:6379[6]> keys *
1) "demo"
192.168.10.23:6379[6]> type demo
list
192.168.10.23:6379[6]> llen demo
(integer) 3
192.168.10.23:6379[6]> lindex demo -1
"{\"message\":\"agaeawegaw\",\"@version\":\"1\",\"@timestamp\":\"2019-03-16T15:20:02.261Z\",\"host\":\"node01\"}"
4)将apache日志写入redis
[root@k8s6 conf.d]# cat /etc/logstash/conf.d/apache-grok-redis.conf

input{

        file {

                path => "/var/log/httpd/access_log"

                start_position => "beginning"

        }

}

filter{

        grok {

                match => { "message" => "%{COMBINEDAPACHELOG}" }

        }

}

output{

    redis {

        host => "192.168.10.23"

        port => ""

        db => ""

        data_type => "list"

        key => "apache-accesslog"

    }

}
apache-grok-redis.conf
过滤操作,可在后面读取redis时实现
启动服务
[root@k8s6 conf.d]# /opt/logstash/bin/logstash -f /etc/logstash/conf.d/apache-grok-redis.conf
可进入redis查看
5)从另一台机器启动logstash读取redis写入es服务
192.168..22机器使用 logstash 将日志存入redis

192.168..23机器使用logstash读取redis内写入的日志
查看inpu的插件
https://www.elastic.co/guide/en/logstash/current/input-plugins.html
5.1)屏幕调试输出
[root@node01 conf.d]# cat /etc/logstash/conf.d/indexer.conf

input{

    redis {

        host => "192.168.10.23"

        port => ""

        db => ""

        data_type => "list"

        key => "apache-accesslog"

    }

}

output{

    stdout {

        codec => rubydebug

    }

}
读取redis
/opt/logstash/bin/logstash -f /etc/logstash/conf.d/indexer.conf
5.2)整个过程梳理(最终版)
标准存入redis

[root@k8s6 conf.d]# cat /etc/logstash/conf.d/apache-grok-redis.conf

input{

        file {

                path => "/var/log/httpd/access_log"

                start_position => "beginning"

        }

}

output{

    redis {

        host => "192.168.10.23"

        port => ""

        db => ""

        data_type => "list"

        key => "apache-accesslog"

    }

}

标准读取redis,过滤之后再存入es服务

[root@node01 conf.d]# cat /etc/logstash/conf.d/indexer.conf

input{

    redis {

        host => "192.168.10.23"

        port => ""

        db => ""

        data_type => "list"

        key => "apache-accesslog"

    }

}

filter{

        grok {

                match => { "message" => "%{COMBINEDAPACHELOG}" }

        }

}

output{

    elasticsearch {

        hosts => ["192.168.10.22:9200"]

        index => "apache-accesslog-%{+YYYY.MM.dd}"

    }

}
存取日志
消息队列使用kafka
六、综合测试
1.1)logstash存入redis服务
[root@k8s6 conf.d]# cat /etc/logstash/conf.d/sumlog_put.conf

input{

        file {

                path => "/var/log/httpd/access_log"

                start_position => "beginning"

                type => "apache-accesslog"

        }

        file {

                path => ["/var/log/elasticsearch/myes.log"]

                type => "es-log"

                start_position => "beginning"

                    codec => multiline{

                    pattern => "^\["

                    negate => true

                    what => "previous"

            }

        }

}

output{

    if [type] == "apache-accesslog" {

        redis {

            host => "192.168.10.23"

            port => ""

            db => ""

            data_type => "list"

            key => "apache-accesslog"

        }

    }

    if [type] == "es-log" {

        redis {

            host => "192.168.10.23"

            port => ""

            db => ""

            data_type => "list"

            key => "es-log"

        }

    }

}
sumlog_put.conf
启动服务
[root@k8s6 ~]# /etc/init.d/logstash start
1.2)处理问题,发现redis没有存入日志
遇到的坑。权限问题

chown www:www /var/log/httpd/access_log        # yum安装的apache可能存在权限问题

修改logstash的启动权限

vim /etc/init.d/logstash

    LS_USER=root

    LS_GROUP=root
读取权限问题
警告:如果启动端口,请误使用root用户
1.3)读取redis,存入es
标准读取redis,过滤之后再存入es服务

[root@node01 conf.d]# cat /etc/logstash/conf.d/sumlog_get.conf

input{

    syslog {

        type => "system-syslog"

        port =>

    }

    redis {

        type => "apache-accesslog"

        host => "192.168.10.23"

        port => ""

        db => ""

        data_type => "list"

        key => "apache-accesslog"

    }

    redis {

        type => "es-log"

        host => "192.168.10.23"

        port => ""

        db => ""

        data_type => "list"

        key => "es-log"

    }

}

filter {

    if [type] == "apache-accesslog" {

        grok {

                match => { "message" => "%{COMBINEDAPACHELOG}" }

        }

    }

}

output{

    if [type] == "apache-accesslog" {

        elasticsearch {

            hosts => ["192.168.10.22:9200"]

            index => "apache-accesslog-%{+YYYY.MM.dd}"

        }

    }

    if [type] == "es-log" {

        elasticsearch {

            hosts => ["192.168.10.22:9200"]

            index => "es-log-%{+YYYY.MM}"

        }

    }

    if [type] == "system-syslog" {

        elasticsearch {

            hosts => ["192.168.10.22:9200"]

            index => "system-syslog-%{+YYYY.MM}"

        }

    }

}
sumlog_get.conf
也需要改为root用户,普通用户无法启动低端口
2)强调,防止程序挂了
如果使用redis list 作为消息队列,需要对key进行监控

llen key_name,如超过1万就报警。
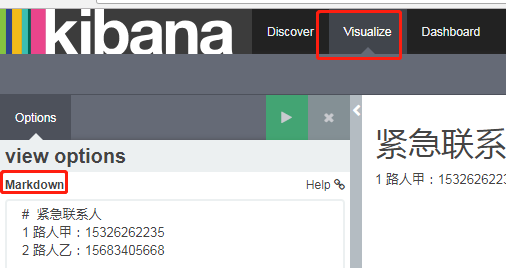
三、kibana的图形化()
1)markdown定义文本,如紧急联系人
ELK的高级篇(测试记录各种日志)的更多相关文章
- Go语言之高级篇beego框架之日志收集系统
一.日志收集系统架构设计 图1 图2 二.开发环境 1.安装jdk jdk-8u51-windows-x64.exe 安装目录:C:\Program Files\jdk8 2.安装zookeeper ...
- 4 - 基于ELK的ElasticSearch 7.8.x技术整理 - 高级篇( 续 ) - 更新完毕
0.前言 这里面一些理论和前面的知识点挂钩的,所以:建议看一下另外3篇知识内容 基础篇:https://www.cnblogs.com/xiegongzi/p/15684307.html java操作 ...
- 3 - 基于ELK的ElasticSearch 7.8.x技术整理 - 高级篇( 偏理论 )
4.ES高级篇 4.1.集群部署 集群的意思:就是将多个节点归为一体罢了( 这个整体就有一个指定的名字了 ) 4.1.1.window中部署集群 - 了解即可 把下载好的window版的ES中的dat ...
- SpringBootTest单元测试实战、SpringBoot测试进阶高级篇之MockMvc讲解
1.@SpringBootTest单元测试实战 简介:讲解SpringBoot的单元测试 1.引入相关依赖 <!--springboot程序测试依赖,如果是自动创建项目默认添加--> &l ...
- ELK菜鸟手记 (一) 环境配置+log4j日志记录
1. 背景介绍 在大数据时代,日志记录和管理变得尤为重要. 以往的文件记录日志的形式,既查询起来又不方便,又造成日志在服务器上分散存储,管理起来相当麻烦, 想根据一个关键字查询日志中某个关键信息相当困 ...
- 「MySQL高级篇」explain分析SQL,索引失效&&常见优化场景
大家好,我是melo,一名大三后台练习生 专栏回顾 索引的原理&&设计原则 欢迎关注本专栏:MySQL高级篇 本篇速览 在我们上一篇文章中,讲到了索引的原理&&设计原则 ...
- ORM查询语言(OQL)简介--高级篇(续):庐山真貌
相关文章内容索引: ORM查询语言(OQL)简介--概念篇 ORM查询语言(OQL)简介--实例篇 ORM查询语言(OQL)简介--高级篇:脱胎换骨 ORM查询语言(OQL)简介--高级篇(续):庐山 ...
- StackTrace堆栈跟踪记录详细日志
使用StackTrace堆栈跟踪记录详细日志(可获取行号) 2014-04-25 22:30 by 螺丝钉想要螺丝帽, 350 阅读, 3 评论, 收藏, 编辑 上一篇我们提到使用.NET自带的Tra ...
- SQL注入攻击三部曲之高级篇
SQL注入攻击三部曲之高级篇 经过了入门篇和进阶篇的学习,相信诸位想要破解一般的网站是没有什么问题了,但是先别得意.正所谓学海无涯,技术的进步也是没有止境的.SQL注入是一个看起来简单,但是变数很多的 ...
随机推荐
- Java学习前的一些准备
1.JDK - (Java SE Development Kit) JDK是Java开发所需要的环境,就跟我们想玩某个网游一样,玩之前一定是需要先安装相应的程序包的.那这个JDK就是我们准备登陆Jav ...
- JSFL元件类型判断 转载于 https://blog.csdn.net/linking530/article/details/8364600
//获取舞台上第一层第一帧上的全部元件 var els = fl.getDocumentDOM().getTimeline().layers[0].frames[0].elements; //遍历元件 ...
- 对BRD、MRD、PRD、FSD四类产品文档的理解
查阅相关文献并总结了在产品生命周期内比较重要的四类文档—BRD.MRD.PRD.FSD各自的含义以及用法. BRD 1.含义:BRD(business requirement document)— 商 ...
- ubuntu环境下安装docker遇到的坑
ubuntu安装docker的前提条件是: 1. Linux 的内核版本在 3.10 或以上: 2. linux 内核要开启 cgroup 和 namespace 功能 可以执行命令:uname –a ...
- tcp那个孤独的小包到底怎么回事?
内核3.10,接<tcp的发送端一个小包就能打破对端的delay_ack么?> 我们继续来分析这个没满mss的小包, 可以看到,由于受到syn ack这端是发包端,所以该发送链路协商的ms ...
- numpy统计分布显示
#导包 import numpy as np #导入鸢尾花数据 from sklearn.datasets import load_iris data = load_iris() pental_len ...
- .net session 使用误区
1. this.Session["username"] = null HttpSessionState 内部使用 NameObjectCollection 类型的集合对象来存储用 ...
- 解决mysql连接linux上mysql服务器的问题
在远程连接mysql的时候,连接不上,出现如下报错:Lost connection to MySQL server at 'waiting for initial communication pack ...
- Excel VBA ——如何导出数据到excel表格
sub OutPut() Dim FileTitle, MyPath, MyFullName As String Application.ScreenUpdating = false '关闭表格公式的 ...
- ASP.NET网站不能在VS中调试
点击VS2010工具栏中绿色的小箭头运行网站没问题,按说运行后,应该处于正在运行状态,这个小箭头会变成灰色.但是没有变化,仍然是绿色的小箭头.所以设置断点根本没有截获.任务栏右下角显示的Develop ...