Highcharts 标示区曲线图;Highcharts 对数图表;Highcharts 时间间隔图表
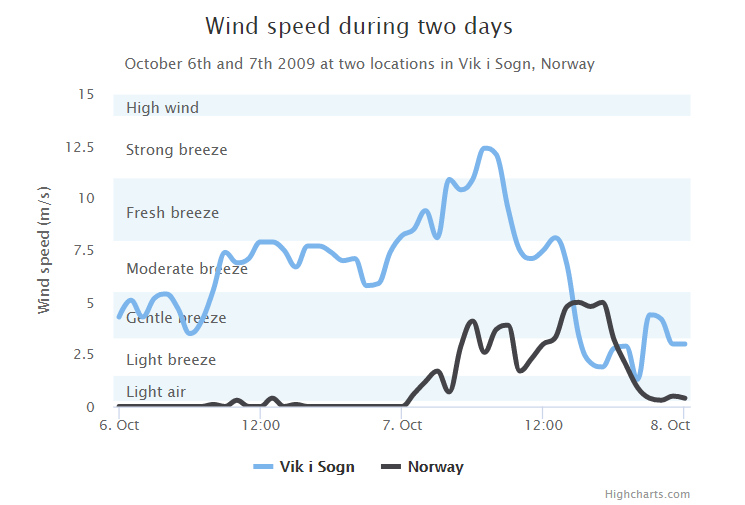
Highcharts 标示区曲线图
配置
使用 yAxis.plotBands 属性来配置标示区。区间范围使用 'from' 和 'to' 属性。颜色设置使用 'color' 属性。标签样式使用 'label' 属性。
配置信息:
var yAxis = {

   title: {

      text: 'Wind speed (m/s)'

   },

   min: 0,

   minorGridLineWidth: 0,

   gridLineWidth: 0,

   alternateGridColor: null,

   plotBands: [{ // Light air

      from: 0.3,

      to: 1.5,

      color: 'rgba(68, 170, 213, 0.1)',

      label: {

         text: 'Light air',

         style: {

            color: '#606060'

         }

      }

   }, { // Light breeze

      from: 1.5,

      to: 3.3,

      color: 'rgba(0, 0, 0, 0)',

      label: {

         text: 'Light breeze',

         style: {

            color: '#606060'

         }

      }

   }, { // Gentle breeze

      from: 3.3,

      to: 5.5,

      color: 'rgba(68, 170, 213, 0.1)',

      label: {

         text: 'Gentle breeze',

         style: {

            color: '#606060'

         }

      }

   }, { // Moderate breeze

      from: 5.5,

      to: 8,

      color: 'rgba(0, 0, 0, 0)',

      label: {

         text: 'Moderate breeze',

         style: {

            color: '#606060'

         }

      }

   }, { // Fresh breeze

      from: 8,

      to: 11,

      color: 'rgba(68, 170, 213, 0.1)',

      label: {

         text: 'Fresh breeze',

         style: {

            color: '#606060'

         }

      }

   }, { // Strong breeze

      from: 11,

      to: 14,

      color: 'rgba(0, 0, 0, 0)',

      label: {

         text: 'Strong breeze',

         style: {

            color: '#606060'

         }

      }

   }, { // High wind

      from: 14,

      to: 15,

      color: 'rgba(68, 170, 213, 0.1)',

      label: {

         text: 'High wind',

         style: {

            color: '#606060'

         }

      }

   }]

};
实例
文件名:highcharts_spline_bands.htm
<html>

<head>

<meta charset="UTF-8" />

<title>Highcharts 教程 | 菜鸟教程(runoob.com)</title>

<script src="http://apps.bdimg.com/libs/jquery/2.1.4/jquery.min.js"></script>

<script src="http://code.highcharts.com/highcharts.js"></script>

</head>

<body>

<div id="container" style="width: 550px; height: 400px; margin: 0 auto"></div>

<script language="JavaScript">

$(document).ready(function() {

   var chart = {

      type: 'spline'

   };

   var title = {

      text: 'Wind speed during two days'

   };

   var subtitle = {

      text: 'October 6th and 7th 2009 at two locations in Vik i Sogn, Norway'

   };

   var xAxis = {

      type: 'datetime',

      labels: {

         overflow: 'justify'

      }

   };

   var yAxis = {

      title: {

         text: 'Wind speed (m/s)'

      },

      min: 0,

      minorGridLineWidth: 0,

      gridLineWidth: 0,

      alternateGridColor: null,

      plotBands: [{ // Light air

         from: 0.3,

         to: 1.5,

         color: 'rgba(68, 170, 213, 0.1)',

         label: {

            text: 'Light air',

            style: {

               color: '#606060'

            }

         }

      }, { // Light breeze

         from: 1.5,

         to: 3.3,

         color: 'rgba(0, 0, 0, 0)',

         label: {

            text: 'Light breeze',

            style: {

               color: '#606060'

            }

         }

      }, { // Gentle breeze

         from: 3.3,

         to: 5.5,

         color: 'rgba(68, 170, 213, 0.1)',

         label: {

            text: 'Gentle breeze',

            style: {

               color: '#606060'

            }

         }

      }, { // Moderate breeze

         from: 5.5,

         to: 8,

         color: 'rgba(0, 0, 0, 0)',

         label: {

            text: 'Moderate breeze',

            style: {

               color: '#606060'

            }

         }

      }, { // Fresh breeze

         from: 8,

         to: 11,

         color: 'rgba(68, 170, 213, 0.1)',

         label: {

            text: 'Fresh breeze',

            style: {

               color: '#606060'

            }

         }

      }, { // Strong breeze

         from: 11,

         to: 14,

         color: 'rgba(0, 0, 0, 0)',

         label: {

            text: 'Strong breeze',

            style: {

               color: '#606060'

            }

         }

      }, { // High wind

         from: 14,

         to: 15,

         color: 'rgba(68, 170, 213, 0.1)',

         label: {

            text: 'High wind',

            style: {

               color: '#606060'

            }

         }

      }]

   };

   var tooltip = {

      valueSuffix: ' m/s'

   };

   var plotOptions = {

      spline: {

         lineWidth: 4,

         states: {

            hover:{

               lineWidth:5}},

         marker:{

            enabled:false},

         pointInterval:3600000,// one hour

         pointStart:Date.UTC(2009,9,6,0,0,0)}};var series=[{

         name:'Vik i Sogn',

         data:[4.3,5.1,4.3,5.2,5.4,4.7,3.5,4.1,5.6,7.4,6.9,7.1,7.9,7.9,7.5,6.7,7.7,7.7,7.4,7.0,7.1,5.8,5.9,7.4,8.2,8.5,9.4,8.1,10.9,10.4,10.9,12.4,12.1,9.5,7.5,7.1,7.5,8.1,6.8,3.4,2.1,1.9,2.8,2.9,1.3,4.4,4.2,3.0,3.0]},{

         name:'Norway',

         data:[0.0,0.0,0.0,0.0,0.0,0.0,0.0,0.0,0.1,0.0,0.3,0.0,0.0,0.4,0.0,0.1,0.0,0.0,0.0,0.0,0.0,0.0,0.0,0.0,0.0,0.6,1.2,1.7,0.7,2.9,4.1,2.6,3.7,3.9,1.7,2.3,3.0,3.3,4.8,5.0,4.8,5.0,3.2,2.0,0.9,0.4,0.3,0.5,0.4]}];var navigation ={

      menuItemStyle:{

         fontSize:'10px'}}var json ={};

   json.chart = chart;

   json.title = title;

   json.subtitle = subtitle;

   json.tooltip = tooltip;

   json.xAxis = xAxis;

   json.yAxis = yAxis;

   json.series = series;

   json.plotOptions = plotOptions;

   json.navigation = navigation;

   $('#container').highcharts(json);});</script></body></html>
以上实例输出结果为:
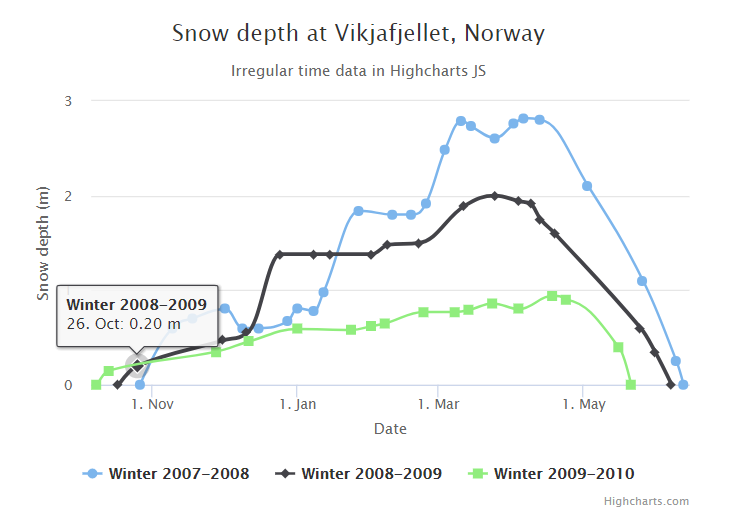
Highcharts 时间间隔图表
实例
文件名:highcharts_spline_time.htm
<html>

<head>

<meta charset="UTF-8" />

<title>Highcharts 教程 | 菜鸟教程(runoob.com)</title>

<script src="http://apps.bdimg.com/libs/jquery/2.1.4/jquery.min.js"></script>

<script src="http://code.highcharts.com/highcharts.js"></script>

</head>

<body>

<div id="container" style="width: 550px; height: 400px; margin: 0 auto"></div>

<script language="JavaScript">

$(document).ready(function() {

   var chart = {

      type: 'spline'

   };

   var title = {

      text: 'Snow depth at Vikjafjellet, Norway'

   };

   var subtitle = {

      text: 'Irregular time data in Highcharts JS'

   };

   var xAxis = {

      type: 'datetime',

      dateTimeLabelFormats: { // don't display the dummy year

         month: '%e. %b',

         year: '%b'

      },

      title: {

         text: 'Date'

      }

   };

   var yAxis = {

      title: {

         text: 'Snow depth (m)'

      },

      min: 0

   };

   var tooltip = {

      headerFormat: '<b>{series.name}</b><br>',

      pointFormat: '{point.x:%e. %b}: {point.y:.2f} m'

   };

   var plotOptions = {

      spline: {

         marker: {

            enabled: true

         }

      }

   };

   var series= [{

         name: 'Winter 2007-2008',

            // Define the data points. All series have a dummy year

            // of 1970/71 in order to be compared on the same x axis. Note

            // that in JavaScript, months start at 0 for January, 1 for February etc.

         data: [

             [Date.UTC(1970,  9, 27), 0   ],

             [Date.UTC(1970, 10, 10), 0.6 ],

             [Date.UTC(1970, 10, 18), 0.7 ],

             [Date.UTC(1970, 11,  2), 0.8 ],

             [Date.UTC(1970, 11,  9), 0.6 ],

             [Date.UTC(1970, 11, 16), 0.6 ],

             [Date.UTC(1970, 11, 28), 0.67],

             [Date.UTC(1971,  0,  1), 0.81],

             [Date.UTC(1971,  0,  8), 0.78],

             [Date.UTC(1971,  0, 12), 0.98],

             [Date.UTC(1971,  0, 27), 1.84],

             [Date.UTC(1971,  1, 10), 1.80],

             [Date.UTC(1971,  1, 18), 1.80],

             [Date.UTC(1971,  1, 24), 1.92],

             [Date.UTC(1971,  2,  4), 2.49],

             [Date.UTC(1971,2,11),2.79],[Date.UTC(1971,2,15),2.73],[Date.UTC(1971,2,25),2.61],[Date.UTC(1971,3,2),2.76],[Date.UTC(1971,3,6),2.82],[Date.UTC(1971,3,13),2.8],[Date.UTC(1971,4,3),2.1],[Date.UTC(1971,4,26),1.1],[Date.UTC(1971,5,9),0.25],[Date.UTC(1971,5,12),0]]},{

         name:'Winter 2008-2009',

         data:[[Date.UTC(1970,9,18),0],[Date.UTC(1970,9,26),0.2],[Date.UTC(1970,11,1),0.47],[Date.UTC(1970,11,11),0.55],[Date.UTC(1970,11,25),1.38],[Date.UTC(1971,0,8),1.38],[Date.UTC(1971,0,15),1.38],[Date.UTC(1971,1,1),1.38],[Date.UTC(1971,1,8),1.48],[Date.UTC(1971,1,21),1.5],[Date.UTC(1971,2,12),1.89],[Date.UTC(1971,2,25),2.0],[Date.UTC(1971,3,4),1.94],[Date.UTC(1971,3,9),1.91],[Date.UTC(1971,3,13),1.75],[Date.UTC(1971,3,19),1.6],[Date.UTC(1971,4,25),0.6],[Date.UTC(1971,4,31),0.35],[Date.UTC(1971,5,7),0]]},{

         name:'Winter 2009-2010',

         data:[[Date.UTC(1970,9,9),0],[Date.UTC(1970,9,14),0.15],[Date.UTC(1970,10,28),0.35],[Date.UTC(1970,11,12),0.46],[Date.UTC(1971,0,1),0.59],[Date.UTC(1971,0,24),0.58],[Date.UTC(1971,1,1),0.62],[Date.UTC(1971,1,7),0.65],[Date.UTC(1971,1,23),0.77],[Date.UTC(1971,2,8),0.77],[Date.UTC(1971,2,14),0.79],[Date.UTC(1971,2,24),0.86],[Date.UTC(1971,3,4),0.8],[Date.UTC(1971,3,18),0.94],[Date.UTC(1971,3,24),0.9],[Date.UTC(1971,4,16),0.39],[Date.UTC(1971,4,21),0]]}];var json ={};

   json.chart = chart;

   json.title = title;

   json.subtitle = subtitle;

   json.tooltip = tooltip;

   json.xAxis = xAxis;

   json.yAxis = yAxis;

   json.series = series;

   json.plotOptions = plotOptions;

   $('#container').highcharts(json);});</script></body></html>
以上实例输出结果为:
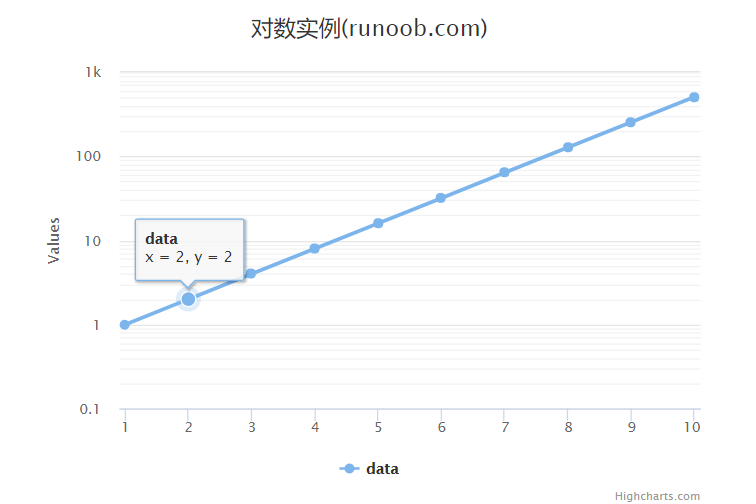
Highcharts 对数图表
配置
配置 yAxis.type 为 'logarithmic'。它定义了 x 轴类型。可选值有 "linear", "logarithmic", "datetime" 或 "category"。默认值为linear。
yAxis

var yAxis = {

   type: 'logarithmic',

   minorTickInterval: 0.1

};
实例
文件名:highcharts_line_logarithmic.htm
<html>

<head>

<meta charset="UTF-8" />

<title>Highcharts 教程 | 菜鸟教程(runoob.com)</title>

<script src="http://apps.bdimg.com/libs/jquery/2.1.4/jquery.min.js"></script>

<script src="http://code.highcharts.com/highcharts.js"></script>

</head>

<body>

<div id="container" style="width: 550px; height: 400px; margin: 0 auto"></div>

<script language="JavaScript">

$(document).ready(function() {

   var title = {

      text: '对数实例(runoob.com)'

   };

   var xAxis = {

      tickInterval: 1

   };

   var yAxis = {

      type: 'logarithmic',

      minorTickInterval: 0.1

   };

   var tooltip = {

      headerFormat: '<b>{series.name}</b><br>',

      pointFormat: 'x = {point.x}, y = {point.y}'

   };

   var plotOptions = {

      spline: {

         marker: {

            enabled: true

         }

      }

   };

   var series= [{

         name: 'data',

         data: [1, 2, 4, 8, 16, 32, 64, 128, 256, 512],

         pointStart: 1

      }

   ];

   var json = {};

   json.title = title;

   json.tooltip = tooltip;

   json.xAxis = xAxis;

   json.yAxis = yAxis;

   json.series = series;

   json.plotOptions = plotOptions;

   $('#container').highcharts(json);

});

</script>

</body>

</html>
以上实例输出结果为:
Highcharts 标示区曲线图;Highcharts 对数图表;Highcharts 时间间隔图表的更多相关文章
- 网页图表Highcharts实践教程之外层图表区
网页图表Highcharts实践教程之外层图表区 Highcharts图表区 图表区是图表的基本区域.所有的数据和图形都是绘制在图表区中.从图形绘制范围来分,图表区域分为外层图表区和绘图区.本章将详细 ...
- 网页图表Highcharts实践教程之图表区
网页图表Highcharts实践教程之图表区 网页图表Highcharts图表区 图表区是图表的基本区域.所有的数据和图形都是绘制在图表区中.从图形绘制范围来分,图表区域分为外层图表区和绘图区.本章将 ...
- HighCharts画时间趋势图,标示区以及点击事件操作
最近在用HighCharts画趋势图,如果按照设计文档上来画那太复杂了,于是根据自己多年的经验改动了设计文档,添加了highcharts的标示区,然而我也发现,最后一次画highchart趋势图还是在 ...
- 网页图表Highcharts实践教程之图表代码构成
网页图表Highcharts实践教程之图表代码构成 Highcharts第一个实例 下面我们来实现本书的第一个Highcharts实例. [实例1-1]下面来制作北京连续一周最高温度折线图.操作过程如 ...
- 网页图表Highcharts实践教程之标签组与载入动画
网页图表Highcharts实践教程之标签组与载入动画 Highcharts标签组 在图表的大部分元素都提供了标签功能.但很多时候,我们需要额外说明一些信息.这个时候借助原有的图表元素的标签功能就不是 ...
- 网页图表Highcharts实践教程标之添加题副标题版权信息
网页图表Highcharts实践教程标之添加题副标题版权信息 Highcharts辅助元素 辅助元素图表的非必要元素,如标题.版权信息.标签.载入动态.它们不和图表数据发生关联,只是额外说明一些基本信 ...
- 网页图表Highcharts实践教程标之加入题副标题版权信息
网页图表Highcharts实践教程标之加入题副标题版权信息 Highcharts辅助元素 辅助元素图表的非必要元素.如标题.版权信息.标签.加载动态.它们不和图表数据发生关联,仅仅是额外说明一些基 ...
- 网页图表Highcharts实践教程之标签组与加载动画
网页图表Highcharts实践教程之标签组与加载动画 Highcharts标签组 在图表的大部分元素都提供了标签功能.但非常多时候,我们须要额外说明一些信息.这个时候借助原有的图表元素的标签功能就 ...
- Highcharts使用教程(1):制作简单图表
今天我们要使用JavaScript图表Highcharts制作简单的柱形图,我们已经安装好Highcharts,让我们开始制作图表吧. 步骤一 在网页中添加一个div.设置id,设置图表长.高.代码如 ...
随机推荐
- Netty资料
netty 资料 转自 http://calvin1978.blogcn.com/articles/netty-info.html Netty资料皆阵列在前 Posted on 2016-08- ...
- pycharm 小知识
pycharm使用过程小知识: 1.pycharm定义项目或脚本抬头模版:setting ——Editor——File and Code Templates,右侧选择Python Script: 2. ...
- [转]eclipse 配置黑色主题 Luna 方式三
虽然以前也使用eclipse的黑色主题,但是配置起来稍微麻烦一点. 这里先声明,下面的方式适合最新版本的Eclipse Luna,旧的版本可以下载我提供的这个插件,并将其放在eclipse目录下的 ...
- 摄像头PIN脚功能作用
摄像头PIN脚功能作用,Camera硬件系统分析 9 f E+ E2 b N. j4 M2 U- a. q9 A) T# c& O& C% x+ l5 l! q ...
- Redis学习笔记之Redis中5种数据结构的使用场景介绍
原来看过 redisbook 这本书,对 redis 的基本功能都已经熟悉了,从上周开始看 redis 的源码.目前目标是吃透 redis 的数据结构.我们都知道,在 redis 中一共有5种数据结构 ...
- C++中string的成员函数
string类的构造函数: string(const char *s); //用c字符串s初始化 string(int n,char c); //用n个字符c初始化 此外,string类还支持默认构造 ...
- 20145321 《Java程序设计》课程总结
20145321 <Java程序设计>课程总结 读书笔记链接汇总 第一周读书笔记 第二周读书笔记 第三周读书笔记 第四周读书笔记 第五周读书笔记 第六周读书笔记 第七周读书笔记 第八周读书 ...
- git revert
1. 我认为这是正确的做法: git fetch --all git reset --hard origin/master git fetch下载远程最新的,但不尝试,或重订任何东西. 然后,git ...
- c# 过滤HTML代码 源代码,案例 下载
#region 过滤HTML代码 //替换掉html字符,只显示文字信息. public string replaceHtmlCode(string Htmlstring) { Htmlstring ...
- 【链接】Eclipse的Debug调试技巧
Eclipse的Debug调试技巧大全 https://mp.weixin.qq.com/s/bORg9YxJiby2WenYRrXY-w 使用Eclipse调试Java程序的10个技巧 https: ...