
Spring Cloud 分布式链路跟踪 Sleuth + Zipkin + Elasticsearch【Finchley 版】
随着业务越来越复杂,系统也随之进行各种拆分,特别是随着微服务架构的兴起,看似一个简单的应用,后台可能很多服务在支撑;一个请求可能需要多个服务的调用;当请求迟缓或不可用时,无法得知是哪个微服务引起的,这时就需要解决如何快速定位服务故障点,Zipkin 分布式跟踪系统就能很好的解决这样的问题。
那么到底怎么使用呢?接下来完成一个具体的实例来体会一把微服务链路追踪:
本文使用的 Spring Cloud Finchley 版本,和其他版本会有不同
我们使用user-service,order-service 作为两个微服务,zuul-gateway 作为服务网关
zuul-gateway -> order-service -> user-service, 形成服务调用链路,完成一次请求。
注意:Zipkin 不再推荐我们来自定义 Server 端,在最新版本的 Spring Cloud 依赖管理里已经找不到 Zipkin-server 了 ,根本就不需要自己新建一个 Zipkin-server 服务,网上的各种教程都数互相抄的,请无视
##一,环境安装
- 本人使用 centos 7 ,java-10
- 安装 Zipkin:聚合各个业务系统之间的调用延迟数据
- 安装 RabbitMQ:系统调用数据传输
- 安装 Elasticsearch:系统调用数据持久化
- 安装Elasticsearch-head:Elasticsearch 可视化
二,创建微服务
- user-service
- 以下是pom依赖文件
    <dependency>

            <groupId>org.springframework.boot</groupId>

            <artifactId>spring-boot-starter-web</artifactId>

        </dependency>

        <dependency>

            <groupId>org.springframework.cloud</groupId>

            <artifactId>spring-cloud-starter-netflix-eureka-client</artifactId>

        </dependency>

        <dependency>

            <groupId>org.springframework.boot</groupId>

            <artifactId>spring-boot-starter-actuator</artifactId>

        </dependency>

     	<dependency>

            <groupId>org.springframework.cloud</groupId>

            <artifactId>spring-cloud-starter-openfeign</artifactId>

        </dependency>

      <!--服务链路追踪-->

        <dependency>

            <groupId>org.springframework.cloud</groupId>

            <artifactId>spring-cloud-starter-sleuth</artifactId>

        </dependency>

        <dependency>

            <groupId>org.springframework.cloud</groupId>

            <artifactId>spring-cloud-starter-zipkin</artifactId>

        </dependency>

        <!--数据传输-->

        <dependency>

            <groupId>org.springframework.cloud</groupId>

            <artifactId>spring-cloud-stream-binder-rabbit</artifactId>

        </dependency>
- 新建@RestController 接口 UserOrderController,代码如下:
          @RestController

          public class UserOrderController {

              @Autowired

              private UserOrderService orderService;

              @RequestMapping(value = "/getUserOrder", method = RequestMethod.GET)

              public String getUserOrder() {

                  return orderService.getOrder();

              }

          }
说明:在 user-service 使用 FeignClient 调用 order-service 的 getOrder 服务
- application.yml 配置文件如下:
          spring:

            application:

              name: user-service

            sleuth:

              web:

                client:

                  enabled: true

              sampler:

                probability: 1.0

            zipkin:

              base-url: http://192.168.10.100:9411/

              enabled: true

              sender:

                type: RABBIT

            rabbitmq:

              addresses: 192.168.10.100

              port: 15672

              username: admin

              password: 12345

              virtual-host: sleuth

          server:

            port: 9100
  zipkin 参数说明:

  	probability: 1.0 		#将采样比例设置为 1.0,也就是全部都需要。默认是 0.1

  	base-url:  http://192.168.10.100:9411/		 #Zipkin 服务器的地址
- order-service
- pom依赖文件和user-service相同
- 新建@RestController 接口 OrderController,代码如下:
          @RestController

          public class OrderController {

              @Value("${server.port}")

              private String port;

              @RequestMapping(value = "/getOrder", method = RequestMethod.GET)

              public String getOrder() {

                  return "Success, Order-Service, Port :" + port;

              }

          }
说明:getOrder接口就是给 user-service 调用的
application.yml 配置文件和user-service相同
zuul-gateway网关
- 以下是pom依赖文件
          <dependency>

                      <groupId>org.springframework.cloud</groupId>

                      <artifactId>spring-cloud-starter-netflix-zuul</artifactId>

                  </dependency>

                  <dependency>

                      <groupId>org.springframework.cloud</groupId>

                      <artifactId>spring-cloud-starter-netflix-eureka-client</artifactId>

                  </dependency>

                  <!--服务链路追踪-->

                  <dependency>

                      <groupId>org.springframework.cloud</groupId>

                      <artifactId>spring-cloud-starter-sleuth</artifactId>

                  </dependency>

                  <dependency>

                      <groupId>org.springframework.cloud</groupId>

                      <artifactId>spring-cloud-starter-zipkin</artifactId>

                  </dependency>

                  <!--数据传输-->

                  <dependency>

                      <groupId>org.springframework.cloud</groupId>

                      <artifactId>spring-cloud-stream-binder-rabbit</artifactId>

                  </dependency>

      ```

   2. application.yml 配置文件如下:

```yml

          spring:

            application:

              name: zuul-gateway

            sleuth:

              web:

                client:

                  enabled: true

              sampler:

                probability: 1.0

            zipkin:

              base-url: http://192.168.10.100:9411/

              enabled: true

              sender:

                type: RABBIT

            rabbitmq:

              addresses: 192.168.10.100

              port: 15672

              username: admin

              password: 12345

              virtual-host: sleuth

          server:

            port: 9310

          eureka:

            client:

              service-url:

                defaultZone: http://localhost:8080/eureka/

          zuul:

            prefix: /v1

            routes:

              # http://localhost:9310/v1/user/

              # user Api

              user-api:

                path: /user/**

                serviceId: user-service

              # order Api

              order-api:

                path: /order/**

                serviceId: order-service
  `zipkin`配置和user-service相同

  `zuul` 路由配置自己找资料参考啊,这里不做说明
以上我们微服务全部完成,然后全部启动
三,启动各系统和组件
前面说不推荐用户自己创建 Zipkin服务,那怎么把数据传输到 Zipkin服务器呢?就是利用Zipkin的环境变量,通过环境变量让 Zipkin 从 RabbitMQ 中读取信息
1,启动Zipkin服务,并指定 RabbitMQ做数据传输,Elasticsearch持久化数据,启动命令如下:
java -jar zipkin.jar --RABBIT_URI=amqp://admin:12345@localhost:5672/sleuth --STORAGE_TYPE=elasticsearch --ES_HOSTS=http//:localhost:9200 --ES_HTTP_LOGGING=BASIC
说明:
--RABBIT_URI=amqp://admin:12345@localhost:5672/sleuth 指定用 RabbitMQ 做数据传输
--STORAGE_TYPE=elasticsearch --ES_HOSTS=http//:localhost:9200 --ES_HTTP_LOGGING=BASIC 指定用 Eelasticsearch 做数据传输
可配置的环境变量,请参考:https://www.rabbitmq.com/uri-spec.html
当然你觉得 搭建Elasticsearch太麻烦了,也可以用MYSQL 生成环境推荐使用 Elasticsearch,或者你只想自己试一下,那你可以不用存储,数据就在内存中。
2,启动RabbitMQ服务 http://192.168.10.100:15672/ 查看启动生个,推荐自己新建个用户,然后登录 查看。
3,启动Elasticsearch服务,http://192.168.10.100:9200/ 查看ES启动,注意Elasticsearch 不能用root用户启动,具体怎么操作请百度教程。
4,启动Elasticsearch-head,http://192.168.10.100:9100/ 可以看到界面,注意 集群健康值,要是未连接就是有问题,自己解决。
5,启动user-service,order-service,zuul-gateway 网关,请求你自己定义的接口,这个有错自己解决
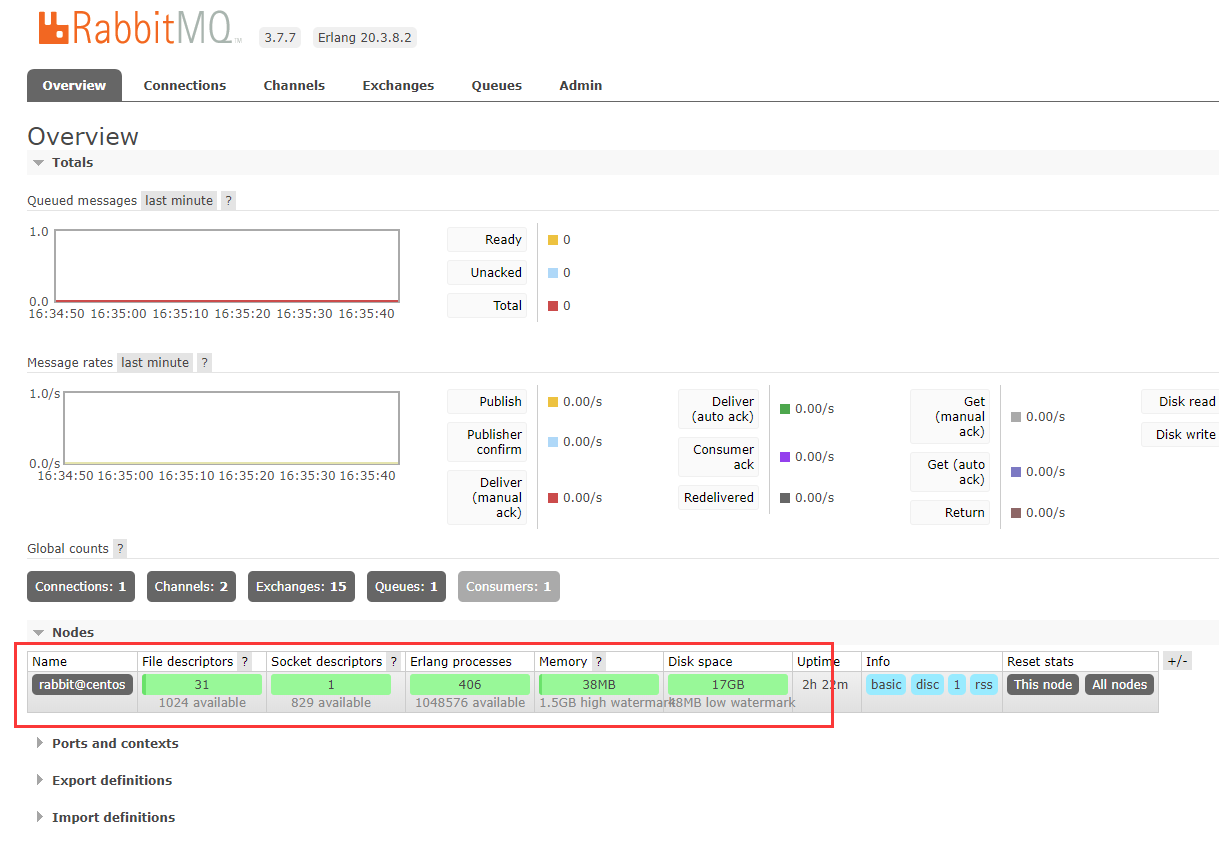
查看RabbitMQ可视化界面,就能看到 数据传输信息。如下图:
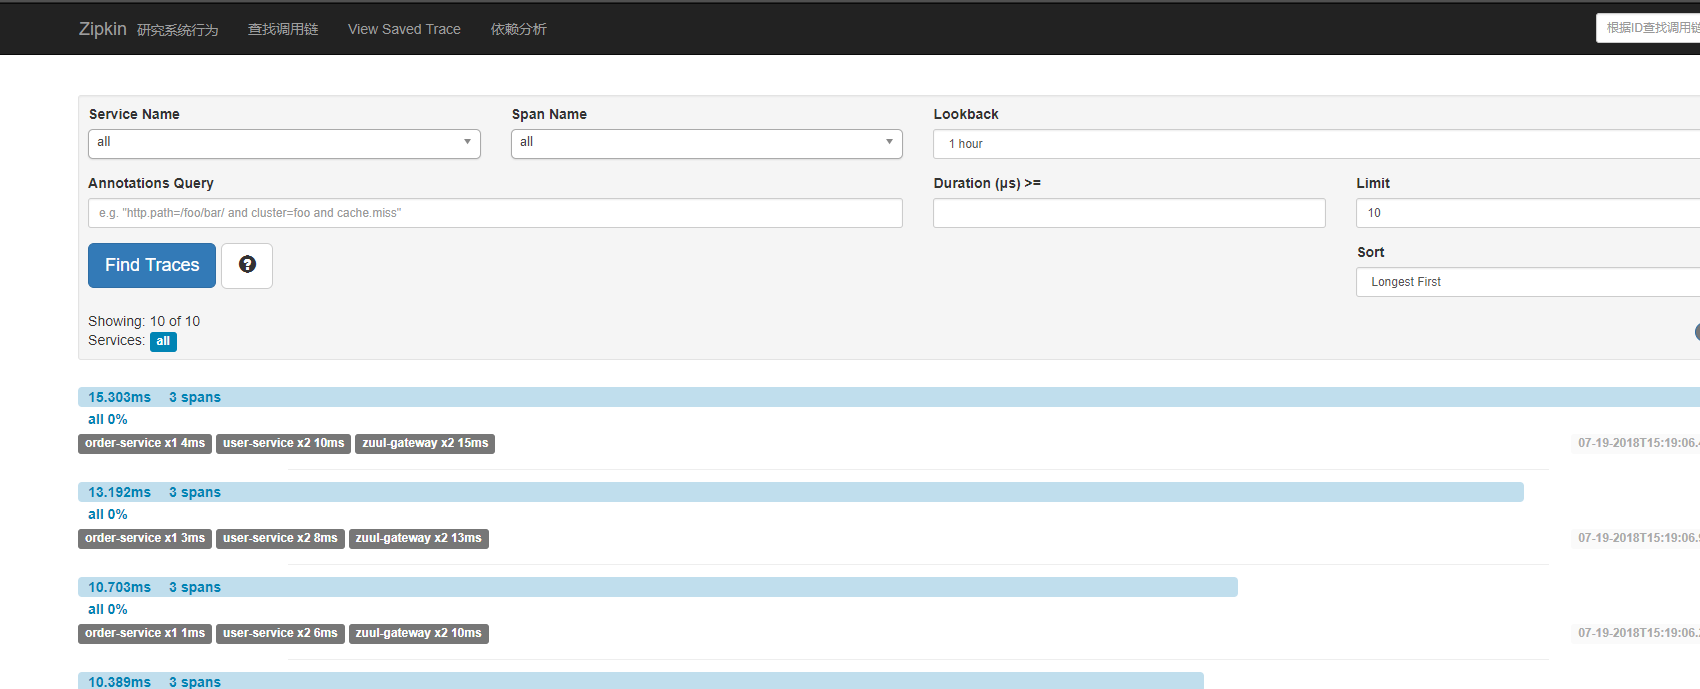
查看Zipkin可视化界面,就能看到服务调用链路信息。如下图:
查看Elasticsearch-head可视化界面,就能看到 Elasticsearch 存储的数据信息。如下图:

以上一个完成的分布式服务链路追踪系统完成。
###详细代码: [https://github.com/jarvisqi/spring-cloud-microservice](https://github.com/jarvisqi/spring-cloud-microservice)
参考:
- https://github.com/openzipkin/zipkin
- http://www.rabbitmq.com/documentation.html
- https://www.elastic.co/products/elasticsearch
- https://windmt.com/2018/04/24/spring-cloud-12-sleuth-zipkin/
Spring Cloud 分布式链路跟踪 Sleuth + Zipkin + Elasticsearch【Finchley 版】的更多相关文章
- Spring Cloud(十二):分布式链路跟踪 Sleuth 与 Zipkin【Finchley 版】
Spring Cloud(十二):分布式链路跟踪 Sleuth 与 Zipkin[Finchley 版] 发表于 2018-04-24 | 随着业务发展,系统拆分导致系统调用链路愈发复杂一个前端请 ...
- spring cloud 2.x版本 Sleuth+Zipkin分布式链路追踪
前言 本文采用Spring cloud本文为2.1.8RELEASE,version=Greenwich.SR3 本文基于前两篇文章eureka-server.eureka-client.eureka ...
- Spring Cloud 微服务分布式链路跟踪 Sleuth 与 Zipkin
Zipkin 是一个开放源代码分布式的跟踪系统,由 Twitter 公司开源,它致力于收集服务的定时数据,以解决微服务架构中的延迟问题,包括数据的收集.存储.查找和展现.它的理论模型来自于Google ...
- 分布式链路跟踪 Sleuth 与 Zipkin【Finchley 版】
原创: dqqzj SpringForAll社区 今天 Spring Cloud Sleuth Span是基本的工作单位. 例如,发送 RPC是一个新的跨度,就像向RPC发送响应一样. 跨度由跨度唯一 ...
- 【Dalston】【第七章】分布式链路跟踪(Sleuth)
当我们进行微服务架构开发时,通常会根据业务来划分微服务,各业务之间通过REST进行调用.一个用户操作,可能需要很多微服务的协同才能完成,如果在业务调用链路上任何一个微服务出现问题或者网络超时,都会导致 ...
- spring-cloud-sleuth 和 分布式链路跟踪系统
==================spring-cloud-sleuth==================spring-cloud-sleuth 可以用来增强 log 的跟踪识别能力, 经常在微服 ...
- 跟我学SpringCloud | 第十一篇:使用Spring Cloud Sleuth和Zipkin进行分布式链路跟踪
SpringCloud系列教程 | 第十一篇:使用Spring Cloud Sleuth和Zipkin进行分布式链路跟踪 Springboot: 2.1.6.RELEASE SpringCloud: ...
- 分布式链路跟踪系统架构SkyWalking和zipkin和pinpoint
Net和Java基于zipkin的全链路追踪 https://www.cnblogs.com/zhangs1986/p/8966051.html 在各大厂分布式链路跟踪系统架构对比 中已经介绍了几大框 ...
- 使用zipKin构建NetCore分布式链路跟踪
本文主要讲解使用ZipKin构建NetCore分布式链路跟踪 场景 因为最近公司业务量增加,而项目也需要增大部署数量,K8S中Pod基本都扩容了一倍,新增了若干物理机,部分物理机网络通信存在问题,导致 ...
随机推荐
- celery 任务队列 + redis
Celery 是一个“自带电池”的的任务队列.它易于使用,所以你可以无视其所解决问题的复杂程度而轻松入门.它遵照最佳实践设计,所以你的产品可以扩展,或与其他语言集成,并且它自带了在生产环境中运行这样一 ...
- (后台)SQL Server 代理(已禁用代理 XP) 怎么解决(转)
百度知道搜索的答案: 在SQL Server Management Studio中连接到SQL Server实例后,会显示“SQL Server 代理”节点.如果当前该实例的Agent服务没有启动,“ ...
- C#调用原生C++ COM对象(在C++中实现C#的接口)
为了跨平台在.net core中使用COM,不能使用Windows下的COM注册机制,但是可以直接把IUnknown指针传给C#,转换为指针,再转换为C#的接口(interface). 做了这方面的研 ...
- javascript:正则表达式、一个表单验证的例子
本文内容: 正则表达式 正则表达式的使用方法 正则表达式的特殊匹配字符 正则表达式修饰符 利用正则表达式进行表单验证的例子 首发日期:2018-05-13 正则表达式: 正则表达式的使用方法: 首先创 ...
- Python笔记(十六):迭代器
(一)iterable对象和Iterator对象的区别 iterable对象(可迭代的对象):可以使用for循环,例如:字符串.列表 .字典 .集合等 Iterator对象(迭代器):除了可以用for ...
- 如何在数据表当中找出被删掉的数据行ID
这个问题是一年前我刚步入IT行业的一个面试题,当时抓破头皮都想不到的问题,但现在回想过去自身不禁感到可笑,不多扯直接写解决方案.如何在数据表当中找出被删掉的数据行ID,意思是:在一堆的数据当中,让你找 ...
- SAP生产机该不该开放Debuger权限
前段时间公司定制系统在调用SAP RFC接口的时候报错了,看错误消息一时半会儿也不知道是哪里参数数据错误,就想着进到SAP系统里面对这个接口做远程Debuger,跟踪一下参数变量的变化,结果发现根本就 ...
- 基于cifar10实现卷积神经网络图像识别
import tensorflow as tf import numpy as np import math import time import cifar10 import cifar10_inp ...
- MySQL状态变量Aborted_connects与Aborted_clients浅析
关于MySQL的状态变量Aborted_clients & Aborted_connects分别代表的意义,以及哪些情况或因素会导致这些状态变量变化呢?下文通过实验测试来验证一下,首先我们来看 ...
- java----字符串的大写字母右移
import java.util.Scanner; /** * Created by Admin on 2017/3/27. */ public class test02 { public stati ...