spring-boot 速成(3) actuator
actuator 通过暴露一系列的endpoints可以让开发者快速了解spring boot的各项运行指标,比如:线程数,jvm剩余内存等一系列参数。
启用方法很简单,参考下面:
dependencies {

    compile('org.springframework.boot:spring-boot-starter-thymeleaf')

    compile('org.springframework.boot:spring-boot-devtools')

    compile('org.springframework.boot:spring-boot-starter-actuator')

    compile('org.springframework.boot:spring-boot-starter-test')

    compileOnly('org.projectlombok:lombok')

}
关键是添加spring-boot-starter-actuator依赖项即可,下表是actuator提供的endpoints列表(从官网文档上抄过来的)
| ID | Description | Sensitive Default |
|---|---|---|
|
|
Provides a hypermedia-based “discovery page” for the other endpoints.Requires Spring HATEOAS to be on the classpath. |
true |
|
|
Exposes audit events information for the current application. |
true |
|
|
Displays an auto-configuration report showing all auto-configuration candidates and the reason why they ‘were’ or ‘were not’ applied. |
true |
|
|
Displays a complete list of all the Spring beans in your application. |
true |
|
|
Displays a collated list of all |
true |
|
|
Performs a thread dump. |
true |
|
|
Exposes properties from Spring’s |
true |
|
|
Shows any Flyway database migrations that have been applied. |
true |
|
|
Shows application health information (when the application is secure, a simple ‘status’ when accessed over an unauthenticated connection or full message details when authenticated). |
false |
|
|
Displays arbitrary application info. |
false |
|
|
Shows and modifies the configuration of loggers in the application. |
true |
|
|
Shows any Liquibase database migrations that have been applied. |
true |
|
|
Shows ‘metrics’ information for the current application. |
true |
|
|
Displays a collated list of all |
true |
|
|
Allows the application to be gracefully shutdown (not enabled by default). |
true |
|
|
Displays trace information (by default the last 100 HTTP requests). |
true |
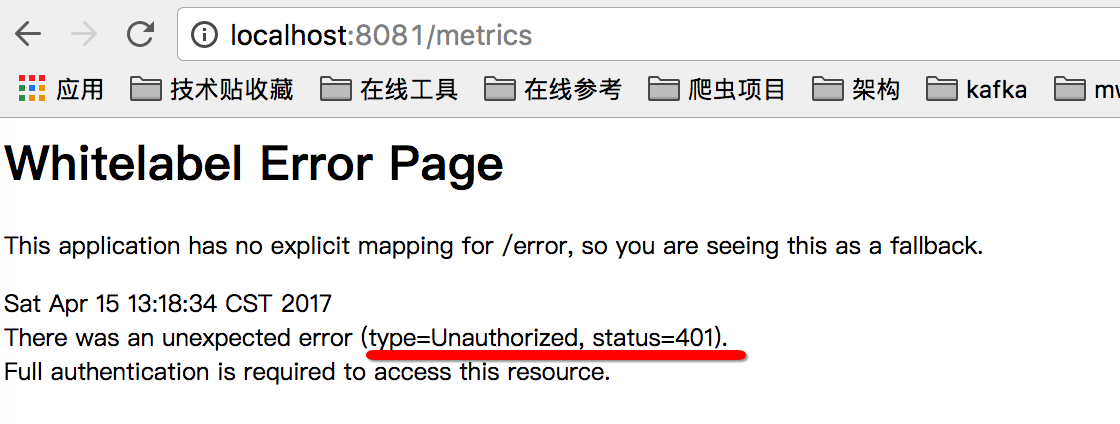
这张表中,有很多信息其实是敏感信息,并不适合匿名访问(特别是在公网环境下),所以默认情况下,如果想访问类似 http://localhost:8081/metrics 会看到以下错误:
比较好的做法是,将这些endpoints的端口,包括访问路径与常规应用的端口分开,application.yml可以参考下面的配置:
server:

  port: 8081

spring:

  main:

    banner-mode: "off"

  devtools:

    restart:

      trigger-file: .trigger

  thymeleaf:

    cache: false

management:

  security:

    enabled: false #关掉安全认证

  port: 1101 #管理端口调整成1101

  context-path: /admin #actuator的访问路径
如果在公网环境,建议在防火墙上做下限制,仅允许8081进来,1101用于内网访问即可,这样相对比较安全,也不用繁琐的输入密码。
访问下http://localhost:1101/admin/metrics 可以看到类似以下输出:
{

	mem: 466881,

	mem.free: 289887,

	processors: 4,

	instance.uptime: 10947,

	uptime: 18135,

	systemload.average: 3.12646484375,

	heap.committed: 411648,

	heap.init: 131072,

	heap.used: 121760,

	heap: 1864192,

	nonheap.committed: 56192,

	nonheap.init: 2496,

	nonheap.used: 55234,

	nonheap: 0,

	threads.peak: 27,

	threads.daemon: 19,

	threads.totalStarted: 32,

	threads: 22,

	classes: 6755,

	classes.loaded: 6755,

	classes.unloaded: 0,

	gc.ps_scavenge.count: 8,

	gc.ps_scavenge.time: 136,

	gc.ps_marksweep.count: 2,

	gc.ps_marksweep.time: 193,

	httpsessions.max: -1,

	httpsessions.active: 0

}
jvm的内存,cpu核数,线程数,gc情况一目了然。其它指标大概含义如下(网上抄来的)
系统信息:
包括处理器数量processors、运行时间uptime和instance.uptime、系统平均负载systemload.average。
mem.*:
内存概要信息,包括分配给应用的总内存数量以及当前空闲的内存数量。这些信息来自java.lang.Runtime。
heap.*:
堆内存使用情况。这些信息来自java.lang.management.MemoryMXBean接口中getHeapMemoryUsage方法获取的java.lang.management.MemoryUsage。
nonheap.*:
非堆内存使用情况。这些信息来自java.lang.management.MemoryMXBean接口中getNonHeapMemoryUsage方法获取的java.lang.management.MemoryUsage。
threads.*:
线程使用情况,包括线程数、守护线程数(daemon)、线程峰值(peak)等,这些数据均来自java.lang.management.ThreadMXBean。
classes.*:
应用加载和卸载的类统计。这些数据均来自java.lang.management.ClassLoadingMXBean。
gc.*:
垃圾收集器的详细信息,包括垃圾回收次数gc.ps_scavenge.count、垃圾回收消耗时间gc.ps_scavenge.time、标记-清除算法的次数gc.ps_marksweep.count、标记-清除算法的消耗时间gc.ps_marksweep.time。这些数据均来自java.lang.management.GarbageCollectorMXBean。
httpsessions.*:
Tomcat容器的会话使用情况。包括最大会话数httpsessions.max和活跃会话数httpsessions.active。该度量指标信息仅在引入了嵌入式Tomcat作为应用容器的时候才会提供。
gauge.*:
HTTP请求的性能指标之一,它主要用来反映一个绝对数值。比如上面示例中的gauge.response.hello: 5,它表示上一次hello请求的延迟时间为5毫秒。
counter.*:
HTTP请求的性能指标之一,它主要作为计数器来使用,记录了增加量和减少量。如上示例中counter.status.200.hello: 11,它代表了hello请求返回200状态的次数为11
结合其它一些工具把这些信息采集到grafana里,就有得到一系列很实用的监控图表数据,比如: 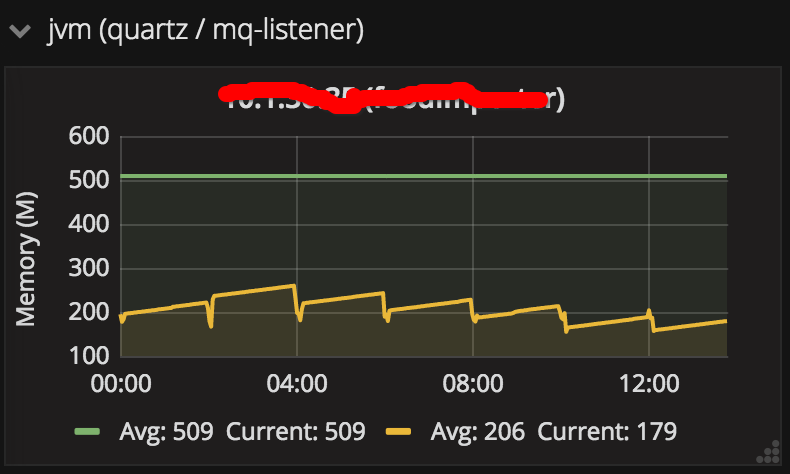
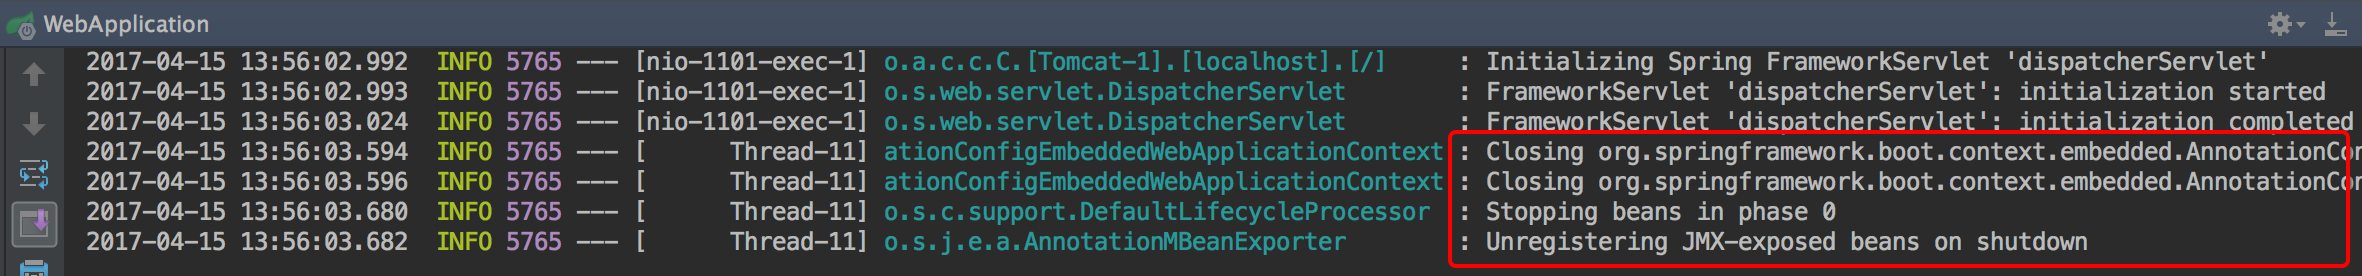
其它endpoint,就不一一展示了,大家有兴趣可以自行研究,最后要提一下的是shutdown这个endpoint,它可以实现优雅停机,这在线上部署时很有用,发布前先调用这个url,让应用优雅停掉,再部署新的代码,这样就不会导致正在处理的请求被中断,不过默认该功能是关闭的,可参考下面的设置启用:
endpoints:

  shutdown:

    enabled: true
而且出于安全考虑,该url只能以post方式访问,下图是用postman模拟post访问 http://locahost:1101/admin/shutdown的效果:

同时在日志里也能看到应用确实被关闭:
参考文章:
http://docs.spring.io/spring-boot/docs/current/reference/htmlsingle/#production-ready
spring-boot 速成(3) actuator的更多相关文章
- Spring Boot中使用Actuator的/info端点输出Git版本信息
对于Spring Boot的Actuator模块相信大家已经不陌生了,尤其对于其中的/health./metrics等强大端点已经不陌生(如您还不了解Actuator模块,建议先阅读<Sprin ...
- Spring Boot 之:Actuator 监控
在 Spring Boot 2.x 中为了安全,Actuator 只开放了两个端点 /actuator/health 和 /actuator/info.可以在配置文件中设置打开. Actuator 默 ...
- 如何在 Spring Boot 中禁用 Actuator 端点安全性?
默认情况下,所有敏感的 HTTP 端点都是安全的,只有具有 ACTUATOR 角色的用户才能访问它们.安全性是使用标准的 HttpServletRequest.isUserInRole 方法实施的. ...
- Spring Boot Actuator [监控与管理]
1. 如何添加 2. actuator 的原生端点(API) 2.1 应用类配置 2.1.1 http://localhost:8080/actuator/conditions 2.1.2 http: ...
- Spring Boot 2.x监控数据可视化(Actuator + Prometheus + Grafana手把手)
TIPS 本文基于Spring Boot 2.1.4,理论支持Spring Boot 2.x所有版本 众所周知,Spring Boot有个子项目Spring Boot Actuator,它为应用提供了 ...
- 聊聊Spring Boot Actuator
概述 在本文中,我们将介绍Spring Boot Actuator.我们将首先介绍基础知识,然后详细讨论Spring Boot 1.x和2.x中的可用内容. 我们将在Spring Boot 1.x中学 ...
- Spring boot 内存优化
转自:https://dzone.com/articles/spring-boot-memory-performance It has sometimes been suggested that Sp ...
- Spring Boot Memory Performance
The Performance Zone is brought to you in partnership with New Relic. Quickly learn how to use Docke ...
- spring boot面试问题集锦
译文作者:david 原文链接:https://www.javainuse.com/spring/SpringBootInterviewQuestions Q: 什么是spring boot? A: ...
- spring boot 项目搭建时,各个依赖的作用
项目搭建页面 https://start.spring.io/ 各个依赖的作用 List of dependencies for Spring Boot 2.1.5.RELEASE Core DevT ...
随机推荐
- svn使用笔记
一.checkout:第一次下载trunk里面的代码到本地 二.commit:提交一些修改* out of date : 本地版本号 < 服务器版本号* 如果过期,就update,可能会出现co ...
- 用原生js对表格排序
阿里的模拟笔试题,当时时间有限没写出来,其实是因为自己对原生dom操作不熟悉,这里补一下. 题目的大意是有一个表格,如代码所示 <table> <tr> <th>N ...
- 第11月第18天 RACSequence
1. RACSequence的内部存储结构就像一个单链表,有两个指针head和tail,head指针指向了当前链表的第一个元素,tail指向head指针下一个元素:根据RACSequence是否还有内 ...
- Ubuntu 查看CPU温度
按照这篇文章: http://www.webupd8.org/2014/06/psensor-updated-with-option-to-display.html
- python 获取二进制文件
import requests response = requests.get('https://www.baidu.com/aladdin/img/tools/ip.png')with open(' ...
- find中的-print0和xargs中-0的奥妙【转】
find cygnus/firmware_cygnus/target/linux/brcm5830/files/arch/arm/mach-iproc/pm_iproc/ -name "*. ...
- Kali Linux没有声音的解决方法
Kali Linux系统默认状态下,root用户是无法使用声卡的,也就没有声音.启用的方法如下: (1)在终端执行命令:systemctl --user enable pulseaud ...
- 转 Spring Boot之No session repository could be auto-configured, check your configuration问题解决
1. 环境介绍 JDK 1.8 Spring-Boot 1.5.1.RELEASE, STS IDE 2. 问题的提出 创建了一个非常简约的Spring Boot Web Application ...
- Long-Polling, Websockets, SSE(Server-Sent Event) 之间有什么区别?
链接:http://www.mamicode.com/info-detail-1327667.html https://www.jianshu.com/p/d3f66b1eb748?from=time ...
- Python 驱动 MongoDB 示例(PyMongo)
Python 的MongoDB驱动 pymongo ,使用pip Install pymongo安装即可 最近发现网上的很多实例已经过时了,在此自我探究记录下来. 编写一个接口类来支持MongoDB的 ...