实现一个Prometheus exporter
Prometheus 官方和社区提供了非常多的exporter,涵盖数据库、中间件、OS、存储、硬件设备等,具体可查看exporters、exporterhub.io,通过这些 exporter 基本可以覆盖80%的监控需求,依然有小部分需要通过自定义脚本或者定制、修改社区exporter实现。本文我们将学习如何通过go编写一个简单的expoter用于暴露OS的负载。
要实现的三个load指标如下:
exporter的核心是http服务,对外暴露exporter本身运行时指标和监控信息。我们可以直接通过net/http暴力实现,更好的方式是使用Prometheus 官方提供的client library 来简化一部分工作。
client library官方支持语言:
也有社区支持的其他语言库如C、C++、PHP等
获取数据源
在使用client library暴露数据之前,我们得先找到数据源,以linux为例要获取系统负载我们可以读取/proc目录下的loadavg文件。涉及到各类操作系统指标的获取可以参考官方的node-exporter,这里我们给他写成load包,等会直接调用GetLoad()就能拿到数据了。
package collect

import (

        "fmt"

        "io/ioutil"

        "strconv"

        "strings"

)

// The path of the proc filesystem.

var procPath = "/proc/loadavg"

// Read loadavg from /proc.

func GetLoad() (loads []float64, err error) {

        data, err := ioutil.ReadFile(procPath)

        if err != nil {

                return nil, err

        }

        loads, err = parseLoad(string(data))

        if err != nil {

                return nil, err

        }

        return loads, nil

}

// Parse /proc loadavg and return 1m, 5m and 15m.

func parseLoad(data string) (loads []float64, err error) {

        loads = make([]float64, 3)

        parts := strings.Fields(data)

        if len(parts) < 3 {

                return nil, fmt.Errorf("unexpected content in %s", procPath)

        }

        for i, load := range parts[0:3] {

                loads[i], err = strconv.ParseFloat(load, 64)

                if err != nil {

                        return nil, fmt.Errorf("could not parse load '%s': %w", load, err)

                }

        }

        return loads, nil

}
通过client_golang暴露指标
开通我们提到exporter要暴露的指标包含两部分,一是本身的运行时信息,另一个监控的metrics。而运行时信息client_golang已经帮我们实现了,我们要做的是通过client_golang包将监控数据转换为metrics后再暴露出来。
一个最基础使用client_golang包示例如下:
package main

import (

        "net/http"

        "github.com/prometheus/client_golang/prometheus/promhttp"

)

func main() {

        http.Handle("/metrics", promhttp.Handler())

        http.ListenAndServe(":2112", nil)

}
promhttp.Handler()封装了本身的 go 运行时 metrics,并按照metircs后接value的格式在前端输出。
当我们访问2112端口的metrics路径时得到如下数据:
# HELP go_gc_duration_seconds A summary of the pause duration of garbage collection cycles.

# TYPE go_gc_duration_seconds summary

go_gc_duration_seconds{quantile="0"} 0

go_gc_duration_seconds{quantile="0.25"} 0

go_gc_duration_seconds{quantile="0.5"} 0

go_gc_duration_seconds{quantile="0.75"} 0

go_gc_duration_seconds{quantile="1"} 0

go_gc_duration_seconds_sum 0

go_gc_duration_seconds_count 0

# HELP go_goroutines Number of goroutines that currently exist.

# TYPE go_goroutines gauge

go_goroutines 7

# HELP go_info Information about the Go environment.

# TYPE go_info gauge

go_info{version="go1.15.14"} 1

# HELP go_memstats_alloc_bytes Number of bytes allocated and still in use.

# TYPE go_memstats_alloc_bytes gauge

...
如何暴露自定义metrics呢?
先看如下的示例:
package main

import (

	"net/http"

	"time"

	"log"

	"github.com/prometheus/client_golang/prometheus"

	"github.com/prometheus/client_golang/prometheus/promhttp"

)

func recordMetrics() {

	go func() {

		for {

			opsProcessed.Inc()

			time.Sleep(2 * time.Second)

		}

	}()

}

var (

	opsProcessed = prometheus.NewCounter(prometheus.CounterOpts{

		Namespace: "myapp",

		Name:      "processed_ops_total",

		Help:      "The total number of processed events",

	})

)

func main() {

	prometheus.MustRegister(opsProcessed)

	recordMetrics()

	http.Handle("/metrics", promhttp.Handler())

	log.Print("export /metrics on port :8085")

	http.ListenAndServe(":8085", nil)

}
示例来自于官方仓库,做了稍加修改。可以看到使用NewCounter方法可以很快地帮我们创建一个Prometheus Counter数据类型实例。
Counter接口的定义包含了Counter本身的特性-只能增加即Inc和Add,同时还包含Meterics、Collector接口
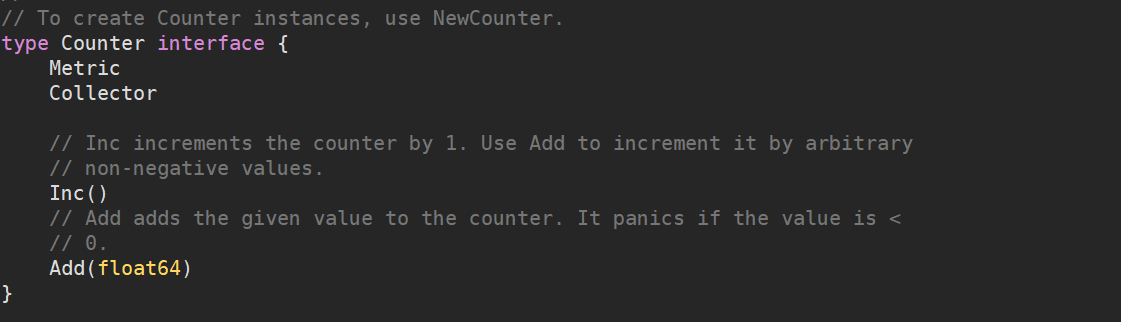
Collector还包含2个方法,待会我们写自己的Collector时需要实现这两个方法。
type Collector interface {

	Describe(chan<- *Desc)

	Collect(chan<- Metric)

}
CounterOpts 来源于metrics.go 的Ops结构体定义了构成metrics的基本结构。

接着将opsProcessed这个Counter进行注册,所谓注册也就是让Handler跟踪这个Counter中的metircs和collector
运行后,访问/metircs可以看到自定义指标myapp_processed_ops_total通过定时的Inc()调用来更新value
# HELP myapp_processed_ops_total The total number of processed events

# TYPE myapp_processed_ops_total counter

myapp_processed_ops_total 15
下面我们通过自定义collector实现一个简易的exporter
目录结构如下:
# tree .

.

├── collect

│   ├── collector.go

│   └── loadavg.go

├── go.mod

├── go.sum

└── main.go
loadavg.go即上面的获取数据源。
collector.go如下:
package collect

import (

	"log"

	"github.com/prometheus/client_golang/prometheus"

)

var namespace = "node"

type loadavgCollector struct {

	metrics []typedDesc

}

type typedDesc struct {

	desc      *prometheus.Desc

	valueType prometheus.ValueType

}

func NewloadavgCollector() *loadavgCollector {

	return &loadavgCollector{

		metrics: []typedDesc{

			{prometheus.NewDesc(namespace+"_load1", "1m load average.", nil, nil), prometheus.GaugeValue},

			{prometheus.NewDesc(namespace+"_load5", "5m load average.", , nil), prometheus.GaugeValue},

			{prometheus.NewDesc(namespace+"_load15", "15m load average.", nil, nil), prometheus.GaugeValue},

		},

	}

}

//Each and every collector must implement the Describe function.

//It essentially writes all descriptors to the prometheus desc channel.

func (collector *loadavgCollector) Describe(ch chan<- *prometheus.Desc) {

	//Update this section with the each metric you create for a given collector

	ch <- collector.metrics[1].desc

}

//Collect implements required collect function for all promehteus collectors

func (collector *loadavgCollector) Collect(ch chan<- prometheus.Metric) {

	//Implement logic here to determine proper metric value to return to prometheus

	//for each descriptor or call other functions that do so.

	loads, err := GetLoad()

	if err != nil {

		log.Print("get loadavg error: ", err)

	}

	//Write latest value for each metric in the prometheus metric channel.

	//Note that you can pass CounterValue, GaugeValue, or UntypedValue types here.

	for i, load := range loads {

		ch <- prometheus.MustNewConstMetric(collector.metrics[i].desc, prometheus.GaugeValue, load)

	}

}
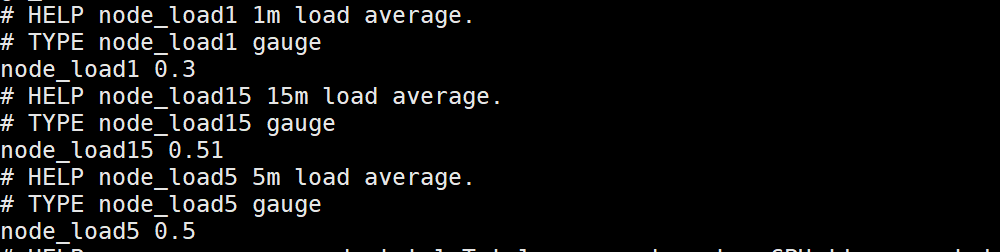
collector中每一个要暴露的metrics都需要包含一个metrics描述即desc,都需要符合prometheus.Desc结构,我们可以直接使用NewDesc来创建。这里我们创建了三个metircs_name分别为node_load1、node_load5、node_15以及相应的描述,也可以加上对应的label。
接着实现collector的两个方法Describe、Collect分别写入对应的发送channel,其中prometheus.Metric的通道传入的值还包括三个load的value
最后在主函数中注册collector
prometheus.MustRegister(collect.NewloadavgCollector())
在Prometheus每个请求周期到达时都会使用GetLoad()获取数据,转换为metircs,发送给Metrics通道,http Handler处理和返回。
实现一个指标丰富、可靠性高的exporter感觉还是有一些困难的,需要对Go的一些特性以及Prometheus client包有较深入的了解。本文是对exporter编写的简单尝试,如实现逻辑、方式或理解不准确可参考开源exporter和官方文档。
文章涉及代码可查看:exporter
通过博客阅读:iqsing.github.io
实现一个Prometheus exporter的更多相关文章
- 编写一个简单的基于jmespath 的prometheus exporter
目的很简单,因为系统好多监控指标是通过json 暴露的,并不是标准的prometheus metrics 格式,处理方法 实际上很简单,我们可以基于jsonpath 解析json数据,转换为prome ...
- Go语言开发Prometheus Exporter示例
一.Prometheus中的基本概念 Prometheus将所有数据存储为时间序列,这里先来了解一下prometheus中的一些基本概念 指标名和标签每个时间序列都由指标名和一组键值对(也称为标签)唯 ...
- prometheus exporter简介
一.服务分类 在线服务:请求的客户端和发起者需要立即响应(高并发.低延迟:并发数.接口响应时间.错误数.延迟时间),面对突发流量能进行资源的自动伸缩 离线服务:请求发送到服务端但不要求立即获取结果(监 ...
- prometheus学习系列十一: Prometheus exporter详解
exporter详解 前面的系列中,我们在主机上面安装了node_exporter程序,该程序对外暴露一个用于获取当前监控样本数据的http的访问地址, 这个的一个程序成为exporter,Expor ...
- prometheus+exporter小测试:
1.golang中使用expoter import ( "github.com/prometheus/client_golang/prometheus/promhttp" ) fu ...
- Prometheus exporter的Node exporter是可以独立安装,用来测试的
现在慢慢在把prometheus operator的一些概念组织完整. https://github.com/coreos/prometheus-operator/tree/master/contri ...
- 使用grok exporter 做为log 与prometheus 的桥
grok 是一个工具,可以用来解析非结构化的日志文件,可以使其结构化,同时方便查询,grok 被logstash 大量依赖 同时社区也提供了一个prometheus 的exporter 可以方便的进行 ...
- Prometheus之Exporter开发
Prometheus开发Exporter简介 Exporter 本身是一个http 服务,其指标结果只要符合 Prometheus 规范就可以被 Prometheus 使用. Prometheus中m ...
- 使用 Prometheus + Grafana 对 Kubernetes 进行性能监控的实践
1 什么是 Kubernetes? Kubernetes 是 Google 开源的容器集群管理系统,其管理操作包括部署,调度和节点集群间扩展等. 如下图所示为目前 Kubernetes 的架构图,由 ...
随机推荐
- partTwo自动出题程序第二阶段
(1)题目避免重复: (2)可定制(数量/打印方式): 代码实现 import java.util.ArrayList;import java.util.Random;import java.util ...
- 支持中文!秒建 wiki 知识库的开源项目,构建私人知识网络
不知道有没有人和我一样,觉得自建的东西是互联网上的"自留地".私人空间,有一种自己的一亩三分地随心所欲的痛快. 比如自建的博客想写什么随笔就写什么,不用取悦读者可以自娱自乐:再比如 ...
- leetcode704二分查找
title: 二分查找 题目描述 题目链接:二分查找 解题思路 二分模板默写 int search(vector<int>& nums, int target) { int lef ...
- 1.还不会部署高可用的kubernetes集群?看我手把手教你使用二进制部署v1.23.6的K8S集群实践(上)
公众号关注「WeiyiGeek」 设为「特别关注」,每天带你玩转网络安全运维.应用开发.物联网IOT学习! 本章目录: 0x00 前言简述 0x01 环境准备 主机规划 软件版本 网络规划 0x02 ...
- 判断数据类型(typeof&instanceof&toString)
一.数据类型 ES6规范中有7种数据类型,分别是基本类型和引用类型两大类 基本类型(简单类型.原始类型):String.Number.Boolean.Null.Undefined.Symbol 引用类 ...
- 用t-SNE进行流形学习(digits数据集)
流行学习算法: 是一类用于可视化的算法,它允许进行更复杂的映射,通常也可以给出更好的可视化. t-SNE算法是其中一种. PCA是用于变换数据的首选方法,也可以进行可视化,但它的性质(先旋转然后减少方 ...
- Python <算法思想集结>之抽丝剥茧聊动态规划
1. 概述 动态规划算法应用非常之广泛. 对于算法学习者而言,不跨过动态规划这道门,不算真正了解算法. 初接触动态规划者,理解其思想精髓会存在一定的难度,本文将通过一个案例,抽丝剥茧般和大家聊聊动态规 ...
- Python Django 功能模块
Python Django模块 Django模块,是针对有django基础,对django功能进行模块化,方便下次使用. 一.注册模块 该注册采用邮箱验证,注册成功后会发送激活链接到邮箱. 邮箱验证参 ...
- C#获取PLC信息 (KepServer)
首先注册DLL 我这里把此DLL放到我自己的网站上了,供大家下载 https://blog.nwctwang.top/OPCDAAuto.dll 把此dll复制到C:\Windows\SysWOW64 ...
- 变量作用域——JavaSE基础
变量作用域 局部变量.成员变量.静态变量的区别 类型 声明位置 从属于 生命周期 局部变量 方法或语句块内部 方法/语句块 从声明位置开始,直到方法或语句块执行完毕,局部变量消失 成员变量 (实例变量 ...