
[数据与分析可视化] D3入门教程1-d3基础知识
d3.js入门教程1-d3基础知识
文章目录
d3.js是一个用于绘图的JavaScript 库。 它可以可视化展示任何类型的数据。 本文档展示了多个交互式示例,说明了d3.js的关键概念,从而生成了第一个基本散点图。
1 HTML介绍
1.1 什么是HTML?
HTML介绍:
- HTML代表超文本标记语言。基本上,它是任何网站背后的语言。Mozilla 或 Safari 等 Web 浏览器会读取此类文件并将其翻译到网页中
- 在HTML文件中,组成网页的元素被创建,并由标签描述。例如,级别1的标题由h1标签表示,带有标签的段落,由p标签表示图像img
- 如果没有 html 的基本知识,就不可能学会d3.js
<!DOCTYPE html>

<!-- 添加标题 -->

<h1>First html document</h1>

<!-- 添加一行文字 -->

<p>This is my first sentence</p>

<!-- 添加链接-->

<p>This is <a href="https://www.d3-graph-gallery.com">a link to the d3 graph gallery</a></p>
First html document
This is my first sentence
This is a link to the d3 graph gallery
将上面的代码复制并粘贴到本地文件中。称之为test.html,便构建一个简单的网页。
1.2 自定义文档样式CSS
CSS代表级联样式表,它允许将特定样式应用于使用html创建的元素。
<!DOCTYPE html>

<!-- 将特定样式应用于inGreen类的元素 -->

<style>

  .inRed { color: red; }

  .inFont { font-size: 20px}

</style>

<!-- 添加标题,并添加相应的类 -->

<h1 class="inFont">First html document</h1>

<!-- 添加一行文字 -->

<p class="inRed">This is my first sentence</p>

<!-- 添加链接 -->

<p>This is <a href="https://www.d3-graph-gallery.com">a link to the d3 graph gallery</a></p>
First html document
This is my first sentence
This is a link to the d3 graph gallery
1.3 构建svg图形
- svg代表可缩放矢量图形。它是一种矢量图像格式。基本上,它是一种允许使用代码构建形状的语言
- d3.js图表实际上是一组svg组合在一起的形状
- d3.js展示了不同形状的svg
<!DOCTYPE html>

<!-- 添加标题 -->

<h1>First html document</h1>

<!-- 添加一行文字 -->

<p>This is my first sentence</p>

<!-- 添加svg形状 -->

<svg>

  <circle style="fill: #69b3a2" stroke="black" cx=50 cy=50 r=40></circle>

</svg>
First html document
This is my first sentence
2 d3绘图入门
2.1 使用Javascript和d3.js修改元素
JavaScript是前端的三大核心技术之一。它实现了网页的交互性。d3.js是一个javascript库,对数据可视化特别有用。它允许创建、选择和修改元素。在下面的示例中, d3用于选择目标圆形并修改其stroke-width。虽然它还不是很令人印象深刻,但是我们将使用相同的过程来设置数百个圆的位置并得到散点图。
    <h1>First html document</h1>

    <!-- 添加标题 -->

    <p>This is my first sentence</p>

    <!-- 添加svg形状 -->

    <svg>

        <circle class="target" style="fill: #69b3a2" stroke="black" cx=50 cy=50 r=40></circle>

    </svg>

    <!-- 加载d3 -->

    <script src="https://d3js.org/d3.v4.js"></script>

    <script>

        d3

            .select(".target")  // 选择target类

            .style("stroke-width", 8) // 修改svg图形轮廓

            .style("opacity", 0.5) // 修改svg图形透明度

    </script>

2.2 Console.log()
浏览器运行Html,css和Javascript并将结果显示为网页,如果出现问题,会在浏览器控制台中发出通知,你可以在右键单击页面打开->检查->console,打开控制台,或者直接按F1。比如在控制台中输入,console.log(“sometext”),就可以打印sometext字符串。
2.3 坐标系
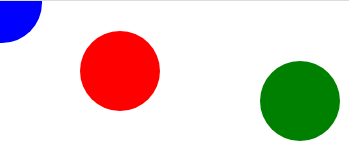
构建d3.js图表首先创建一个svg元素。这个元素有width和height两个参数来控制大小,以像素为单位。左上角的坐标为x=0和y=0,左下角的坐标x=0和y=height,右上角的坐标x=width和height=0,和常见的图片坐标表示一样。显示三个圆的代码如下:
    <!-- 添加一个空的svg图片 -->

    <svg id="dataviz_area" height=200 width=450></svg>

    <!-- 加载d3.js -->

    <script src="https://d3js.org/d3.v4.js"></script>

    <script>

        var svg = d3.select("#dataviz_area")

        // 添加圆,cx和cy为圆心坐标,r为半径

        svg.append("circle")

            .attr("cx", 2).attr("cy", 2).attr("r", 40).style("fill", "blue");

        svg.append("circle")

            .attr("cx", 120).attr("cy", 70).attr("r", 40).style("fill", "red");

        svg.append("circle")

            .attr("cx", 300).attr("cy", 100).attr("r", 40).style("fill", "green");

    </script>
2.4 比例尺
如果想用百分比来表示svg中元素的位置,那么就需要用到比例尺,比例尺就是一个将像素值范围转换为位置百分比的函数。它被称为scale。如果我的数据是百分比并且我的svg区域是400px宽度。那么0%代表0px,100%代表400像素。50%代表200像素。比例尺有domain和range两个属性,range设置像素值范围,domain设置位置百分比。
    <!-- 添加一个空的svg图片 -->

    <svg id="viz_area" height=200 width=450></svg>

    <!-- 加载d3.js -->

    <script src="https://d3js.org/d3.v4.js"></script>

    <script>

        // 选择svg绘图区域

        var svg = d3.select("#viz_area")

        // 创建比例尺

        // 将0到400像素映射到0%到100%

        var x = d3.scaleLinear()

            .domain([0, 100])

            .range([0, 400]);

        // 尝试console.log(x(25))以查看x函数的用途。

        // 以百分比设置图片尺寸

        svg.append("circle")

            .attr("cx", x(10)).attr("cy", 100).attr("r", 40).style("fill", "blue");

        svg.append("circle")

            .attr("cx", x(50)).attr("cy", 100).attr("r", 40).style("fill", "red");

        svg.append("circle")

            .attr("cx", x(100)).attr("cy", 100).attr("r", 40).style("fill", "green");

    </script>

2.5 添加轴
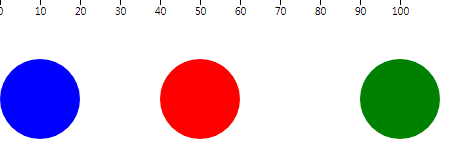
d3提供了一些自动绘制轴的功能。这些轴始终与比例尺scale对应。axisBottom()创建一个水平轴,底部带有刻度和标签。axisLeft()将用于Y 轴。
    <!-- 添加一个空的svg图片 -->

    <svg id="viz_area" height=200 width=450></svg>

    <!-- 加载d3.js -->

    <script src="https://d3js.org/d3.v4.js"></script>

    <script>

        // 选择svg绘图区域

        var svg = d3.select("#viz_area")

        // 创建比例尺

        var x = d3.scaleLinear()

            .domain([0, 100])

            .range([0, 400]);

        // 显示与此比例对应的轴

        svg.call(d3.axisBottom(x));

        // 以百分比设置图片尺寸

        svg.append("circle")

            .attr("cx", x(10)).attr("cy", 100).attr("r", 40).style("fill", "blue");

        svg.append("circle")

            .attr("cx", x(50)).attr("cy", 100).attr("r", 40).style("fill", "red");

        svg.append("circle")

            .attr("cx", x(100)).attr("cy", 100).attr("r", 40).style("fill", "green");

    </script>
2.6 边距和偏移
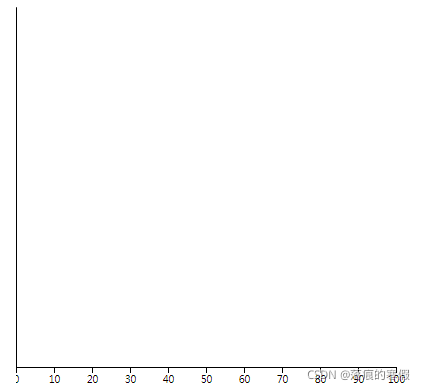
轴位置经常需要调整,例如,X轴通常位于图表的底部。这归功于translation函数,应用.attr(“transform”, “translate(20,50)”)到一个元素,将其向右平移 20 像素,向底部平移 50 像素。
    <!-- 添加一个空的svg图片 -->

    <div id="Area"></div>

    <!-- 加载d3.js -->

    <script src="https://d3js.org/d3.v4.js"></script>

    <script>

        // 设置图形的尺寸和边距

        var margin = { top: 10, right: 40, bottom: 30, left: 30 },

            width = 450 - margin.left - margin.right,

            height = 400 - margin.top - margin.bottom;

        // 将svg对象附加到页面主体

        var svg = d3.select("#Area")

            .append("svg")

            // 留下空白

            .attr("width", width + margin.left + margin.right)

            .attr("height", height + margin.top + margin.bottom)

            .append("g") // 添加标尺

            .attr("transform", "translate(" + margin.left + "," + margin.top + ")"); // 平移图像

        // 创建x轴比例尺

        var x = d3.scaleLinear()

            .domain([0, 100])

            .range([0, width]);

        svg.append('g')

            .attr("transform", "translate(0," + height + ")")

            .call(d3.axisBottom(x));

        // 创建y轴比例尺

        var y = d3.scaleLinear()

            .domain([0, 100])

            .range([height, 0]);

        svg.append('g')

            .call(d3.axisLeft(y));

    </script>
2.7 数据绑定
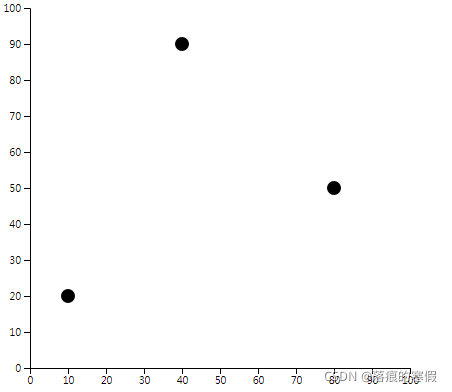
将数据绑定到svg元素是我们完成散点图所需的最后一步。在我看来,这也是最难理解的部分。它始终遵循相同的步骤:
- svg: 选择图表所在的 svg 区域
- .selectAll(“whatever”): 选择所有尚未创建的元素,我知道这很奇怪。
- .data(data): 指定要使用的数据。
- .enter(): 开始数据循环。以下代码将应用于data[0],data[1]依此类推。
- .append(“circle”):对于每次迭代,添加一个圆圈。
- .attr(“cx”, function(d){ return x(d.x) }): 给出圆的x位置。这里d将是data[0],然后data[1]等等。
    <!-- 添加一个空的svg图片 -->

    <div id="scatter_area"></div>

    <!-- 加载d3.js -->

    <script src="https://d3js.org/d3.v4.js"></script>

    <script>

        // 设置图形的尺寸和边距

        var margin = { top: 10, right: 40, bottom: 30, left: 30 },

            width = 450 - margin.left - margin.right,

            height = 400 - margin.top - margin.bottom;

        // 将svg对象附加到页面主体

        var svG = d3.select("#scatter_area")

            .append("svg")

            .attr("width", width + margin.left + margin.right)

            .attr("height", height + margin.top + margin.bottom)

            .append("g")

            .attr("transform",

                "translate(" + margin.left + "," + margin.top + ")");

        // 创建数据

        var data = [{ x: 10, y: 20 }, { x: 40, y: 90 }, { x: 80, y: 50 }]

        // 创建x轴比例尺

        var x = d3.scaleLinear()

            .domain([0, 100])

            .range([0, width]);

        svG.append('g')

            .attr("transform", "translate(0," + height + ")")

            .call(d3.axisBottom(x));

        // 创建y轴比例尺

        var y = d3.scaleLinear()

            .domain([0, 100])

            .range([height, 0]);

        svG.append('g')

            .call(d3.axisLeft(y));

        // 添加数据

        svG.selectAll("whatever")

            .data(data)

            .enter()

            .append("circle")

            .attr("cx", function (d) { return x(d.x) })

            .attr("cy", function (d) { return y(d.y) })

            .attr("r", 7)

    </script>
3 参考
[数据与分析可视化] D3入门教程1-d3基础知识的更多相关文章
- WCF入门教程:WCF基础知识问与答(转)
学习WCF已有近两年的时间,其间又翻译了Juval的大作<Programming WCF Services>,我仍然觉得WCF还有更多的内容值得探索与挖掘.学得越多,反而越发觉得自己所知太 ...
- [数据与分析可视化] D3入门教程2-在d3中构建形状
d3.js入门教程2-在 d3.js中构建形状 文章目录 d3.js入门教程2-在 d3.js中构建形状 形状的添加 圆形的添加 矩形的添加 线段的添加 文本的添加 折线的添加 区域的添加 圆弧的添加 ...
- 使用Code First建模自引用关系笔记 asp.net core上使用redis探索(1) asp.net mvc控制器激活全分析 语言入门必学的基础知识你还记得么? 反射
使用Code First建模自引用关系笔记 原文链接 一.Has方法: A.HasRequired(a => a.B); HasOptional:前者包含后者一个实例或者为null HasR ...
- [数据与分析可视化] D3入门教程3-d3中的数据操作
d3.js入门教程3-d3.js中的数据操作 文章目录 d3.js入门教程3-d3.js中的数据操作 数学操作 对象和数组 过滤Filtering 排序Sorting 映射group 循环loop 重 ...
- Wireshark数据包分析(一)——使用入门
Wireshark简介: Wireshark是一款最流行和强大的开源数据包抓包与分析工具,没有之一.在SecTools安全社区里颇受欢迎,曾一度超越Metasploit.Nessus.Aircrack ...
- WPF入门教程系列一——基础
一. 前言 最近在学习WPF,学习WPF首先上的是微软的MSDN,然后再搜索了一下网络有关WPF的学习资料.为了温故而知新把学习过程记录下来,以备后查.这篇主要讲WPF的开发基础,介绍了如何使用V ...
- Thrift入门初探(2)--thrift基础知识详解
昨天总结了thrift的安装和入门实例,Thrift入门初探--thrift安装及java入门实例,今天开始总结一下thrift的相关基础知识. Thrift使用一种中间语言IDL,来进行接口的定义, ...
- 《Python编程:从入门到实践》基础知识部分学习笔记整理
简介 此笔记为<Python编程:从入门到实践>中前 11 章的基础知识部分的学习笔记,不包含后面的项目部分. 书籍评价 从系统学习 Python 的角度,不推荐此书,个人更推荐使用< ...
- Apache Shiro 快速入门教程,shiro 基础教程
第一部分 什么是Apache Shiro 1.什么是 apache shiro : Apache Shiro是一个功能强大且易于使用的Java安全框架,提供了认证,授权,加密,和会话管理 ...
随机推荐
- 7.httpie
可以使用curl或httpie测试我们的服务器.Httpie是用Python编写的用户友好的http客户端 安装:pip3 install httpie #get请求示例 输入命令:http ht ...
- 微信小程序——悬浮按钮
关键: position: fixed; wxml: <navigator url="/pages/issue/index"><image class='i ...
- 利用xtrabackup8完全,增量备份及还原MySQL8
利用xtrabackup8完全,增量备份及还原MySQL8 1.环境准备 服务器 作用 数据库版本 xtrabackup版本 10.0.0.8 数据备份 mysql8.0.26 8.0.28 10.0 ...
- 二、.Net Core搭建Ocelot
上一篇文章介绍了Ocelot的基本概念:https://www.cnblogs.com/yangleiyu/p/15043762.html 本文介绍在.net core中如何使用ocelot. Oce ...
- SpringCloud(六) - RabbitMQ安装,三种消息发送模式,消息发送确认,消息消费确认(自动,手动)
1.安装erlang语言环境 1.1 创建 erlang安装目录 mkdir erlang 1.2 上传解压压缩包 上传到: /root/ 解压缩# tar -zxvf otp_src_22.0.ta ...
- Unreal NetMode&NetRole 解析
Version: Unreal 4.26 问题 为啥UE编辑器会有EPlayNetMode有三种让你选择. 为啥描述World 的ENetMode 会有4种,而不只是(Client/Server 2种 ...
- Spring Boot 中使用 Swagger
前后端分离开发,后端需要编写接⼝说明⽂档,会耗费⽐较多的时间. swagger 是⼀个⽤于⽣成服务器接⼝的规范性⽂档,并且能够对接⼝进⾏测试的⼯具. 作用 ⽣成接⼝说明⽂档 对接⼝进⾏测试 使用步骤 ...
- 《ASP.NET Core技术内幕与项目实战》精简集-目录
本系列是杨中科2022年最新作品<ASP.NET Core技术内幕与项目实战>及B站配套视频(强插点赞)的精简集,是一个读书笔记.总结和提炼了主要知识点,遵守代码优先原则,以利于快速复习和 ...
- C#结构体大小问题
using System; using System.Collections.Generic; using System.Linq; using System.Runtime.InteropServi ...
- Vue2学习笔记
1.插值语法: 1.1.功能: 用于解析标签体内容 1.2.写法: {{ xxx }},xxx是js表达式,且可以直接读取到data中的所有属性. 2.收集表单数据 若:<input type= ...