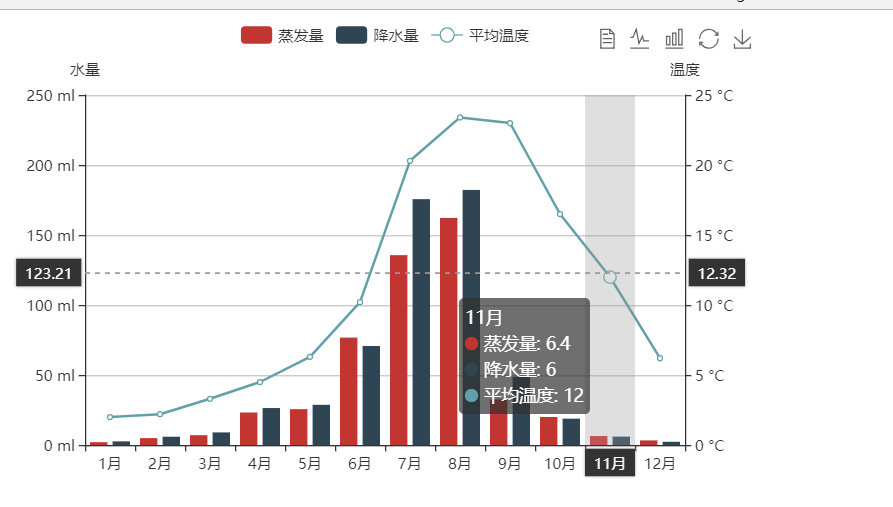
Echarts 几个常用图
最近公司业务上的 需求,要求做一些图表,我们技术框架上选择方便使用的Echarts.
下面是效果图:
下面是具体代码:
<!DOCTYPE html>
<html>
<head>
<meta charset="utf-8">
<title>折柱混合</title>
<!-- 引入 echarts.js -->
<script src="https://cdn.bootcss.com/echarts/4.1.0.rc2/echarts.min.js"></script>
</head>
<body>
<!-- 为ECharts准备一个具备大小(宽高)的Dom -->
<div id="main" style="width: 600px;height:400px;"></div>
<div id="main2" style="width: 600px;height:400px;"></div>
<div id="main3" style="width: 600px;height:400px;"></div>
<div id="main4" style="width: 600px;height:400px;"></div>
<script type="text/javascript">
// 基于准备好的dom,初始化echarts实例
var myChart = echarts.init(document.getElementById('main'));
var myChart2 = echarts.init(document.getElementById('main2'));
var myChart3 = echarts.init(document.getElementById('main3'));
var myChart4 = echarts.init(document.getElementById('main4')); //app.title = '折柱混合'; option = {
tooltip: {
trigger: 'axis',
axisPointer: {
type: 'cross',
crossStyle: {
color: '#999'
}
}
},
toolbox: {
feature: {
dataView: {show: true, readOnly: false},
magicType: {show: true, type: ['line', 'bar']},
restore: {show: true},
saveAsImage: {show: true}
}
},
legend: {
data:['蒸发量','降水量','平均温度']
},
xAxis: [
{
type: 'category',
data: ['1月','2月','3月','4月','5月','6月','7月','8月','9月','10月','11月','12月'],
axisPointer: {
type: 'shadow'
}
}
],
yAxis: [
{
type: 'value',
name: '水量',
min: 0,
max: 250,
interval: 50,
axisLabel: {
formatter: '{value} ml'
}
},
{
type: 'value',
name: '温度',
min: 0,
max: 25,
interval: 5,
axisLabel: {
formatter: '{value} °C'
}
}
],
series: [
{
name:'蒸发量',
type:'bar',
data:[2.0, 4.9, 7.0, 23.2, 25.6, 76.7, 135.6, 162.2, 32.6, 20.0, 6.4, 3.3]
},
{
name:'降水量',
type:'bar',
data:[2.6, 5.9, 9.0, 26.4, 28.7, 70.7, 175.6, 182.2, 48.7, 18.8, 6.0, 2.3]
},
{
name:'平均温度',
type:'line',
yAxisIndex: 1,
data:[2.0, 2.2, 3.3, 4.5, 6.3, 10.2, 20.3, 23.4, 23.0, 16.5, 12.0, 6.2]
}
]
};
option2 = {
title : {
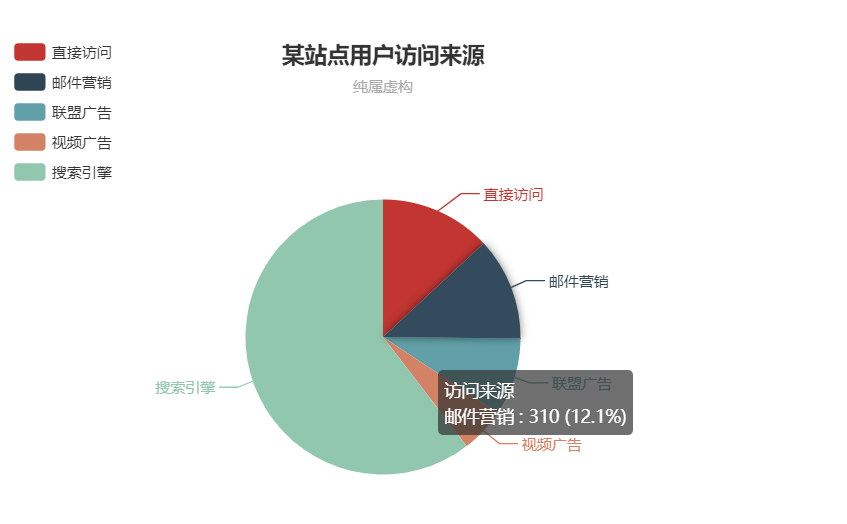
text: '某站点用户访问来源',
subtext: '纯属虚构',
x:'center'
},
tooltip : {
trigger: 'item',
formatter: "{a} <br/>{b} : {c} ({d}%)"
},
legend: {
orient: 'vertical',
left: 'left',
data: ['直接访问','邮件营销','联盟广告','视频广告','搜索引擎']
},
series : [
{
name: '访问来源',
type: 'pie',
radius : '55%',
center: ['50%', '60%'],
data:[
{value:335, name:'直接访问'},
{value:310, name:'邮件营销'},
{value:234, name:'联盟广告'},
{value:135, name:'视频广告'},
{value:1548, name:'搜索引擎'}
],
itemStyle: {
emphasis: {
shadowBlur: 10,
shadowOffsetX: 0,
shadowColor: 'rgba(0, 0, 0, 0.5)'
}
}
}
]
};
option3 = {
title: {
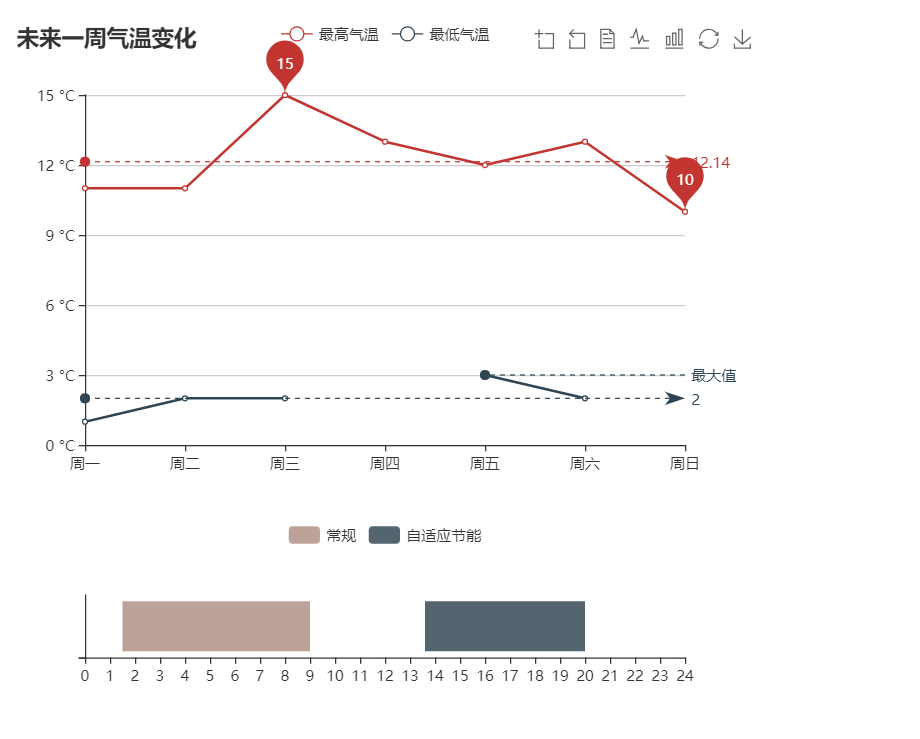
text: '未来一周气温变化',
},
tooltip: {
trigger: 'axis'
},
legend: {
data:['最高气温','最低气温']
},
toolbox: {
show: true,
feature: {
dataZoom: {
yAxisIndex: 'none'
},
dataView: {readOnly: false},
magicType: {type: ['line', 'bar']},
restore: {},
saveAsImage: {}
}
},
xAxis: {
type: 'category',
boundaryGap: false,
data: ['周一','周二','周三','周四','周五','周六','周日']
},
yAxis: {
type: 'value',
axisLabel: {
formatter: '{value} °C'
}
},
series: [
{
name:'最高气温',
type:'line',
data:[11, 11, 15, 13, 12, 13, 10],
markPoint: {
data: [
{type: 'max', name: '最大值'},
{type: 'min', name: '最小值'}
]
},
markLine: {
data: [
{type: 'average', name: '平均值'}
]
}
},
{
name:'最低气温',
type:'line',
data:[1, 2, 2, '', 3, 2, ],
markPoint: {
data: [
{name: '周最低', value: -2, xAxis: 1, yAxis: -1.5}
]
},
markLine: {
data: [
{type: 'average', name: '平均值'},
[{
symbol: 'none',
x: '90%',
yAxis: 'max'
}, {
symbol: 'circle',
label: {
normal: {
position: 'start',
formatter: '最大值'
}
},
type: 'max',
name: '最高点'
}]
]
}
}
]
};
option4 = {
tooltip:{
show:false
},
legend: {
data: ['1', '常规','1','自适应节能','1'], },
color:[ 'transparent', '#bda29a','transparent', '#546570', 'transparent'],
grid: {
height:50
},
xAxis: {
type: 'value',
min: 0,
max: 24,
maxInterval: 1,
splitLine:{
show:false
}, },
yAxis: {
type: 'category',
data: [''], },
series: [
{
name: '',
type: 'bar',
stack: '总量',
label: {
normal: {
show: false,
}
},
data: [1.5]
},
{
name: '常规',
type: 'bar',
stack: '总量',
label: {
normal: {
show: false,
//show: true, }
},
data: [7.5]
},
{
name: '',
type: 'bar',
stack: '总量',
label: {
normal: {
show: false,
//show: true, }
},
data: [4.6]
},
{
name: '自适应节能',
type: 'bar',
stack: '总量',
label: {
normal: {
show: false,
//show: true, }
},
data: [6.4]
},
{
name: '',
type: 'bar',
stack: '总量',
label: {
normal: {
show: true, }
},
data: [2]
}
]
};
// 使用刚指定的配置项和数据显示图表。
myChart.setOption(option);
myChart2.setOption(option2);
myChart3.setOption(option3);
myChart4.setOption(option4); </script>
</body>
</html>
Echarts 几个常用图的更多相关文章
- ECharts系列:玩转ECharts之常用图(折线、柱状、饼状、散点、关系、树)
一.背景 最近产品叫我做一些集团系列的统计图,包括集团组织.协作.销售.采购等方面的.作为一名后端程序员,于是趁此机会来研究研究这个库. 如果你仅仅停留在用的层面,那还是蛮简单的. 二.介绍 ECha ...
- UML常用图
序列图 活动图
- UML常用图的几种关系的总结
在UML的 类图中,常见的有以下几种关系: 泛化(Generalization), 实现(Realization), 关联(Association), 聚合(Aggregation), 组合(Com ...
- (转)UML常用图的几种关系的总结
在UML的类图中,常见的有以下几种关系: 泛化(Generalization), 实现(Realization), 关联(Association), 聚合(Aggregation), 组合(Comp ...
- Enterprise Architect与startUML表示UML常用图
转自:http://www.cnblogs.com/alexlee73/archive/2011/11/05/2237294.html 附下载地址:http://download.csdn.net/d ...
- iOS 常用图尺寸 汇总
iCON 准备一张1024x1024尺寸的图,打开链接 http://www.atool.org/ios_logo.php 在线批量生成各种尺寸的图片 启动图LaunchImage 640x960 2 ...
- python数据分析常用图大集合
目录 一.折线图 二.直方图 三.垂直条形图 四.水平条形图 五.饼图 六.箱线图 七.热力图 八.散点图 九.蜘蛛图 十.二元变量分布 十一.面积图 十二.六边形图 以下默认所有的操作都先导入了Nu ...
- Python数据分析入门(十四):数据分析中常用图
折线图: 折线图用于显示数据在一个连续的时间间隔或者时间跨度上的变化,它的特点是反映事物随时间或有序类别而变化的趋势.示例图如下: 折线图应用场景: 折线图适合X轴是一个连续递增或递减的,对于没有规律 ...
- Apache 的 httpd.conf 详解
ServerRoot “/usr/local“ ServerRoot用于指定守护进程httpd的运行目录,httpd在启动之后将自动将进程的当前目录改变为这个目录,因此如果设置文件中指定的文件或目录是 ...
随机推荐
- BeanUtils.copyProperties缓解代码压力,释放双手
简单描述:之前在写代码的时候,经常把表单提交到后台的对象的参数,通过getter方法取出来,然后,再通过setter方法传递给需要的对象,代码中写了很多get set这种方法,后来听同事说,sprin ...
- js中valueOf方法的使用
今天一位刚毕业的同事问了我一个问题,为什么这段代码执行结果是-1.代码如下: var o = { valueOf: function(){ return -1; } }; o = +o; 当时我也是懵 ...
- Windbg分析蓝屏Dump文件
一.WinDbg是什么?它能做什么? WinDbg是在windows平台下,强大的用户态和内核态调试工具.它能够通过dmp文件轻松的定位到问题根源,可用于分析蓝屏.程序崩溃(IE崩溃)原因,是我们日常 ...
- Node js redis
const redis = require('redis');//redis , '172.16.4.2'); //redis操作 client.set("hello", &quo ...
- Docker 的点点滴滴
Docker 是一个开源的应用容器引擎,基于 Go 语言 并遵从Apache2.0协议开源. Docker 可以让开发者打包他们的应用以及依赖包到一个轻量级.可移植的容器中,然后发布到任何流行的 Li ...
- Anaconda python环境管理
1.查看conda的版本: conda --version 2. 查看当前系统安装已的python环境: conda info --envs 3. 添加python环境: conda create - ...
- 2018-2019 20165235 网络对抗技术 Exp0:kali的安装
2018-2019 20165235 网络对抗技术 Exp0:kali的安装 安装kali 在官网上https://www.kali.org/下载kali 下载之后进行解压 打开VMware-> ...
- DWM1000 自动应答代码实现与实例
这一节继续继承之前帧过滤部分,首先补充一下关于帧过滤部分,如果将目标地址设置为0xFFFF,则同一个网络(物理频道与PANID 都相同),所有节点都应该收到这条信息,这个信息为广播信息,0xFFFF为 ...
- python可视化库 Matplotlib 01 figure的详细用法
1.上一章绘制一幅最简单的图像,这一章介绍figure的详细用法,figure用于生成图像窗口的方法,并可以设置一些参数 2.先看此次生成的图像: 3.代码(代码中有详细的注释) # -*- enco ...
- go http
先看一个简单的 tcp 连接: // server ln, err := net.Listen("tcp", ":8000") if err != nil {} ...