prometheus + grafana + node_exporter + alertmanager 的安装部署与邮件报警 (一)
大家一定要先看详细的理论教程,再开始搭建,这样报错后才容易找到突破口
参考文档
https://www.cnblogs.com/afterdawn/p/9020129.html

https://www.ibm.com/developerworks/cn/cloud/library/cl-lo-prometheus-getting-started-and-practice/

https://www.hi-linux.com/posts/25047.html    参考grafana安装

https://www.ctolib.com/docs/sfile/prometheus-book/

https://www.ctolib.com/docs/sfile/prometheus-book/quickstart/index.html      理论 详解教程

https://codegreen.cn/2018/09/28/prometheus-install/#31%E5%AE%89%E8%A3%85%E9%85%8D%E7%BD%AE-alertmanager
背景介绍
Prometheus是由SoundCloud开发的开源监控报警系统和时序列数据库(TSDB)。Prometheus使用Go语言开发,是Google BorgMon监控系统的开源版本。
Prometheus的特点:
多维度数据模型。
灵活的查询语言。
不依赖分布式存储,单个服务器节点是自主的。
通过基于HTTP的pull方式采集时序数据。
可以通过中间网关进行时序列数据推送。
通过服务发现或者静态配置来发现目标服务对象。
支持多种多样的图表和界面展示,比如Grafana等。
相关组件:
Prometheus Server --- Prometheus组件中的核心部分,负责实现对监控数据的获取,存储以及查询。
Push Gateway --- Prometheus数据采集基于Pull模型,当Prometheus Server不能直接与Exporter进行通信时,可利用PushGateway来进行中转。即通过PushGateway将内部网络的监控数据主动Push到Gateway当中,Prometheus Server再采用同样Pull的方式从PushGateway中获取监控数据。
Exporter --- 数据采集组件,它并不向中央服务器发送数据,而是等待中央服务器主动前来抓取。其将监控数据采集的端点通过HTTP服务的形式暴露给Prometheus Server,Prometheus Server通过访问该Exporter提供的Endpoint端点,即可获取到需要采集的监控数据。
alertmanager --- 若Promtheus Server中发现某监控项满足PromQL中定义的告警规则,则会产生一条告警,并将其交于AlertManager进行管理。在AlertManager中可以配置各种通知方式,也可以定义Webhook自定义告警处理方式。AlertManager即Prometheus体系中的告警处理中心。
服务器
--------- ip --------------------------- 安装软件 ---------------------
192.168.20.135 | Prometheus、grafana 、alertmanager
192.168.20.137 | node_exporter
安装Prometheus
wget https://github.com/prometheus/prometheus/releases/tag/v2.1.0/prometheus-2.1.0.linux-amd64.tar.gz

tar -xvf prometheus-2.1.0.linux-amd64.tar.gz -C /usr/local/

mv /usr/local/prometheus-2.1.0.linux-amd64  /usr/local/prometheus-2.1
启动prometheus
cd /usr/local/prometheus-2.1

./prometheus &

netstat -tunlp|grep 9090
prometheus server是可以获取到本机数据的,可用以下命令查看
curl localhost:9090/metrics
web页面
http://192.168.20.135:9090/targets
安装node_exporter
node_exporter我安装在192.168.20.137上,你也可以安装在server上,采集server数据。
wget https://github.com/prometheus/node_exporter/releases/download/v0.16.0-rc.3/node_exporter-0.16.0-rc.3.linux-amd64.tar.gz

tar -xvf node_exporter-0.16.0-rc.3.linux-amd64.tar.gz -C /usr/local/

mv /usr/local/node_exporter-0.16.0-rc.3.linux-amd64/ /usr/local/node_exporter-0.16
启动node_exporter
cd /usr/local/node_exporter-0.16

./node_exporter &

netstat -tunlp|grep 9100
查看各项监控指标是否有数据了:
curl localhost:9100/metrics
在server端prometheus.yml末尾添加job:
vim /usr/local/prometheus-2.1/prometheus.yml

  - job_name: 'export_test2'

    static_configs:

      - targets: ['192.168.20.137:9100']

        labels:

          instance: 'node2'
重启prometheus:
killall prometheus

cd /usr/local/prometheus-2.1/

./prometheus
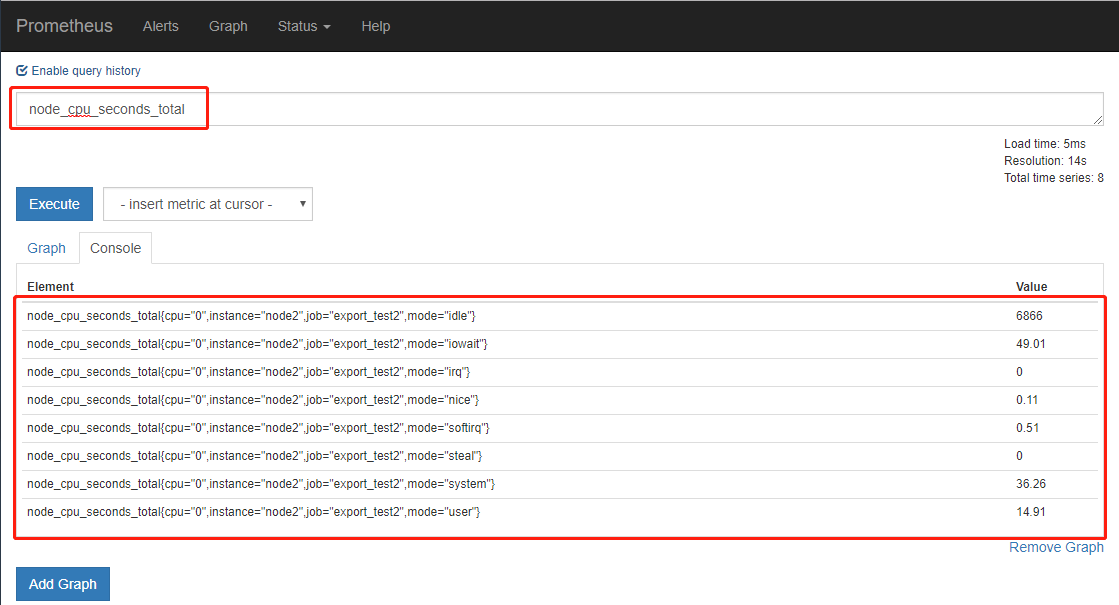
在prometheus的web界面查看:status --> targets

我们可以随便查看一个监控项,看是否获取到值,也可在Graph下进行数据的查找与曲线图的展示
安装grafana
grafana与prometheus进行对接,可以对数据进行更好的展示
wget https://dl.grafana.com/oss/release/grafana-5.4.3.linux-amd64.tar.gz

tar -xvf grafana-5.4.3.linux-amd64.tar.gz -C /usr/local/
启动grafana
cd /usr/local/grafana-5.4.3/bin/

./grafana-server &
登录grafana的web页面
http://192.168.20.135:3000/

admin/admin
添加数据源与自带模板
Add data source --> http://192.168.20.135:9090 --> Dashboards --> prometheus2.0 --> save&test


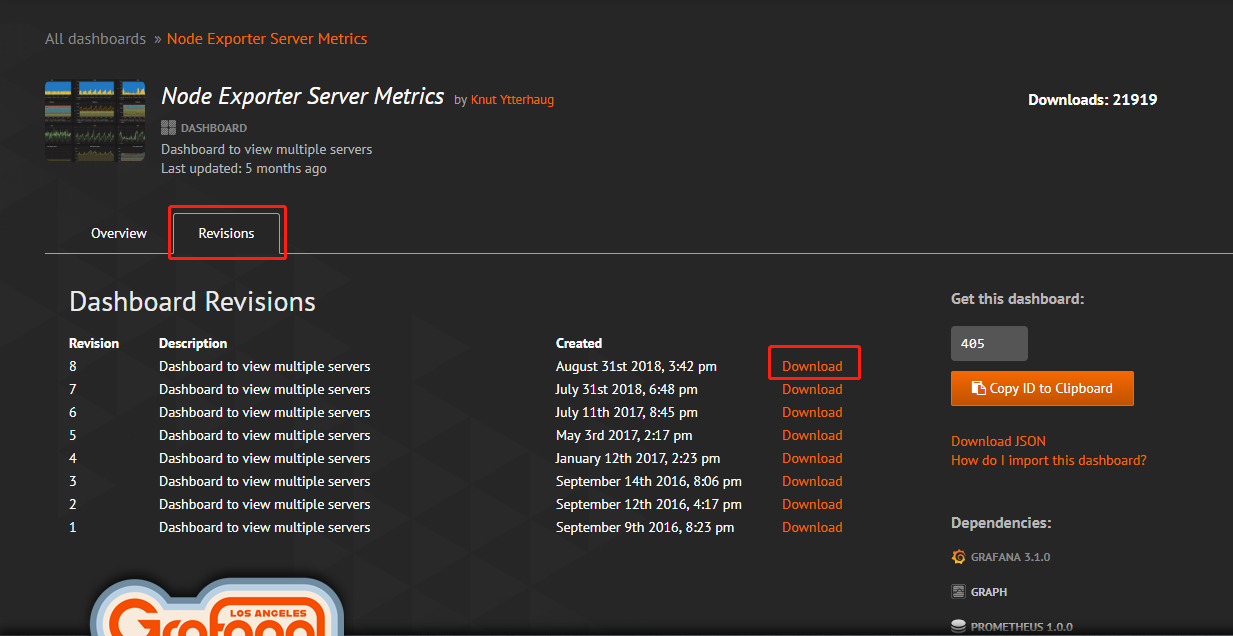
添加node-exporter-server-metrics 模板
下载方法:https://grafana.com/dashboards/405 --> Dashboards -->在如图搜索框搜索node-exporter-server-metrics -->点击第一个进去 --> version --> download

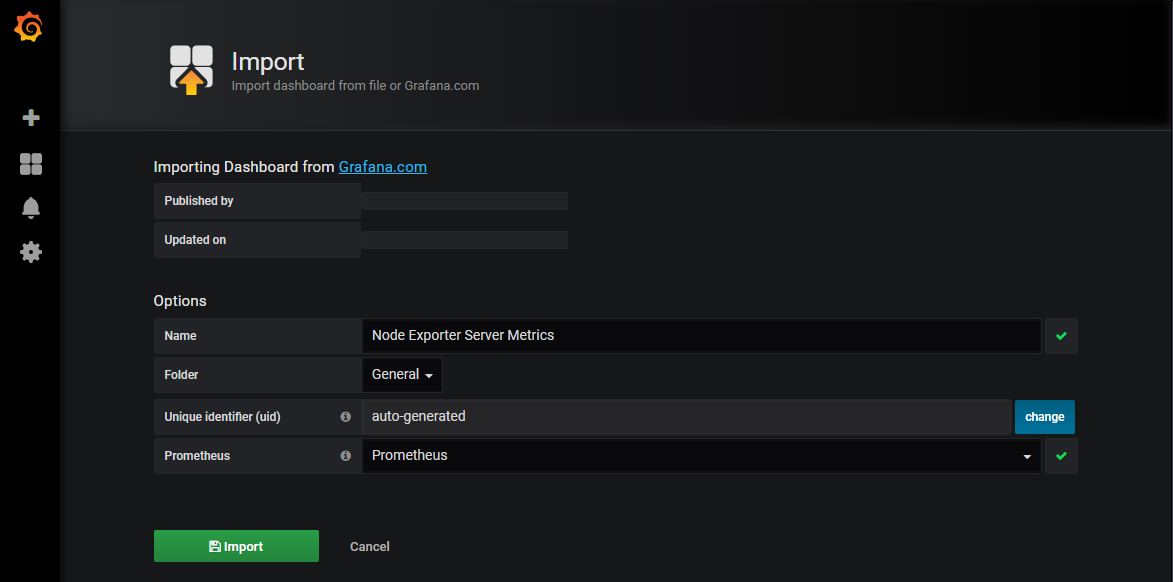
在grafana的Dashboard 中导入模板的json文件

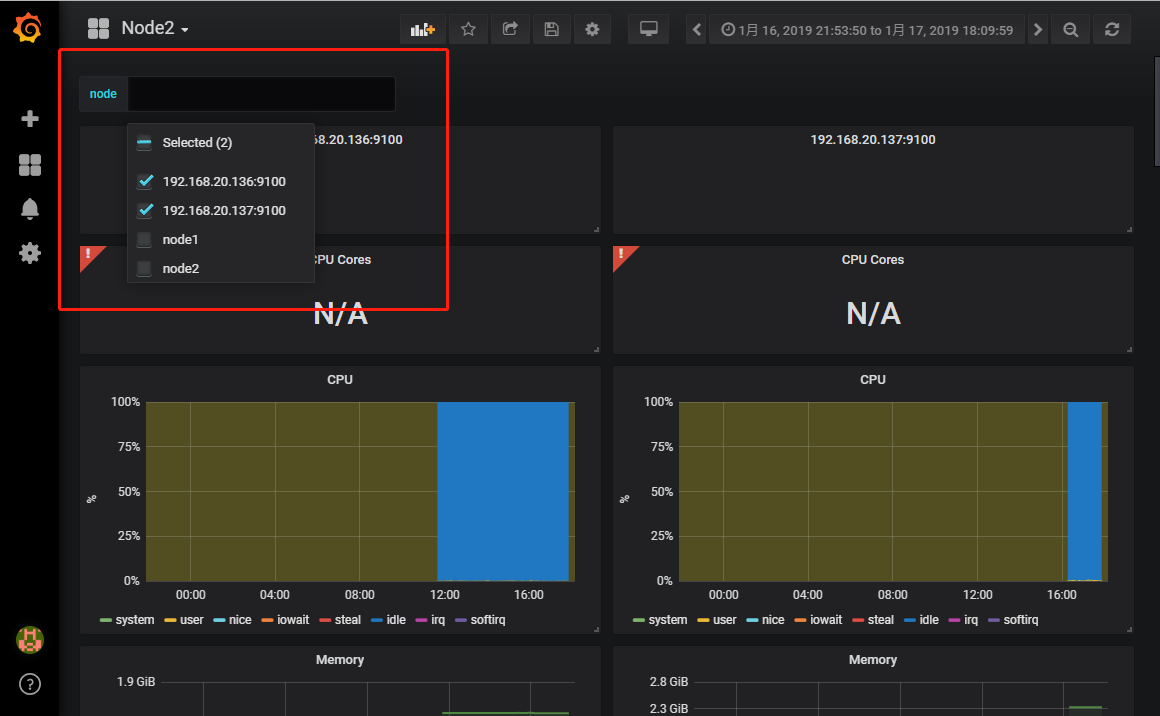
同时存在多个job,可以勾选展示。
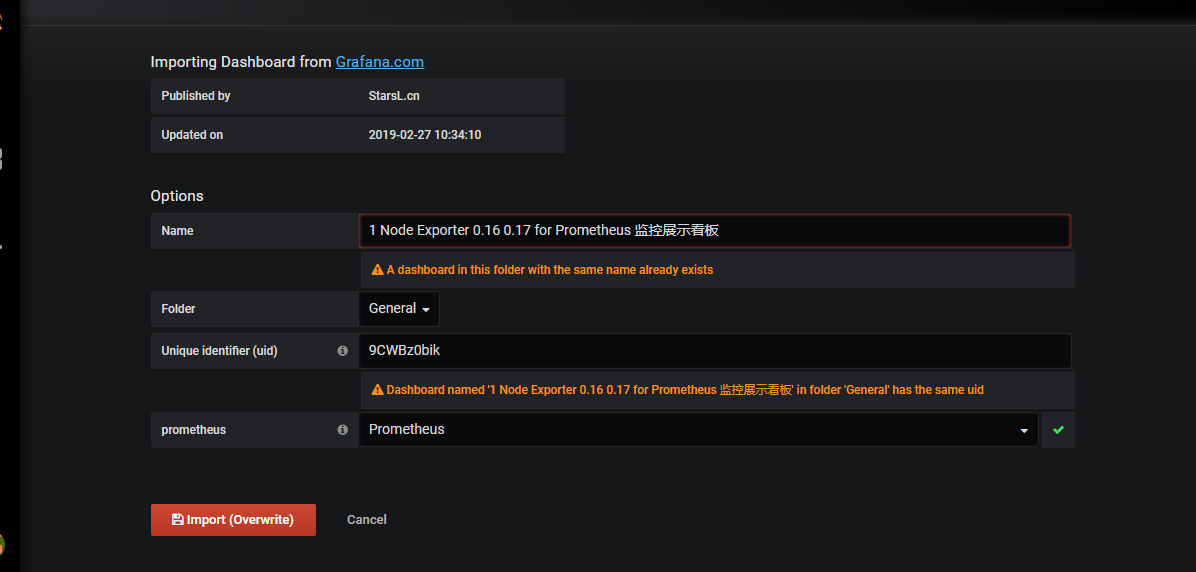
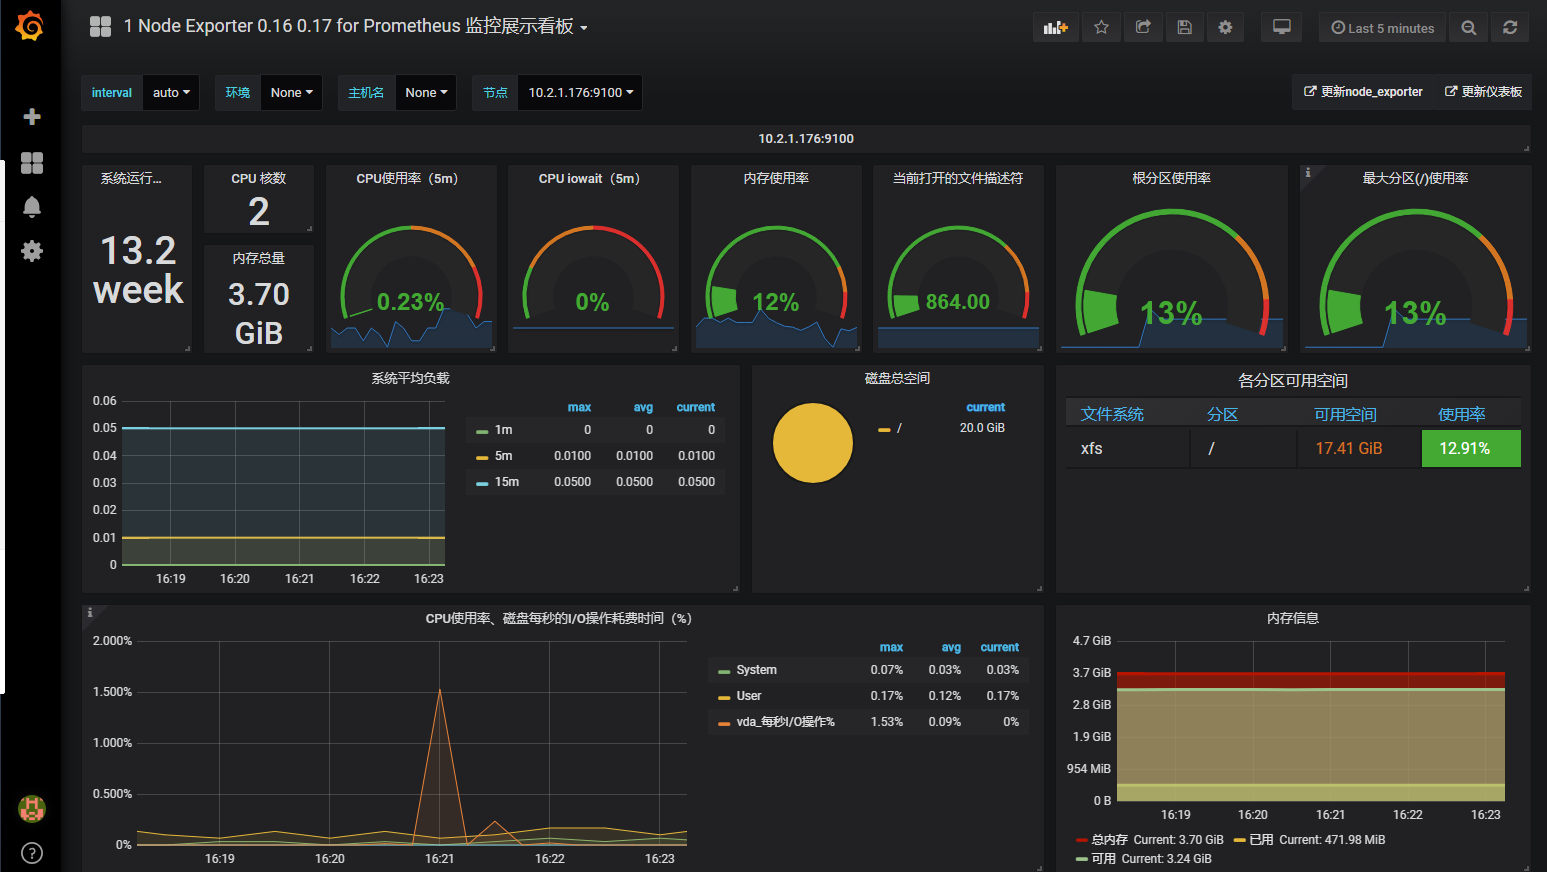
添加1 Node Exporter 0.16 0.17 for Prometheus 监控展示看板
此监控模板基于node_exporter 可以更好的展示多项基本监控项
模板url: https://grafana.com/dashboards/8919
在grafana所在server安装饼图插件,并重启grafana
cd /usr/local/grafana/bin

./grafana-cli plugins install grafana-piechart-panel

killall grafana-server

./grafana-server restart &
图形界面配置
grafana + --> import --> 将以上该模板的url 填到Grafana.com Dashboard中 -->
展示
alertmanager的告警配置
自定义prometheus告警规则
以下规则定义当job export_test2的node_exporter服务挂掉,即产生一个告警
vim /usr/local/prometheus-2.1/rule.yml

groups:

- name: alert-rules                               #告警的分组,后续告警优化时,可通过分组做优化配置

  rules:

  - alert: InstanceStatus                        #告警规则名称

    expr: up{job="export_test2"} == 0    #1是服务正常 ,0服务挂了

    for: 10s                                             #评估等待10s,等待期间报警状态为pending

    labels:                                               #此标签可用于match之后的通知操作

      severity: 'critical'

    annotations:                                      #描述告警信息

      description: 服务器 已宕机

      summary: 服务器 运行状态
在prometheus的配置文件中添加该规则
vim /usr/local/prometheus-2.1/prometheus.yml

rule_files:

  - "/usr/local/prometheus-2.1/rule.yml"
安装alertmanager
https://github.com/prometheus/alertmanager/releases/download/v0.15.2/alertmanager-0.15.2.linux-amd64.tar.gz

tar -xvf alertmanager-0.15.2.linux-amd64.tar.gz -C /usr/local

mv /usr/local/alertmanager-0.15.2.linux-amd64 /usr/local/alertmanager-0.15.2
启动alertmanager
cd /usr/local/alertmanager-0.15.2

./alertmanager &
在prometheus的配置文件中配置alertmanager地址,让其知晓alertmanager的地址,以传送告警信息
vim /usr/local/prometheus-2.1/prometheus.yml

alerting:

  alertmanagers:

  - static_configs:

    - targets: ['localhost:9093']
重启promethous
killall prometheus

cd /usr/local/prometheus-2.1/

./prometheus
测试:
此时关闭192.168.20.137的node_exporter服务
killall node_exporter
查看prometheus的web界面,已经产生告警:

再查看alertmanager已经接收到来自prometheus的告警:

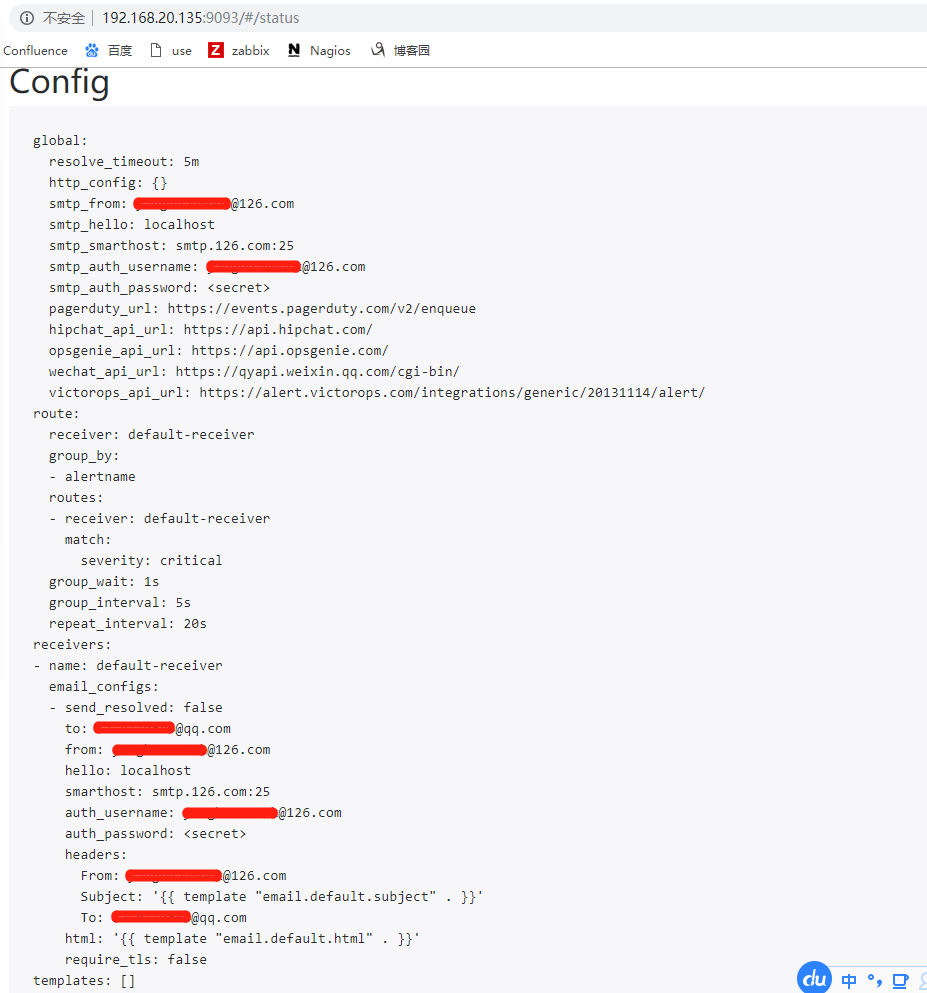
配置告警处理策略
新建alertmanager.yml,由于要进行发邮件测试,将等待时间和间隔时间设置的很短
vim /usr/local/alertmanager-0.15.2/alertmanager.yml

global:                  #若所有的邮件配置使用相同的SMTP配置,则可以直接定义全局的SMTP配置

  smtp_smarthost: 'smtp.126.com:25'

  smtp_from: 'xxxx@126.com'

  smtp_auth_username: 'xxxx@126.com'

  smtp_auth_password: 'xxx121212'        #这是授权码,不是密码,

  smtp_require_tls: false

#templates:          #默认Alertmanager使用系统自带的默认通知模板 ,用户也可在此自定义模板

#  - '/alertmanager/template/*.tmpl'

route:                   #顶级路由必须匹配所有报警,因为他要接受所有报警,再分匹配到分支路由上

  group_by: ['alertname']   #满足group_by中定义标签名称,那么这些告警将会合并为一个通知发送给接收器。

  group_wait: 1s              #同一group的等待时间,在等待时间内当前group接收到了新的告警,这些告警将会合并为一个通知向receiver发送

  group_interval: 5s         #同一Gourp发送告警通知的时间间隔

  repeat_interval: 20s      #在连续告警触发的情况下,重复发送告警的时间间隔

  receiver: 'default-receiver'

  routes:                 #分支路由,可设置不同的匹配规则

  - receiver: 'default-receiver'

    match:              #匹配告警规则的key:value

      severity: 'critical'

receivers:

- name: 'default-receiver'

  email_configs:

  - to: '1xxxx@qq.com'

    send_resolved: true  #告警解除发送恢复通知
重启alertmanager
killall alertmanager

cd /usr/local/alertmanager-0.15.2

./alertmanager &
查看alertmanager的配置是否加载,点击web页面的status
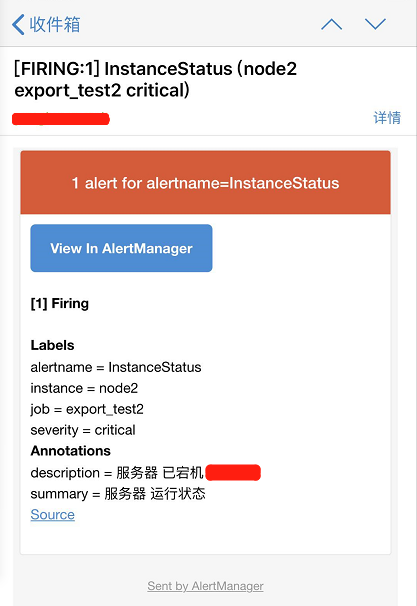
查看接收到的邮件报警信息
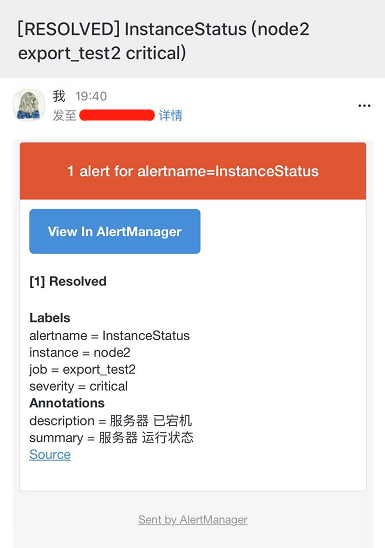
解除报警后的恢复邮件
prometheus + grafana + node_exporter + alertmanager 的安装部署与邮件报警 (一)的更多相关文章
- [k8s]prometheus+alertmanager二进制安装实现简单邮件告警
本次任务是用alertmanaer发一个报警邮件 本次环境采用二进制普罗组件 本次准备监控一个节点的内存,当使用率大于2%时候(测试),发邮件报警. k8s集群使用普罗官方文档 环境准备 下载二进制h ...
- elasticsearch5之Elastalert 安装使用 配置邮件报警和微信报警
简介 Elastalert是用python2写的一个报警框架(目前支持python2.6和2.7,不支持3.x),github地址为 https://github.com/Yelp/elastaler ...
- Kubernetes部署Prometheus+Grafana(非存储持久化方式部署)
1.在master节点处新建一个文件夹,用于保存下载prometheus+granfana的yaml文件 mkdir /root/prometheus cd /root/prometheus git ...
- CentOS 7.4 安装部署 iRedMail 邮件服务器
在公司部署了一套开源的邮件网关Scrollout F1用来测试,由于Scrollout F1需要使用IMAP协议连接到邮件服务器上的隔离邮箱,抓取GOOD和BAD文件夹里的邮件进行贝叶斯学习,但公司的 ...
- zabbix3.0.4安装部署与SendEmail报警配置
MySQL:5.6.21 nginx:1.62 PHP:5.7 pcre:8.32 zabbix:3.0.4 LNMP安装步骤略过 # tar xvf zabbix-3.0.4.tar.gz # cd ...
- prometheus+grafana监控redis
prometheus+grafana监控redis redis安装配置 https://www.cnblogs.com/autohome7390/p/6433956.html redis_export ...
- Prometheus 和 Grafana 安装部署
Prometheus 是一套开源的系统监控报警框架.Prometheus 作为生态圈 Cloud Native Computing Foundation(简称:CNCF)中的重要一员,其活跃度仅次于 ...
- Prometheus + Grafana 部署说明之「安装」
说明 在前面的Prometheus学习系列文章里,大致介绍说明了Prometheus和Grafana的一些使用,现在开始介绍如何从头开始部署Prometheus+Grafana,来监控各个相关的指标数 ...
- kubernetes(k8s) Prometheus+grafana监控告警安装部署
主机数据收集 主机数据的采集是集群监控的基础:外部模块收集各个主机采集到的数据分析就能对整个集群完成监控和告警等功能.一般主机数据采集和对外提供数据使用cAdvisor 和node-exporter等 ...
随机推荐
- jQuery使用(十四):extend()方法
浅层克隆 深层克隆 扩展方法 一.extend的基本使用 语法: $.extend( target [, object1 ] [, objectN ] ) $.extend( [deep ], tar ...
- jQuery使用(十二):工具方法之type()之类型判断
type()的使用 类型判断方法之is...() 实现原理可以参考我的另一篇js源码剖析博客: 类型和原生函数及类型转换(二:终结js类型判断) $.type( undefined ) === &qu ...
- NOI-OJ 1.13 ID:23 区间内的真素数
整体思路 这里需要大量使用素数,必须能够想到只求出M到N之间的素数是不够的,因为M到N之间数字的反序有可能是大于M或小于N的数字,例如M=2,N=20,那么19的反序91大于20,所以使用埃拉拖色尼算 ...
- 第十九节: 结合【表达式目录树】来封装EF的BaseDal层的方法
一. 简介 该章节,可以说是一个简单轻松的章节,只要你对Expression表达式树.EF的基本使用.泛型有所了解,那么本章节实质上就是一个非常简单的封装章节,便于我们快捷开发. PS:在该章节对于E ...
- v-charts 和 websocket实现数据展示动态推送
v-charts https://v-charts.js.org/#/ ELEMENT力作: 在使用 echarts 生成图表时,经常需要做繁琐的数据类型转化.修改复杂的配置项,v-charts 的出 ...
- Pandas时间处理的一些小方法
一.以下有两种方式可以创建一个Timestamp对象: 1. Timestamp()的构造方法 import pandas as pd from datetime import datetime as ...
- 【vue】路由配置
一般组件我们会有全屏组件,或是在页面的某个部分显示组件,所以路由的第一层一般是全屏显示的,而在/目录下的组件为页面的某个部分显示的,通常需求是这样的,登录是全屏显示的,而普通页面是在页面的某个部分进行 ...
- Django 反向解析
#1,定义: #随着功能的增加会出现更多的视图,可能之前配置的正则表达式不够准确,于是就要修改正则表达式,但是正则表达式一旦修改了,之前所有对应的超链接都要修改,真是一件麻烦的事情,而且可能还会漏掉一 ...
- Linux找回root密码
Linux忘记root密码时,密码重置步骤: 1.将虚拟机重启: 2.当进入GRUB倒计时界面,点击键盘e键: 3.点击键盘上下键选择第二行(kernel /vmlinuz-2.6.32-71.29. ...
- Axis接口
Axis支持三种web service的部署和开发,分别为: 1.Dynamic Invocation Interface ( DII) 2.Dynamic Proxy方式 3.Stubs方式Dyna ...