数据仓库专题(21):Kimball总线矩阵说明-官方版
一、前言
Over the years, I have found that a matrix depiction of the data warehouse plan is a pretty good planning tool once you have gathered the business requirements and performed a full data audit. This matrix approach has been exceptionally effective for distributed data warehouses without a center. Most of the new Web-oriented, multiple organization warehouses we are trying to build these days have no center, so it is even more urgent that we find a way to plan these beasts.
二、一级数据集市(First-level data marts)
The matrix is simply a vertical list of data marts and a horizontal list of dimensions. Figure 1 is an example matrix for the enterprise data warehouse of a large telecommunications company. You start the matrix by listing all the first-level data marts that you could possibly build over the next three years across the enterprise. A first-level data mart is a collection of related fact tables and dimension tables that is typically:
- Derived from a single data source
- Supported and implemented by a single department
- Based on the most atomic data possible to collect from the source
- Conformed to the “data warehouse bus.”
First-level data marts should be the smallest and least risky initial implementations of an enterprise data warehouse. They form a foundation on which a larger implementation can be brought to completion in the least amount of time, but that are still guaranteed to contribute to the final result without being incompatible stovepipes.
You should try to reduce the risk of implementation as much as possible by basing the first-level data marts on single production sources. In my experience, the cost and complexity of data warehouse implementation, once the “right” data has been chosen, turns out to be proportional to the number of data sources that must be extracted. Each separate data source can be as much as a six-month programming and testing exercise. You must create a production data pipeline from the legacy source through the data staging area and on to the fact and dimension tables of the presentation part of the data warehouse.
In Figure 1, the first-level data marts for the telecommunications company are many of the major production data sources. An obvious production data source is the customer billing system, listed first. This row in the matrix is meant to represent all the base-level fact tables you expect to build in this data mart. Assume this data mart contains one major base-level fact table, the grain of which is the individual line item on a customer bill. Assume the line item on the bill represents the class of service provided, not the individual telephone call within the class of service. With these assumptions, you can check off the dimensions this fact table needs. For customer bills, you need Time, Customer, Service, Rate Category, Local Service Provider, Long Distance Provider, Location, and Account Status.
Continue to develop the matrix rows by listing all the possible first-level data marts that could be developed in the next three years, based on known, existing data sources. Sometimes I am asked to include a first-level data mart based on a production system that does not yet exist. I usually decline the offer. I try to avoid including “potential” data sources, unless there is a very specific design and implementation plan in place. Another dangerously idealistic data source is the grand corporate data model, which usually takes up a whole wall of the IT department. Most of this data model cannot be used as a data source because it is not real. Ask the corporate data architect to highlight with a red pen the tables on the corporate data model that are currently populated with real data. These red tables are legitimate drivers of data marts in the planning matrix and can be used as sources.
The planning matrix columns indicate all the dimensions a data mart might need. A real enterprise data warehouse contains more dimensions than those in Figure 1. It is often helpful to attempt a comprehensive list of dimensions before filling in the matrix. When you start with a large list of dimensions, it becomes a kind of creative exercise to ask whether a given dimension could possibly be associated with a data mart. This activity could suggest interesting ways to add dimensional data sources to existing fact tables. If you study the details of Figure 1, you may decide that more X’s should be filled in, or that some significant dimensions should be added. If so, more power to you! You are using the matrix as it was intended.
Inviting Data Mart Groups to the Conforming Meeting
Looking across the rows of the matrix is revealing. You can see the full dimensionality of each data mart at a glance. Dimensions can be tested for inclusion or exclusion. But the real power of the matrix comes from looking at the columns. A column in the matrix is a map of where the dimension is required.
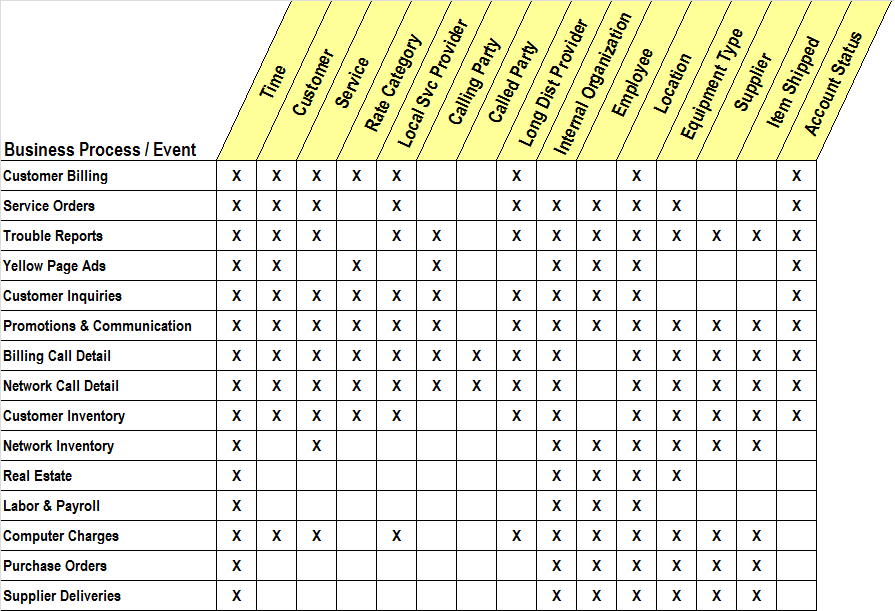
FIGURE 1 The Matrix Plan for the enterprise data warehouse of a large telecommunications company.
The first dimension, Time, is required in every data mart. Every data mart is a time series. But even the Time dimension requires some thought. When a dimension is used in multiple data marts, it must be conformed. Conformed dimensions are the basis for distributed data warehouses, and using conformed dimensions is the way to avoid stovepipe data marts. A dimension is conformed when two copies of the dimensions are either exactly the same (including the values of the keys and all the attributes), or else one dimension is a perfect subset of the other. So using the Time dimension in all the data marts implies that the data mart teams agree on a corporate calendar. All the data mart teams must use this calendar and agree on fiscal periods, holidays, and workdays.
The grain of the conformed Time dimension needs to be consistent as well. An obvious source of stovepipe data marts is the reckless use of incompatible weeks and months across the data marts. Get rid of awkward time spans such as quad weeks or 4-4-5-week quarters.
The second dimension in Figure 1, Customer, is even more interesting than Time. Developing a standard definition for “customer” is one of the most important steps in combining separate sources of data from around the enterprise. The willingness to seek a common definition of the customer is a major litmus test for an organization intending to build an enterprise data warehouse. Roughly speaking, if an organization is unwilling to agree on a common definition of the customer across all data marts, the organization should not attempt to build a data warehouse that spans these data marts. The data marts should remain separate forever.
For these reasons, you can think of the planning matrix columns as the invitation list to the conforming meeting! The planning matrix reveals the interaction between the data marts and the dimensions.
Communicating With the Boss
The planning matrix is a good communication vehicle for senior management. It is simple and direct. Even if the executive does not know much about the technical details of the data warehouse, the planning matrix sends the message that standard definitions of calendars, customers, and products must be defined, or the enterprise won’t be able to use its data.
A meeting to conform a dimension is probably more political than technical. The data warehouse project leader does not need to be the sole force for conforming a dimension such as Customer. A senior manager such as the enterprise CIO should be willing to appear at the conforming meeting and make it clear how important the task of conforming the dimension is. This political support is very important. It gets the data warehouse project manager off the hook and puts the burden of the decision making process on senior management’s shoulders, where it belongs.
三、二级数据集市(Second-Level Data Marts)
After you have represented all the major production sources in the enterprise with first-level data marts, you can define one or more second-level marts. A second-level data mart is a combination of two or more first-level marts. In most cases, a second-level mart is more than a simple union of data sets from the first-level marts. For example, a second-level profitability mart may result from a complex allocation process that associates costs from several first-level cost-oriented data marts onto products and customers contained in a first-level revenue mart. I discussed the issues of creating these kinds of profitability data marts in my column, “Not so Fast.”
四、总结
The matrix planning technique helps you build an enterprise data warehouse, especially when the warehouse is a distributed combination of far-flung data marts. The matrix becomes a resource that is part technical tool, part project management tool, and part communication vehicle to senior management.
数据仓库专题(21):Kimball总线矩阵说明-官方版的更多相关文章
- 数据仓库专题(2)-Kimball维度建模四步骤
一.前言 四步过程维度建模由Kimball提出,可以做为业务梳理.数据梳理后进行多维数据模型设计的指导流程,但是不能作为数据仓库系统建设的指导流程.本文就相关流程及核心问题进行解读. 二.数据仓库建设 ...
- FocusBI: 总线矩阵(原创)
关注微信公众号:FocusBI 查看更多文章:加QQ群:808774277 获取学习资料和一起探讨问题. <商业智能教程>pdf下载地址 链接:https://pan.baidu.com/ ...
- php面试专题---21、MVC框架基本工作原理考察点
php面试专题---21.MVC框架基本工作原理考察点 一.总结 一句话总结: 会的东西快速过,不要浪费时间,生命有限,都是一些很简单的东西. 1.mvc框架单一入口的 优势 是什么? 可以进行统一的 ...
- Spring Cloud(九):配置中心(消息总线)【Finchley 版】
Spring Cloud(九):配置中心(消息总线)[Finchley 版] 发表于 2018-04-19 | 更新于 2018-05-07 | 我们在 Spring Cloud(七):配置中心 ...
- Tensorflow 官方版教程中文版
2015年11月9日,Google发布人工智能系统TensorFlow并宣布开源,同日,极客学院组织在线TensorFlow中文文档翻译.一个月后,30章文档全部翻译校对完成,上线并提供电子书下载,该 ...
- APP设计尺寸规范大全,APP界面设计新手教程【官方版】(转)
正值25学堂一周年之际,同时站长和APP设计同仁们在群里(APP界面设计 UI设计交流群,APP界面设计⑥群 APPUI设计③群58946771 APP设计资源⑤群 386032923欢迎大家加入交流 ...
- Oracle官方版Entity Framework
千呼萬喚始出來! Oracle官方版Entity Framework問市,邁入開發新時代 自從我得了一種"不用LINQ就不會寫資料庫程式"的病,為了滿足工作上要搭配Oracle(雖 ...
- Filemon(Filemon文件系统监视)V7.04官方版
软件名称:Filemon(Filemon文件系统监视)V7.04官方版 软件语言: 简体中文 授权方式: 免费软件 运行环境: Win 32位/64位 软件大小: 265KB 图片预览: 软件简介: ...
- AospExtended K3 Note最新官方版 Android7.1.2 极速 省电 流畅 Galaxy XIAOMI Moto Lenovo Coolpad 均支持
AospExtended 最新官方版 Android7.1.2 极速 省电 流畅 Galaxy XIAOMI Moto Lenovo Coolpad 均支持 之前用过1629开发版等,体验了很 ...
随机推荐
- [LeetCode&Python] Problem 21. Merge Two Sorted Lists
Merge two sorted linked lists and return it as a new list. The new list should be made by splicing t ...
- 初学html的单词笔记
font-size: 文字大小color: 顏色solid: 边框线text-align: 間距center: 文字放在中間<head> 网页头部<title> 网页标题< ...
- const 和let的本质区别
在let和const之间,建议优先使用const,尤其是在全局环境,不应该设置变量,只应设置常量. const优于let有几个原因.一个是const可以提醒阅读程序的人,这个变量不应该改变:另一个是c ...
- nginx根据url中的参数进行转发
在实际项目中,由于https安全策略,我们无法直接跳转到我们想要跳转到的地址 例如 url:https://abc.dc.com/image?url=https://vpic.video.qq.com ...
- rest-framework之频率控制
rest-framework之频率控制 本文目录 一 频率简介 二 自定义频率类,自定义频率规则 三 内置频率类及局部使用 四 内置频率类及全局使用 五 源码分析 回到目录 一 频率简介 为了控制用户 ...
- LG4071 [SDOI2016]排列计数
题意 题目描述 求有多少种长度为 n 的序列 A,满足以下条件: 1 ~ n 这 n 个数在序列中各出现了一次 若第 i 个数 A[i] 的值为 i,则称 i 是稳定的.序列恰好有 m 个数是稳定的 ...
- 写一个简单脚本检测mysql主从是否正常
这个脚本是在从服务器上执行的 [root@bogon ~]# cat a.sh #!/bin/bash #下面这行目的在于检测mysql端口是否开启,如果没有开启,那说明mysql服务都没有开启,直接 ...
- nginx unit nodejs 模块试用(续)
最新(应该是18 年了)nginx unit 发布了新的版本,对于nodejs 的支持有很大的改进,上次测试过,问题还是 比较多,这次使用新版本在测试下对于nodejs 的支持,以及以前block ...
- 套接字选项——getsockopt和setsockopt
这两个函数仅用于套接字 #include <sys/socket.h> int getsockopt(int sock, int level, int optname, void *opt ...
- day 33 什么是线程? 两种创建方式. 守护线程. 锁. 死锁现象. 递归锁. GIL锁
一.线程 1.进程:资源的分配单位 线程:cpu执行单位(实体) 2.线程的创建和销毁开销特别小 3.线程之间资源共享,共享的是同一个进程中的资源 4.线程之间不是隔离的 5.线程可不需 ...