matplotlib散点图
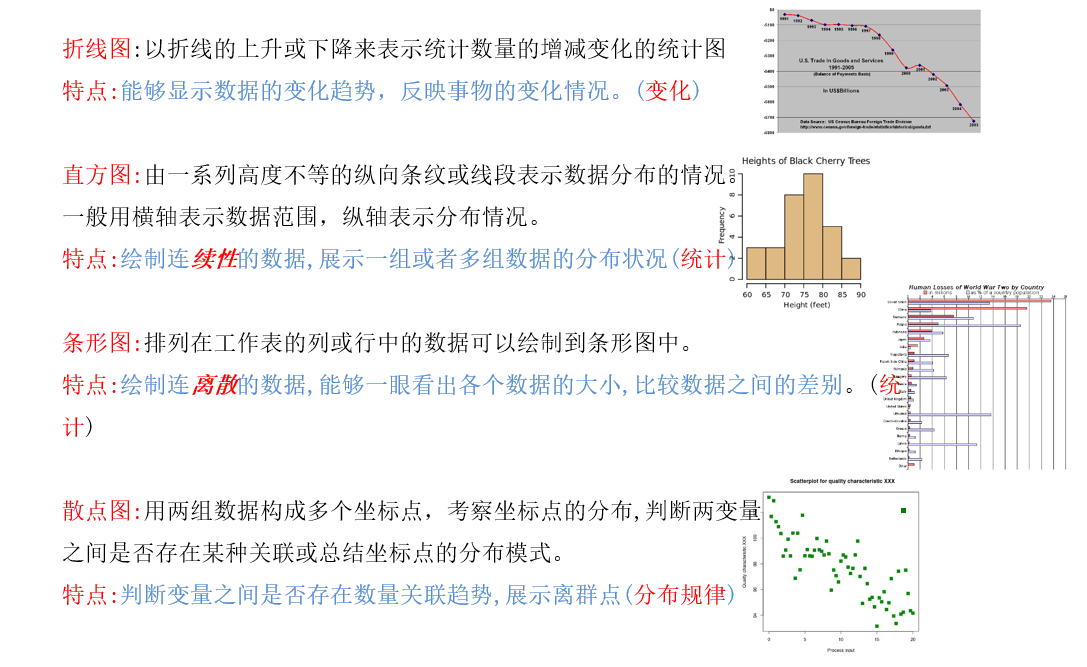
我们常用的统计图如下:
1、学会绘制散点图
一个小demo:
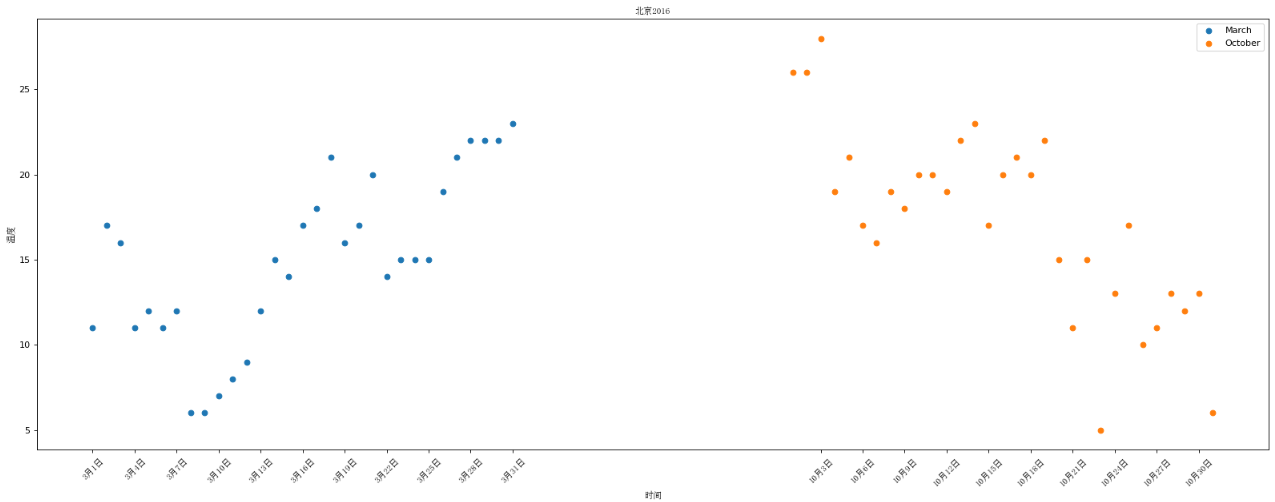
假设通过爬虫你获取到了北京2016年3,10月份每天白天的最高气温(分别位于列表a,b),那么此时如何寻找出气温和随时间(天)变化的某种规律?
a = [11,17,16,11,12,11,12,6,6,7,8,9,12,15,14,17,18,21,16,17,20,14,15,15,15,19,21,22,22,22,23]
b = [26,26,28,19,21,17,16,19,18,20,20,19,22,23,17,20,21,20,22,15,11,15,5,13,17,10,11,13,12,13,6]
数据来源: http://lishi.tianqi.com/beijing/index.html
import matplotlib.pyplot as plt

# 3月份

y_3 = [11, 17, 16, 11, 12, 11, 12, 6, 6, 7, 8, 9, 12, 15, 14, 17, 18, 21, 16, 17, 20,

       14, 15, 15, 15, 19, 21, 22, 22, 22, 23]

x_3 = range(1, 32)

# 10月份

y_10 = [26, 26, 28, 19, 21, 17, 16, 19, 18, 20, 20, 19, 22, 23, 17,

        20, 21, 20, 22, 15, 11, 15, 5, 13, 17, 10, 11, 13, 12, 13, 6]

x_10 = range(51, 82)

# 设置图形大小

plt.figure(figsize=(20, 8), dpi=80)

# 使用scatter绘制散点图

plt.scatter(x_3, y_3, label="March")

plt.scatter(x_10, y_10, label="October")

# 调整x轴

x = list(x_3)+list(x_10)

_xtick_label = ["3月{}日".format(i) for i in x_3]

_xtick_label += ["10月{}日".format(i-50) for i in x_10]

plt.xticks(x[::3], _xtick_label[::3], fontproperties="SimSun", rotation=45)

# 添加描述信息

plt.xlabel("时间", fontproperties="SimSun")

plt.ylabel("温度", fontproperties="SimSun")

plt.title("北京2016", fontproperties="SimSun")

# 添加图例

plt.legend()

# 展示

plt.show()
使用散点图的场景:
- 不同条件(维度)之间的内在关联关系
- 观察数据的离散聚合程度
matplotlib散点图的更多相关文章
- matplotlib 散点图scatter
最近开始学习python编程,遇到scatter函数,感觉里面的参数不知道什么意思于是查资料,最后总结如下: 1.scatter函数原型 2.其中散点的形状参数marker如下: 3.其中颜色参数c如 ...
- matplotlib散点图笔记
定义: 由一组不连续的点完成的图形 散点图: 包含正相关性,负相关性和不相关性. 散点图生成函数: plt.scatter(x,y) 演示代码如下: import numpy as np import ...
- Matplotlib散点图、条形图、直方图-02
对比常用统计图 折线图: 特点:能够显示数据的变化趋势,反映事物的变化情况.(变化) 直方图: 特点:绘制连续性的数据,展示一组或者多组数据的分布情况(统计) 条形图: 特点:绘制离散的数据,能够一眼 ...
- Python 绘图与可视化 matplotlib 散点图、numpy模块的random()
效果: 代码: def scatter_curve(): # plt.subplot(1,1,1) n=1024 X=np.random.normal(0,1,n) Y=np.random.norma ...
- matplotlib 散点图
一.特点 离散的数据,查看分布规律,走向趋势 二.使用 1.核心 plt.scatter(x, y) # x为x轴的数据,可迭代对象,必须是数字 # y为y轴的数据,可迭代对象,必须是数字 # x和y ...
- Matplotlib 饼图
章节 Matplotlib 安装 Matplotlib 入门 Matplotlib 基本概念 Matplotlib 图形绘制 Matplotlib 多个图形 Matplotlib 其他类型图形 Mat ...
- Matplotlib 多个图形
章节 Matplotlib 安装 Matplotlib 入门 Matplotlib 基本概念 Matplotlib 图形绘制 Matplotlib 多个图形 Matplotlib 其他类型图形 Mat ...
- Matplotlib 图形绘制
章节 Matplotlib 安装 Matplotlib 入门 Matplotlib 基本概念 Matplotlib 图形绘制 Matplotlib 多个图形 Matplotlib 其他类型图形 Mat ...
- Matplotlib 安装
章节 Matplotlib 安装 Matplotlib 入门 Matplotlib 基本概念 Matplotlib 图形绘制 Matplotlib 多个图形 Matplotlib 其他类型图形 Mat ...
随机推荐
- RocketMQ详解(三)启动运行原理
专题目录 RocketMQ详解(一)原理概览 RocketMQ详解(二)安装使用详解 RocketMQ详解(三)启动运行原理 RocketMQ详解(四)核心设计原理 RocketMQ详解(五)总结提高 ...
- CodeForce-808C Tea Party(结构体排序贪心)
Tea Party CodeForces - 808C 现在有 n 个杯子,每个杯子的容量为 a1, a2, ..., an.他现在一共有 w 毫升茶 (w ≤ a1 + a2 + ... + an) ...
- Java基础系列(7)- 标识符和关键字
关键字 标识符 Java所有的组成部分都需要名字.类名.变量名.方法名都称为标识符 首字母以字母(A-Z或者a-z),美元符号($),或者下划线(_)开头 首字母之后可以用字母.美元符号.下划线.数字 ...
- Jmeter系列(6)- 分析源码,创建登录、浏览商品接口请求
前言简介 接口的压力测试有个二八原则:线上80%的用户量在一天24小时20%(即4.8个小时)的时间里可以平稳运行,这个接口就算是通过压力测试了 源码分析 登录 浏览商品 创建请求 登录 浏览菜单 C ...
- Jmeter系列(2)- 代理服务器录制脚本
操作步骤 step-1 添加代理服务器 step-2 添加线程组 step-3 添加录制控制器 HTTP代理服务器配置 - HTTP(S) Test Script Recorder TestPlan ...
- Spring Cloud Gateway 没有链路信息,我 TM 人傻了(上)
本系列是 我TM人傻了 系列第五期[捂脸],往期精彩回顾: 升级到Spring 5.3.x之后,GC次数急剧增加,我TM人傻了 这个大表走索引字段查询的 SQL 怎么就成全扫描了,我TM人傻了 获取异 ...
- 使用uView UI+UniApp开发微信小程序--微信授权绑定和一键登录系统
在前面随笔<使用uView UI+UniApp开发微信小程序>和<使用uView UI+UniApp开发微信小程序--判断用户是否登录并跳转>介绍了微信小程序的常规登录处理和验 ...
- win10系统移动热点使用技巧
win10系统是自动移动热点功能,在平时测试的时候,有时需要进行手机抓包,需要手机和电脑处于同一网络当中,这时可以开启热点使用. 如何开启移动热点? 直接搜索"移动热点" 但是如果 ...
- GUI自动化测试遇到的问题
学习接口自动化测试框架或工具,UI自动化测试框架或工具,有时会觉得知识似乎比较零散,死记硬背不是一个好方法.一个学习的思路是思考使用这些框架或工具的时候,可能会遇到什么问题,遇到这些问题可以通过什么方 ...
- 我的Python学习记录
Python日期时间处理:time模块.datetime模块 Python提供了两个标准日期时间处理模块:--time.datetime模块. 那么,这两个模块的功能有什么相同和共同之处呢? 一般来说 ...