
020-Spring Boot 监控和度量
一、概述
通过配置使用actuator查看监控和度量信息
二、使用
2.1、建立web项目,增加pom
        <dependency>

            <groupId>org.springframework.boot</groupId>

            <artifactId>spring-boot-starter-web</artifactId>

        </dependency>
启动项目,查看日志,发现能够访问地址如下

2.2、增加actuator的pom依赖
        <dependency>

            <groupId>org.springframework.boot</groupId>

            <artifactId>spring-boot-actuator</artifactId>

        </dependency>
启动项目,查看日志,发现能够访问地址如下
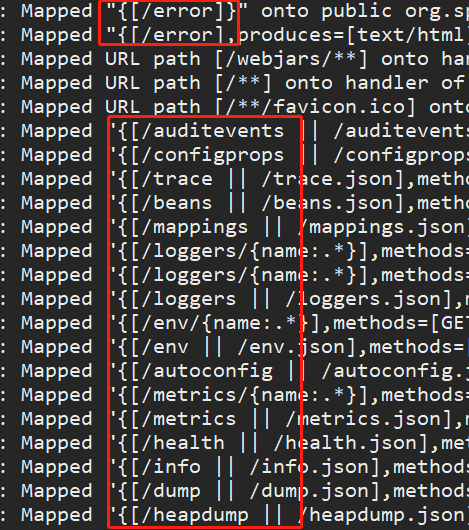
可以看到,可访问地址增加了
三、详解
建议安装jsonview插件方便查看json
3.1、增加配置
关闭权限限制,application.properties
management.security.enabled=false
除开health接口还依赖endpoints.health.sensitive的配置外,其他接口都不需要输入用户名和密码。
3.2、访问以下网址
Spring Boot Actuator 的关键特性是在应用程序里提供众多 Web 接口,通过它们了解应用程序运行时的内部状况。Actuator 提供了如下接口,可以分为三大类:配置接口、度量接口和其它接口,具体如下表所示。
| HTTP方法 | 路径 | 描述 | 鉴权 | |
|---|---|---|---|---|
| GET | /auditevents | 审计事件 | true | |
| GET | /autoconfig | 配置 |
查看自动配置的使用情况 提供了一份自动配置报告,记录哪些自动配置条件通过了,哪些没通过 |
true |
| GET | /configprops | 配置 |
查看配置属性,包括默认配置 描述配置属性(包含默认值)如何注入Bean |
true |
| GET | /beans | 配置 |
查看bean及其关系列表 描述应用程序上下文里全部的Bean,以及它们的关系 |
true |
| GET | /dump | 打印线程栈,获取线程活动的快照 | true | |
| GET | /env | 配置 | 查看所有环境变量 | true |
| GET | /env/{name} | 配置 | 根据名称获取特定的环境属性值 | true |
| GET | /health | 配置 |
查看应用健康指标,这些值由HealthIndicator的实现类提供 包括:Cassandra、Composite、Couchbase、DataSource、DiskSpace、 Elasticsearch、Jms、Ldap、Mail、Mongo、Ordered、Rabbit、Redis、solr |
false |
| GET | /heapdump | true | ||
| GET | /info | 配置 | 查看应用信息,这些信息由info打头的属性提供 | false |
| GET | /loggers | true | ||
| GET | /loggers/{name} | true | ||
| POST | /loggers/{name} | true | ||
| GET | /mappings | 查看所有url映射,以及它们和控制器(包含Actuator端点)的映射关系 | true | |
| GET | /metrics | 度量 | 报告各种应用程序度量信息,比如内存用量和HTTP请求计数 | true |
| GET | /metrics/{name} | 度量 | 报告指定名称的应用程序度量值 | true |
| POST | /shutdown | 关闭应用,要求endpoints.shutdown.enabled设置为true | true | |
| GET | /trace | 查看基本追踪信息,提供基本的HTTP请求跟踪信息(时间戳、HTTP头等) | true |
3.3、源码查看
在spring-boot-actuator-1.5.9.RELEASE.jar包中org.springframework.boot.actuate.endpoint下,查看具体类实现,
可以设置某一项是否显示
endpoints.beans.enabled=false
查看代码这里的endpoints,均继承自AbstractEndpoint,其中AbstractEndpoint含有属性如下
sensitive 敏感信息

enabled  启用
3.3.1、org.springframework.boot.actuate.health
除原有支持的健康检查外,还支持扩展。HealthIndicator
步骤:
1》实现HealthIndicator接口,实现逻辑,纳入spring容器管理中
@Component

public class MyHealthIndicator implements HealthIndicator {

    @Override

    public Health health() {

        //return Health.down().withDetail("error", "spring test error").build();

        return Health.up().withDetail("success", "spring test success").build();

    }

}
actuator暴露的health接口权限是由两个配置: management.security.enabled 和 endpoints.health.sensitive组合的结果进行返回的。
| management.security.enabled | endpoints.health.sensitive | Unauthenticated | Authenticated |
|---|---|---|---|
| false | false | Full content | Full content |
| false | true | Status only | Full content |
| true | false | Status only | Full content |
| true | true | No content | Full content |
3.3.2、info
在所有加载的配置文件中以info开头的配置,均可以显示在这里,如
info.name=myinfo

info.version=1.0.0

info.datasource.url=jdbc:mysql://127.0.0.1:3306/springboot
同时也会显示git信息git.properties
git.branch=master
显示如下
{

  datasource: {

    url: "jdbc:mysql://127.0.0.1:3306/springboot",

    name: "root",

    password: "root",

    driverClassName: "com.mysql.jdbc.Driver"

  },

  name: "myinfo",

  version: "1.0.0",

  git: {

    branch: "master"

  }

}
3.3.3、metrics查看度量信息
CounterService:计数服务,可以直接使用
如查看上文中的user/home访问次数
    @Autowired

    private CounterService counterService;//引入

    @GetMapping("/user/home")

    public String home(@RequestParam("error") String error) {

        counterService.increment("user.home.request.count");//埋点

        if(error.equals("test")) {

            throw new NullPointerException();

        }

        return "home";

    }
此时查看即可:http://127.0.0.1:8080/metrics
GaugeService:用来统计某个值,查看某个监控点的值
    @Autowired

    private GaugeService gaugeService;

    @GetMapping("/user/create")

    public String create(int age) {

        gaugeService.submit("user.create.age", age);

        return "create";

    }
此时查看即可:http://127.0.0.1:8080/metrics
3.3.4、监控信息输出其他位置
1》添加配置类,如下
@Configuration

public class ExportConfiguration {

    @Bean

    @ExportMetricWriter

    public MetricWriter createMetricWriter(MBeanExporter exporter) {

        return new JmxMetricWriter(exporter);

    }

}
查看MetricWriter 支持如下几种,也可自行定义
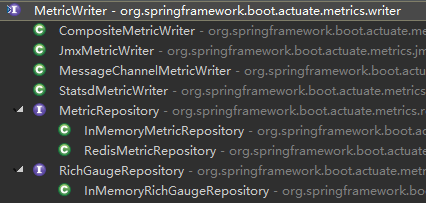
这里使用了Jmx,
3.4、安全方式验证
1》增加security的pom
        <dependency>

            <groupId>org.springframework.boot</groupId>

            <artifactId>spring-boot-starter-security</artifactId>

        </dependency>
配置文件设置
security.basic.enabled=true

security.user.name=admin

security.user.password=password
综合以上可作如下配置:
security.basic.enabled=true

security.basic.path=/admin    #针对/admin路径进行认证

security.user.name=admin     #认证使用的用户名

security.user.password=password   #认证使用的密码

management.security.roles=SUPERUSER

management.port=11111   #actuator暴露接口使用的端口,为了和api接口使用的端口进行分离

management.context-path=/admin   #actuator暴露接口的前缀

management.security.enabled=true   #actuator是否需要安全保证

endpoints.metrics.sensitive=false   #actuator的metrics接口是否需要安全保证

endpoints.metrics.enabled=true

endpoints.health.sensitive=false  #actuator的health接口是否需要安全保证

endpoints.health.enabled=true
四、JDK工具使用
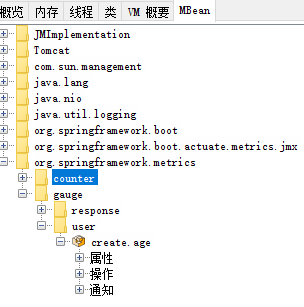
查看Jmx方式JDK有三种在bin下,jConsole、jmc、jvisualVM
JConsole方式
Jvisualvm方式
注意jvisualvm默认不支持MBEAn,Jconsole等需要自己安装插件,在 工具→插件中安装插件

jmc方式
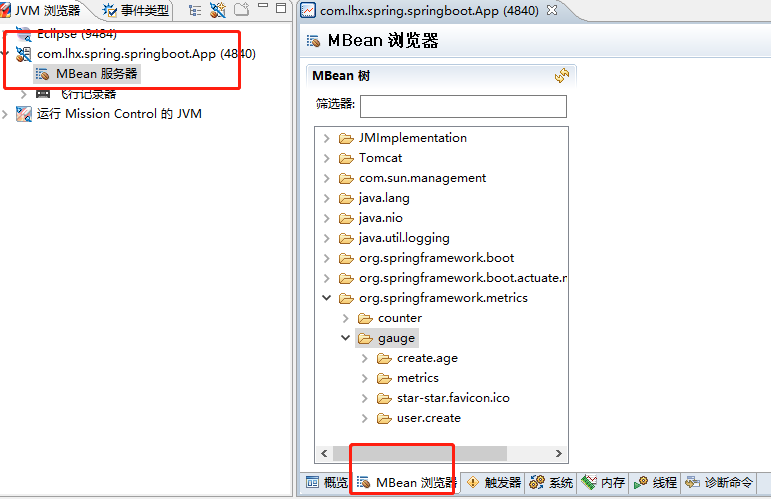
注意:这三种工具不仅仅能查看Mbean,其他信息也能查看,和页面内容查看一致。
与上面配置的JMX没有关系,配置jmx只是增加了MetricWriter 项
020-Spring Boot 监控和度量的更多相关文章
- 笔记:Spring Boot 监控与管理
在微服务架构中,我们将原本庞大的单体系统拆分为多个提供不同服务的应用,虽然,各个应用的内部逻辑因分解而简化,但由于部署的应用数量成倍增长,使得系统的维护复杂度大大提升,为了让运维系统能够获取各个为服务 ...
- Spring Boot监控与管理的实现
认识Actuator 在SpringBoot应用中引入spring-boot-starter-actuator依赖,它可以为开发团队提供系统运行的各项监控指标. 在项目中引入依赖配置如下: appli ...
- Spring Boot 监控与管理
在微服务架构中,我们将原本庞大的单体系统拆分为多个提供不同服务的应用,虽然,各个应用的内部逻辑因分解而简化,但由于部署的应用数量成倍增长,使得系统的维护复杂度大大提升,为了让运维系统能够获取各个为服务 ...
- Spring Boot 监控利器 —— Actutor
参考 CSDN-学习Spring Boot:(二十七)Spring Boot 2.0 中使用 Actuator 使用Actuator监控Spring Boot应用 程序猿DD-Spring Boot ...
- spring boot监控--actuator
原文地址:http://blog.csdn.net/wh_ouyangshuang/article/details/48048111 spring-boot-actuator模块提供了一个监控和管理生 ...
- (33)Spring Boot 监控和管理生产环境【从零开始学Spring Boot】
[本文章是否对你有用以及是否有好的建议,请留言] spring-boot-actuator模块提供了一个监控和管理生产环境的模块,可以使用http.jmx.ssh.telnet等拉管理和监控应用.审计 ...
- Spring Boot|监控-Actuator
Spring Boot 为我们提供了一个生产级特性-Actuator,包含很多实际有用的API,下面我们就一起来看看这些API. 一.Actuator 首先在程序中引入Actuator <!-- ...
- spring - boot 监控管理模块搭建
Spring-Actuator是Spring-boot对应用监控的集成模块,提供了我们对服务器进行监控的支持,使我们更直观的获取应用程序中加载的应用配置.环境变量.自动化配置报告等. 使用Spring ...
- spring boot 监控与管理(actuator)
Spring POMs 中提供了一个特殊的依赖模块,即spring-boot-starter-actuator,我们只需要在我们的POM中添加依赖即可 <!-- 监控 管理 --> < ...
随机推荐
- Android 四大组件学习之BroadcastReceiver二
上节学习了怎样创建一个广播.也尝试接受系统打电话的广播. 本节课学习怎样自己定义广播.自己定义广播实质上也就是创建一个发送广播者,创建一个接受该广播者. 那我们就開始行动吧. 先创建一个发送广播的应用 ...
- hdu5305Friends dfs
//给一个无向图 , 每条边能够是online边也能够是offline边,问 //有多少种方法使得每一个节点的online边和offline边一样多 #include<cstdio> #i ...
- AJAX动态加载评论
<!doctype html> <html lang="en"> <head> <meta charset="UTF-8&quo ...
- CentOS统的7个运行级别的含义
原文: http://blog.csdn.net/liansehai/article/details/45370965 CentOS系统有7个运行级别(runlevel) 运行级别就是操作系统当前正在 ...
- Databinding在自定义ViewGroup中如何绑定view
首先我们在平时开发中使用databinding的时候大部分都是在Activity或者fragment中,但我们一旦在自定义ViewGroup中使用的时候就会出现问题 问题描述: 我们在自定义Linea ...
- 【转】在Eclipse中使用JUnit4进行单元测试(初级篇)
http://www.builder.com.cn/2007/0901/482336.shtml 首先,我们来一个傻瓜式速成教程,不要问为什么,Follow Me,先来体验一下单元测试的快感! 首先新 ...
- Spring MVC下拉选项(Select)
以下示例显示如何在使用Spring Web MVC框架的表单中使用下拉选项(Dropdown).首先使用Eclipse IDE来创建一个WEB工程,实现一个让用户可选择自己所在的国家的功能.并按照以下 ...
- php 打印debug日志
A lesser known trick is that mod_php maps stderr to the Apache log. And, there is a stream for that, ...
- MySQL设计之三范式
网上查找了一些资料,记录如下并加入自己的理解. 设计关系数据库时,遵从不同的规范要求,设计出合理的关系型数据库,这些不同的规范要求被称为不同的范式,各种范式呈递次规范,越高的范式数据库冗余越小.但是有 ...
- How to convert BigDecimal to Double in spring-data-mongodb framework
问题描述:我们都知道对于涉及钱的数据必须使用BigDecimal类型进行存储,今天在查询mongo时仍然有精度问题,虽然我在代码中使用了Big Decimal类型,但mongo中使用的是double类 ...