一款天气app的温度曲线图的实现
最近在开发一款天气app,有一个功能是显示当天24小时每三个小时的气温状况,这个功能无疑要用图表来实现最好了。所以在github上找到一个国人开发的图表库,XCL-Charts。
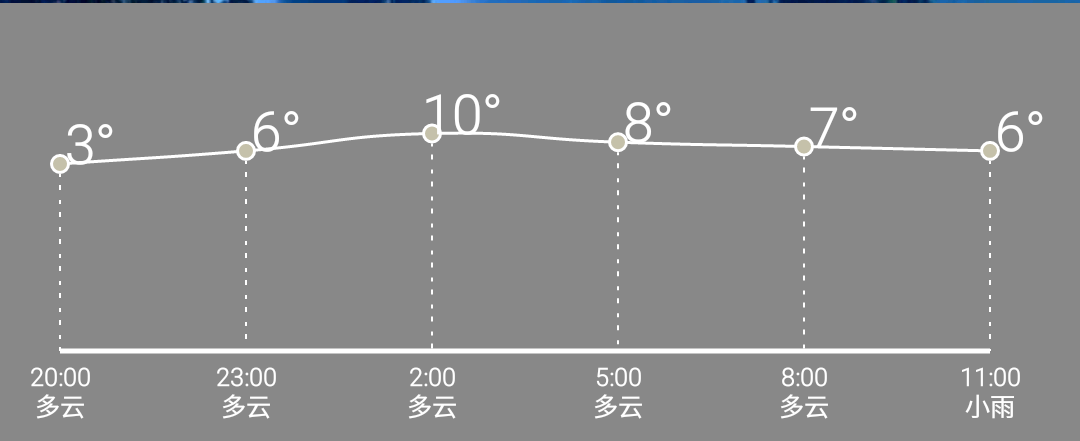
先上效果图:
首先创建一个SplineChartView继承自GraphicalView,再主要实现三个方法
第一个是关于图表的渲染
private void chartRender()
{
try {
        //设置绘图区默认缩进px值,留置空间显示Axis,Axistitle....

        int [] ltrb = getBarLnDefaultSpadding();

        chart.setPadding(ltrb[0] + DensityUtil.dip2px(this.getContext(), 20), ltrb[1],

                    ltrb[2]+DensityUtil.dip2px(this.getContext(), 30), ltrb[3]);

        //显示边框

        chart.showRoundBorder();

        //数据源

        chart.setCategories(labels);

        chart.setDataSource(chartData);

    //  chart.setCustomLines(mCustomLineDataset);

        //坐标系

        //数据轴最大值

        chart.getDataAxis().setAxisMax(40);

        chart.getDataAxis().setAxisMin(-40);

        //数据轴刻度间隔

        chart.getDataAxis().setAxisSteps(2);

        //标签轴最大值

        chart.setCategoryAxisMax(5);

        //标签轴最小值

        chart.setCategoryAxisMin(0);

        //背景网格

        PlotGrid plot = chart.getPlotGrid();

        plot.hideHorizontalLines();

        plot.hideVerticalLines();

        chart.getPlotArea().setBackgroundColor(true, Color.GRAY);

        chart.getCategoryAxis().getAxisPaint().setColor(Color.WHITE);

        chart.getCategoryAxis().getAxisPaint().setTextSize(6);

        chart.getCategoryAxis().hideTickMarks();

        chart.getCategoryAxis().getTickLabelPaint().setColor(Color.WHITE);

        chart.getCategoryAxis().getTickLabelPaint().setFakeBoldText(true);

        chart.getCategoryAxis().setTickLabelMargin(25);

        chart.getCategoryAxis().getTickLabelPaint().setTextSize(25);

        //不使用精确计算,忽略Java计算误差,提高性能

        chart.disableHighPrecision();

        chart.disablePanMode();

        chart.hideBorder();

        chart.getPlotLegend().hide();

        chart.getDataAxis().hide();

    } catch (Exception e) {

        // TODO Auto-generated catch block

        e.printStackTrace();

        Log.e("tag", e.toString());

    }

}
其中chart.getPlotArea().setBackgroundColor(true, Color.GRAY);是设置图表绘制区的颜色,chart.getDataAxis().setAxisMax(40);在我的app中表示能显示的最高温度是40摄氏度,chart.getDataAxis().setAxisMin(-40);表示能显示的最低温度是-40摄氏度。
第二个和第三个都是绑定数据的。
public void setChartDataSet(List temps)
{
//线1的数据集
List linePoint1 = new ArrayList();
linePoint1.add(new PointD(0d, Double.parseDouble(temps.get(0))));
linePoint1.add(new PointD(1d, Double.parseDouble(temps.get(1))));
linePoint1.add(new PointD(2d, Double.parseDouble(temps.get(2))));
linePoint1.add(new PointD(3d, Double.parseDouble(temps.get(3))));
linePoint1.add(new PointD(4d, Double.parseDouble(temps.get(4))));
linePoint1.add(new PointD(5d, Double.parseDouble(temps.get(5))));
    SplineData dataSeries1 = new SplineData("Go",linePoint1,

            Color.WHITE );

    //把线弄细点

    dataSeries1.getLinePaint().setStrokeWidth(3);

    dataSeries1.setLineStyle(XEnum.LineStyle.DASH);

    dataSeries1.setLabelVisible(false);

    dataSeries1.setDotStyle(XEnum.DotStyle.RING);

    dataSeries1.getDotPaint().setColor(getResources().getColor(R.color.white));

    dataSeries1.getPlotLine().getPlotDot().setRingInnerColor(getResources().getColor(R.color.grey));

    chartData.add(dataSeries1);

    this.invalidate();

}

public void setChartLabels(List<String> weather){

    String[] times={"20:00\n","23:00\n","2:00\n","5:00\n","8:00\n","11:00\n"};

    for(int i=0;i<weather.size();i++){

        labels.add(times[i]+weather.get(i));

    }

    this.invalidate();

}

由于需要动态添加数据,也就是温度,这里我设置了6个时段的温度,每个时段三个小时。在setChartDataSet方法中添加了参数,dataSeries1.getLinePaint().setStrokeWidth(3);设置了绘制曲线的线宽度,dataSeries1.setLineStyle(XEnum.LineStyle.DASH)设置了曲线的类型。setChartLabels(List<String> weather)设置了横轴坐标表示什么意思,在这里表示时段和天气状态。
第四个是图批注
public void setChartAnchor(List<String> temps){

    //激活点击监听

            chart.ActiveListenItemClick();

            //为了让触发更灵敏,可以扩大5px的点击监听范围

            chart.extPointClickRange(5);

            chart.showClikedFocus();

            //批注

            List<AnchorDataPoint> mAnchorSet = new ArrayList<AnchorDataPoint>();

            AnchorDataPoint an2 = new AnchorDataPoint(0,0,XEnum.AnchorStyle.TOBOTTOM);

            an2.setBgColor(Color.WHITE);

            an2.setLineWidth(15);

            an2.setLineStyle(XEnum.LineStyle.DASH);

            an2.setTextColor(Color.WHITE);

            an2.setTextSize(55);

            an2.setAnchor(temps.get(0));

            AnchorDataPoint an3 = new AnchorDataPoint(0,1,XEnum.AnchorStyle.TOBOTTOM);

            an3.setBgColor(Color.WHITE);

            an3.setLineStyle(XEnum.LineStyle.DASH);

            an3.setTextColor(Color.WHITE);

            an3.setTextSize(55);

            an3.setAnchor(temps.get(1));

            //从点到底的标识线

            //从点到底的标识线

            AnchorDataPoint an4 = new AnchorDataPoint(0,2,XEnum.AnchorStyle.TOBOTTOM);

            an4.setBgColor(Color.WHITE);

            an4.setLineWidth(15);

            an4.setLineStyle(XEnum.LineStyle.DASH);

            an4.setTextColor(Color.WHITE);

            an4.setTextSize(55);

            an4.setAnchor(temps.get(2));

            AnchorDataPoint an5 = new AnchorDataPoint(0,3,XEnum.AnchorStyle.TOBOTTOM);

            an5.setBgColor(Color.WHITE);

            an5.setLineWidth(15);

            an5.setLineStyle(XEnum.LineStyle.DASH);

            an5.setTextColor(Color.WHITE);

            an5.setTextSize(55);

            an5.setAnchor(temps.get(3));

            AnchorDataPoint an6 = new AnchorDataPoint(0,4,XEnum.AnchorStyle.TOBOTTOM);

            an6.setBgColor(Color.WHITE);

            an6.setLineWidth(15);

            an6.setLineStyle(XEnum.LineStyle.DASH);

            an6.setTextColor(Color.WHITE);

            an6.setTextSize(55);

            an6.setAnchor(temps.get(4));

            AnchorDataPoint an7 = new AnchorDataPoint(0,5,XEnum.AnchorStyle.TOBOTTOM);

            an7.setBgColor(Color.WHITE);

            an7.setLineWidth(15);

            an7.setLineStyle(XEnum.LineStyle.DASH);

            an7.setTextColor(Color.WHITE);

            an7.setTextSize(55);

            an7.setAnchor(temps.get(5));

            mAnchorSet.add(an2);

            mAnchorSet.add(an3);

            mAnchorSet.add(an4);

            mAnchorSet.add(an5);

            mAnchorSet.add(an6);

            mAnchorSet.add(an7);

            chart.setAnchorDataPoint(mAnchorSet);

            this.invalidate();

}
an2.setBgColor(Color.WHITE);
an2.setLineWidth(15);
an2.setLineStyle(XEnum.LineStyle.DASH);
an2.setTextColor(Color.WHITE);
an2.setTextSize(55);
an2.setAnchor(temps.get(0));
上面第一行依然是设置背景色为白色,第二行是批注线的宽度,第三行是设置批注线为虚线,第四、五行设置了批注文字的颜色和大小,第六行则是将批注文字绑定到an2上。
附上完整代码
package com.example.springweather.customview;
import java.util.ArrayList;
import java.util.LinkedList;
import java.util.List;
import org.xclcharts.chart.PointD;
import org.xclcharts.chart.SplineChart;
import org.xclcharts.chart.SplineData;
import org.xclcharts.common.DensityUtil;
import org.xclcharts.renderer.XEnum;
import org.xclcharts.renderer.info.AnchorDataPoint;
import org.xclcharts.renderer.plot.PlotGrid;
import org.xclcharts.view.ChartView;
import org.xclcharts.view.GraphicalView;
import com.example.springweather.R;
import android.content.Context;
import android.graphics.Canvas;
import android.graphics.Color;
import android.graphics.Paint;
import android.util.AttributeSet;
import android.util.Log;
public class SplineChartView extends GraphicalView {
private SplineChart chart = new SplineChart();
//分类轴标签集合
private LinkedList labels = new LinkedList();
private LinkedList chartData = new LinkedList();
Paint pToolTip = new Paint(Paint.ANTI_ALIAS_FLAG);
public SplineChartView(Context context) {

    super(context);

    // TODO Auto-generated constructor stub

    initView();

}

public SplineChartView(Context context, AttributeSet attrs){

    super(context, attrs);

    initView();

 }

 public SplineChartView(Context context, AttributeSet attrs, int defStyle) {

        super(context, attrs, defStyle);

        initView();

 }

@Override

public void refreshChart() {

    super.refreshChart();

    labels.clear();

    chartData.clear();

}

 private void initView()

 {

        List<String> weather=new ArrayList<String>();

        for(int i=0;i<6;i++){

            weather.add("晴");

        }

        List<String> temps=new ArrayList<String>();

        for(int i=0;i<6;i++){

            temps.add("1");

        }

        setChartLabels(weather);

        setChartDataSet(temps);

        setChartAnchor(temps);

        chartRender();

 }

@Override

protected void onSizeChanged(int w, int h, int oldw, int oldh) {

    super.onSizeChanged(w, h, oldw, oldh);

   //图所占范围大小

    chart.setChartRange(w,h);

}

protected int[] getBarLnDefaultSpadding()

{

    int [] ltrb = new int[4];

    ltrb[0] = DensityUtil.dip2px(getContext(), 0); //left

    ltrb[1] = DensityUtil.dip2px(getContext(), 0); //top

    ltrb[2] = DensityUtil.dip2px(getContext(), 0); //right

    ltrb[3] = DensityUtil.dip2px(getContext(), 30); //bottom

    return ltrb;

}

private void chartRender()

{

    try {

        //设置绘图区默认缩进px值,留置空间显示Axis,Axistitle....

        int [] ltrb = getBarLnDefaultSpadding();

        chart.setPadding(ltrb[0] + DensityUtil.dip2px(this.getContext(), 20), ltrb[1],

                    ltrb[2]+DensityUtil.dip2px(this.getContext(), 30), ltrb[3]);

        //显示边框

        chart.showRoundBorder();

        //数据源

        chart.setCategories(labels);

        chart.setDataSource(chartData);

    //  chart.setCustomLines(mCustomLineDataset);

        //坐标系

        //数据轴最大值

        chart.getDataAxis().setAxisMax(40);

        chart.getDataAxis().setAxisMin(-40);

        //数据轴刻度间隔

        chart.getDataAxis().setAxisSteps(2);

        //标签轴最大值

        chart.setCategoryAxisMax(5);

        //标签轴最小值

        chart.setCategoryAxisMin(0);

        //背景网格

        PlotGrid plot = chart.getPlotGrid();

        plot.hideHorizontalLines();

        plot.hideVerticalLines();

        chart.getPlotArea().setBackgroundColor(true, Color.GRAY);

        chart.getCategoryAxis().getAxisPaint().setColor(Color.WHITE);

        chart.getCategoryAxis().getAxisPaint().setTextSize(6);

        chart.getCategoryAxis().hideTickMarks();

        chart.getCategoryAxis().getTickLabelPaint().setColor(Color.WHITE);

        chart.getCategoryAxis().getTickLabelPaint().setFakeBoldText(true);

        chart.getCategoryAxis().setTickLabelMargin(25);

        chart.getCategoryAxis().getTickLabelPaint().setTextSize(25);

        //不使用精确计算,忽略Java计算误差,提高性能

        chart.disableHighPrecision();

        chart.disablePanMode();

        chart.hideBorder();

        chart.getPlotLegend().hide();

        chart.getDataAxis().hide();

    } catch (Exception e) {

        // TODO Auto-generated catch block

        e.printStackTrace();

        Log.e("tag", e.toString());

    }

}

public void setChartDataSet(List<String> temps)

{

    //线1的数据集

    List<PointD> linePoint1 = new ArrayList<PointD>();

    linePoint1.add(new PointD(0d, Double.parseDouble(temps.get(0))));

    linePoint1.add(new PointD(1d, Double.parseDouble(temps.get(1))));

    linePoint1.add(new PointD(2d, Double.parseDouble(temps.get(2))));

    linePoint1.add(new PointD(3d, Double.parseDouble(temps.get(3))));

    linePoint1.add(new PointD(4d, Double.parseDouble(temps.get(4))));

    linePoint1.add(new PointD(5d, Double.parseDouble(temps.get(5))));

    SplineData dataSeries1 = new SplineData("Go",linePoint1,

            Color.WHITE );

    //把线弄细点

    dataSeries1.getLinePaint().setStrokeWidth(3);

    dataSeries1.setLineStyle(XEnum.LineStyle.DASH);

    dataSeries1.setLabelVisible(false);

    dataSeries1.setDotStyle(XEnum.DotStyle.RING);

    dataSeries1.getDotPaint().setColor(getResources().getColor(R.color.white));

    dataSeries1.getPlotLine().getPlotDot().setRingInnerColor(getResources().getColor(R.color.grey));

    chartData.add(dataSeries1);

    this.invalidate();

}

public void setChartLabels(List<String> weather){

    String[] times={"20:00\n","23:00\n","2:00\n","5:00\n","8:00\n","11:00\n"};

    for(int i=0;i<weather.size();i++){

        labels.add(times[i]+weather.get(i));

    }

    this.invalidate();

}

public void setChartAnchor(List<String> temps){

    //激活点击监听

            chart.ActiveListenItemClick();

            //为了让触发更灵敏,可以扩大5px的点击监听范围

            chart.extPointClickRange(5);

            chart.showClikedFocus();

            //批注

            List<AnchorDataPoint> mAnchorSet = new ArrayList<AnchorDataPoint>();

            AnchorDataPoint an2 = new AnchorDataPoint(0,0,XEnum.AnchorStyle.TOBOTTOM);

            an2.setBgColor(Color.WHITE);

            an2.setLineWidth(15);

            an2.setLineStyle(XEnum.LineStyle.DASH);

            an2.setTextColor(Color.WHITE);

            an2.setTextSize(55);

            an2.setAnchor(temps.get(0));

            AnchorDataPoint an3 = new AnchorDataPoint(0,1,XEnum.AnchorStyle.TOBOTTOM);

            an3.setBgColor(Color.WHITE);

            an3.setLineStyle(XEnum.LineStyle.DASH);

            an3.setTextColor(Color.WHITE);

            an3.setTextSize(55);

            an3.setAnchor(temps.get(1));

            //从点到底的标识线

            //从点到底的标识线

            AnchorDataPoint an4 = new AnchorDataPoint(0,2,XEnum.AnchorStyle.TOBOTTOM);

            an4.setBgColor(Color.WHITE);

            an4.setLineWidth(15);

            an4.setLineStyle(XEnum.LineStyle.DASH);

            an4.setTextColor(Color.WHITE);

            an4.setTextSize(55);

            an4.setAnchor(temps.get(2));

            AnchorDataPoint an5 = new AnchorDataPoint(0,3,XEnum.AnchorStyle.TOBOTTOM);

            an5.setBgColor(Color.WHITE);

            an5.setLineWidth(15);

            an5.setLineStyle(XEnum.LineStyle.DASH);

            an5.setTextColor(Color.WHITE);

            an5.setTextSize(55);

            an5.setAnchor(temps.get(3));

            AnchorDataPoint an6 = new AnchorDataPoint(0,4,XEnum.AnchorStyle.TOBOTTOM);

            an6.setBgColor(Color.WHITE);

            an6.setLineWidth(15);

            an6.setLineStyle(XEnum.LineStyle.DASH);

            an6.setTextColor(Color.WHITE);

            an6.setTextSize(55);

            an6.setAnchor(temps.get(4));

            AnchorDataPoint an7 = new AnchorDataPoint(0,5,XEnum.AnchorStyle.TOBOTTOM);

            an7.setBgColor(Color.WHITE);

            an7.setLineWidth(15);

            an7.setLineStyle(XEnum.LineStyle.DASH);

            an7.setTextColor(Color.WHITE);

            an7.setTextSize(55);

            an7.setAnchor(temps.get(5));

            mAnchorSet.add(an2);

            mAnchorSet.add(an3);

            mAnchorSet.add(an4);

            mAnchorSet.add(an5);

            mAnchorSet.add(an6);

            mAnchorSet.add(an7);

            chart.setAnchorDataPoint(mAnchorSet);

            this.invalidate();

}

@Override

public void render(Canvas canvas) {

    try{

        canvas.drawColor(Color.GRAY);

        chart.render(canvas);

    } catch (Exception e){

        Log.e("tag", e.toString());

    }

}
}
一款天气app的温度曲线图的实现的更多相关文章
- 推荐一款移动端天气App即刻天气
推荐一款移动端天气App即刻天气 一 应用描述 即刻天气预报是一个提供全国各城市15日天气预报和空气质量的APP,包含全国3000个城市天气预报,3万个乡镇天气,15日及48小时空气质量预报,是万千用 ...
- 用Swift实现一款天气预报APP(二)
这个系列的目录: 用Swift实现一款天气预报APP(一) 用Swift实现一款天气预报APP(二) 用Swift实现一款天气预报APP(三) 上篇中主要讲了界面的一些内容,这篇主要讨论网络请求,获得 ...
- 用Swift实现一款天气预报APP(一)
这个系列的目录: 用Swift实现一款天气预报APP(一) 用Swift实现一款天气预报APP(二) 用Swift实现一款天气预报APP(三) Swift作为现在苹果极力推广的语言,发展的非常快.这个 ...
- DB天气app冲刺第六天
更改计划 以前是准备完全自己写一个天气App 而且加上自己已经成功的做了一个安卓开发的小例子了,就感觉可以做的出来了.结果这五天证明自己一开始的思路就错了.所以上次跟别的同学问了一下.看了一下他们的方 ...
- 【酷我天气】完整的天气App项目
本人完全自主设计与开发的一款轻量级简约好用的天气App,无广告,无烦人的通知栏信息,定位精准,天气信息数据准确,还支持更换背景皮肤哦,颜值爆表. 实现的功能: 1自动定位:自动获取用户所在的城市位置然 ...
- 用Swift实现一款天气预报APP(三)
这个系列的目录: 用Swift实现一款天气预报APP(一) 用Swift实现一款天气预报APP(二) 用Swift实现一款天气预报APP(三) 通过前面的学习,一个天气预报的APP已经基本可用了.至少 ...
- 【总结整理】自带天气app,为什么还要下载
很简单那就说明用户对天气这个功能的需求并没有表面那么简单呗,还有更深层次的需求~ 先声明我自己是没有这方面需求的,我就纯属YY一下 既然数据都一样的话,那是什么让用户觉得天气APP更专业呢? 1.历史 ...
- 个人开发者做一款Android App需要知道的事情
个人开发者做一款Android App需要知道的事情 在大学时, 自己是学计算机专业的,而且还和老师一起做过一年半的项目. 有时候是不是有这样的想法,做一个自己的网站.但一直未付诸行动.2012年时, ...
- 利用react native创建一个天气APP
我们将构建一个实列程序:天气App,(你可以在react native 中创建一个天气应用项目),我们将学习使用并结合可定义模板(stylesheets).盒式布局(flexbox).网络通信.用户输 ...
随机推荐
- 美国汪利宏的蒙特卡洛及卷积模拟程序,可以模拟top-hat光束和高斯光束在生物组织中的传输
链接:https://pan.baidu.com/s/1yaCsQ8TCVPSIZ4TVBZgfnw 密码:otzr
- win32 ag + xargs
需要使用-0 d:\Apps\AutoHotkey\scripts>ag 2b89eaa_r13_ad1 -l -0|xargs -0 sed -i s/2b89eaa_r13_ad1/2b89 ...
- Java内部抛出异常外部不能catch问题分析
今天在论坛看到一篇关于异常处理的文章,异常处理机制详解开头就搬出了这样一个例子: public class TestException { public TestException() { } boo ...
- [D3] Convert Dates to Numeric Values with Time Scales in D3 v4
Mapping abstract values to visual representations is what data visualization is all about, and that’ ...
- 怎样解决CRITICAL glance [-] AttributeError: 'NoneType' object has no attribute 'drivername'
今天在配置OpenStack的Glance时.前边进行的都非常顺利.当作到这一步时sudo glance-manage db_sync时出现了例如以下错误 依据错误提示,想到可能是配置问题.于是就查找 ...
- HTML Email 编写指南(转)
作者: 阮一峰 日期: 2013年6月16日 今天,我想写一个"低技术"问题. 话说我订阅了不少了新闻邮件(Newsletter),比如JavaScript Weekly.每周 ...
- 摘录-解压版mysql配置(版本5.7)
1.下载解压2.创建my.ini文件基础配置:(注意编码必须为ANSI)#代码开始[Client]# 设置mysql客户端默认字符集default-character-set=utf8[mysqld] ...
- [Ramda] Curry and Uncurry Functions with Ramda
Most of the functions offered by the ramda library are curried by default. Functions you've created ...
- PHP怎么读写XML?(四种方法)
PHP怎么读写XML?(四种方法) 一.总结 1.这四种方法中,字符串的方式是最原始的方法.SimpleXML和DOM扩展是属于基于树的解析器,把整个文档存储为树的数据结构中,需要把整个文档都加载到内 ...
- [Postgre] Insert Data into Postgre Tables
// Insert one row INSERT INTO movies (title, release_date, count_stars, director_id) VALUES ( 'Kill ...