SciTech-Mathematics-Probability+Statistics-7 Steps to Mastering Statistics for Data Science
7 Steps to Mastering Statistics for Data Science
BY BALA PRIYA CPOSTED ON JULY 19, 2024
A strong foundation in statistics is essential if you're looking to become a skilled data scientist. From analyzing trends in data to building predictive models and making data-driven decisions—a good grasp of statistics concepts is useful in all data science tasks. But learning and becoming proficient in statistics requires quite the effort!
Which is why we've put together this guide to help you learn all the statistical concepts you should add to your data science toolbox. So to learn statistics for data science, you'll need:
- A plan (a rough idea rather) on what statistical concepts you need to learn, and
- A programming language and essential libraries to try and apply what you learn.
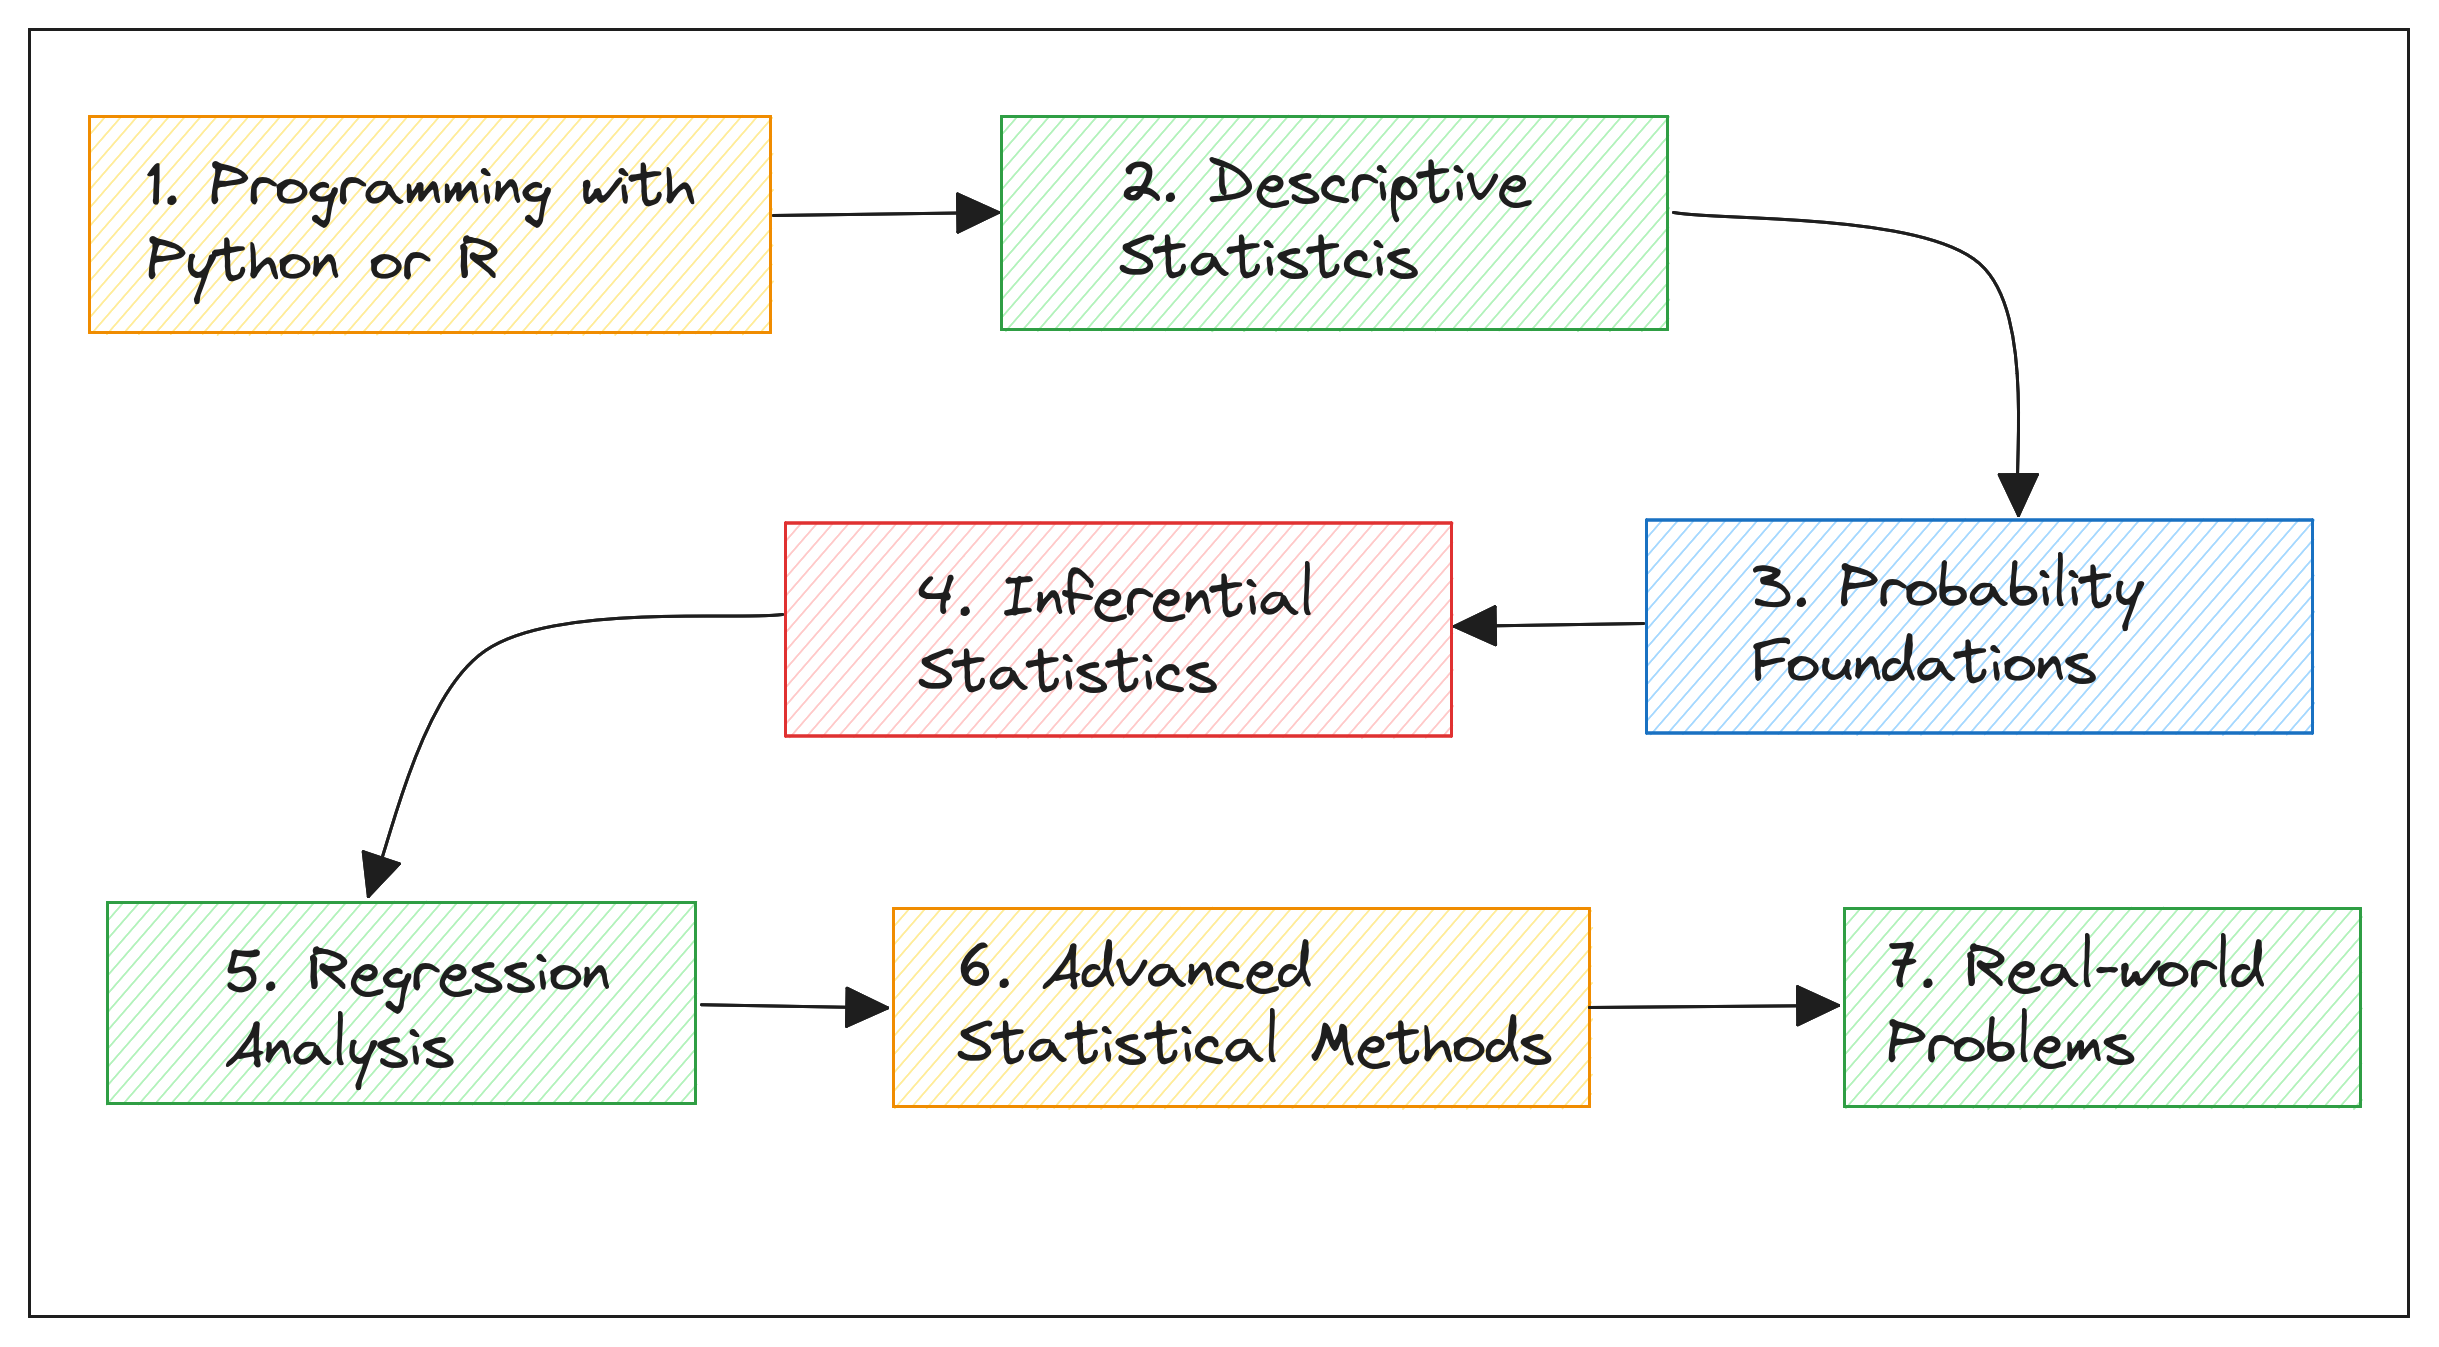
Statistics, in essence, is about understanding data through analysis and experimentation. And this guide breaks down learning statistics for data science into seven simple and coherent steps to help you get started.
Step 1: Learn Programming with Python
Before you can learn and use statistical methods in data science, you should be proficient in a programming language, preferably Python.
What You Should Learn
When learning Python or R, focus on the following:
- Basic Syntax: Understand variables, data types, loops, and conditionals.
- Data Structures: Learn to work with built-in Python data structures like lists, dictionaries, and tuples; Vectors and data frames in R.
- Libraries: Familiarize yourself with key libraries for data science such as pandas, NumPy, SciPy, statsmodels, and Seaborn for Python.
Practice
Set up your working environment:
- Practice writing basic scripts to analyze and manipulate data.
- Get comfortable using libraries for data manipulation and analysis by working on toy datasets.
After you're comfortable programming with Python, you can work on building statistics foundations.
Step 2: Understand Descriptive Statistics
It's always better (and easier) to build on what you know. You should be familiar with basic descriptive statistics from school math.
Descriptive statistics provides simple summaries about the sample and the measures. It's useful to understand and calculate the main statistical measures to summarize your data effectively.
What You Should Learn
When learning descriptive statistics, be sure to cover:
- Measures of central tendency: Mean, median, and mode and their significance
- Measures of dispersion: Range, variance, standard deviation, and interquartile range; also focus on the uses of these measures of dispersion
- Distribution shapes: Skewness and kurtosis
- Data visualization: Histograms, box plots, and bar charts
– when and how to use these charts
Practice
Once you've learned the concepts, pick a sample dataset to work with:
- Calculate summary statistics and interpret the measures.
- creating visualizations to summarize data.
When you talk about data, you also talk about the underlying probability distribution.
So our next step is to work on probability foundations.
Step 3: Learn Probability Foundations
Probability theory is the foundation of statistical inference,
providing the theoretical framework to make conclusions about populations based on sample data.
What You Should Learn
You should focus on the following:
- Basic probability concepts: such as events, sample space, and conditional probability
- Probability distributions: like the Binomial, Poisson, and normal distributions
- Conditional probability and Bayes' theorem
Practice
To apply what you've learned, you can:
- Solve a few problems on probability—first by hand and then programmatically.
- Simulate different probability distributions and understand their real-world applications.
You can use the Statistics and Probability course on Khan Academy as a learning resource for the steps thus far (and those to come).
Step 4: Focus on Inferential Statistics
With basic stats and probability covered, you should now focus on concepts in inferential statistics. With tools from inferential statistics, you can make inferences about a population based on the available sample.
What You Should Learn
Concepts to focus on are as follows:
- Hypothesis Testing:
- Null and alternative hypotheses,
- type I and II errors,
- p-values and significance levels
- Confidence Intervals:
Constructing and interpreting confidence intervals. - T-tests and ANOVA:
Methods for comparing means across groups.
Practice
Once you're comfortable with the concepts listed above, you can:
- Learn to perform and interpret hypothesis tests.
- Practice calculating and interpreting confidence intervals.
For this step, you may find the lessons on confidence intervals and hypothesis testing in Khan Academy's Statistics and Probability course helpful.
Step 5: Learn Regression Analysis
Regression Analysis is a powerful statistical method used for examining the relationships between variables.
What You Should Learn
When learning about regression algorithms, you should focus on the following:
- Linear regression: Understanding the best fit line, model coefficients, and R-squared
- Multiple regression: Extending linear regression to multiple variables
- Logistic regression: Used for binary outcomes and interpreting odds ratios
Practice
After you've learned the basics:
- Learn to build and interpret linear and multiple regression models.
- Practice assessing the fit and assumptions of regression models.
By now, you have most of the statistics you'll need in your data science role.
And it's time to level up.
Step 6: Explore Advanced Stats. Methods
Advanced statistical methods expand your analytical capabilities,
allowing you to tackle more complex data science problems.
But you need to learn to work with time series data and other high-dimensional datasets.
What You Should Learn
You can learn more on:
- Time Series Analysis:
Understanding trends, seasonality, and autocorrelation in data over time - PCA(Principal Component Analysis),
a method for dimensionality reduction, focusing on eigenvalues and eigenvectors,
and other dimensionality reduction algorithms
Practice
After learning the basics:
- Practice time series forecasting on a suitable dataset.
- Apply dimensionality reduction techniques on a high-dimensional dataset, then analyze it.
To learn about Time Series Analysis, you can go through the Time Series micro-course from Kaggle.
Step 7: Solve Real-World Problems
Learning and practicing along the way will only get you so far.
But real learning happens when you get your hands dirty working with real-world datasets.
Applying your statistical knowledge to real-world problems solidifies your understanding and prepares you for practical data science challenges.
What You Should Build and Practice
Work on personal projects to apply statistical methods to real data.
- Use real-world datasets.
Find datasets from various domains such as healthcare, finance, and marketing - Develop understanding of the domain
as it'll help you analyze the data better and build more helpful models - Work on end-to-end data analysis projects, from data cleaning to model building and interpretation
- Practice presenting your results through reports, technical tutorials, and presentations
This will help you to also build out a portfolio of projects while improving your statistical analysis skills. If you're ready to push yourself further, you can take the Statistical Learning with Python course from Stanford Online. There's an R version of the course available, too, in case you like using R.
Conclusion
I hope you find this guide helpful.
The seven steps outlined should help you build a solid foundation in both theoretical stats concepts and practical applications.
- Starting with programming, you must learn how to manipulate and analyze data using Python.
You should then explore descriptive statistics to summarize data, followed by probability theory to understand the likelihood of events and distributions. - Then, you can move to inferential statistics, regression analysis, and advanced statistical methods to work with time series data and the like. These are great additions to your toolkit, enabling you to tackle more complex data science problems.
- Finally, applying your knowledge to real-world problems solidifies your understanding and prepares you for practical data science challenges. By working on projects, participating in competitions (and getting better), and effectively communicating your findings, you can grow your stats and data science skills.
Happy learning!
SciTech-Mathematics-Probability+Statistics-7 Steps to Mastering Statistics for Data Science的更多相关文章
- Sql Server性能优化辅助指标 - SET STATISTICS TIME ON和SET STATISTICS IO ON
1.前言 对于优化SQL语句或存储过程,以前主要是用如下语句来判断具体执行时间,但是SQL环境是复杂多变的,下面语句并不能精准判断性能是否提高:如果需要精确知道CPU.IO等信息,就无能为力了. ), ...
- Sql Server- 性能优化辅助指标SET STATISTICS TIME ON和SET STATISTICS IO ON
1.前言 对于优化SQL语句或存储过程,以前主要是用如下语句来判断具体执行时间,但是SQL环境是复杂多变的,下面语句并不能精准判断性能是否提高:如果需要精确知道CPU.IO等信息,就无能为力了. 1 ...
- Sql Server性能优化辅助指标SET STATISTICS TIME ON和SET STATISTICS IO ON
1.前言 对于优化SQL语句或存储过程,以前主要是用如下语句来判断具体执行时间,但是SQL环境是复杂多变的,下面语句并不能精准判断性能是否提高:如果需要精确知道CPU.IO等信息,就无能为力了. ), ...
- Python (1) - 7 Steps to Mastering Machine Learning With Python
Step 1: Basic Python Skills install Anacondaincluding numpy, scikit-learn, and matplotlib Step 2: Fo ...
- 《Pro SQL Server Internals, 2nd edition》的CHAPTER 3 Statistics中的Introduction to SQL Server Statistics、Statistics and Execution Plans、Statistics Maintenance(译)
<Pro SQL Server Internals> 作者: Dmitri Korotkevitch 出版社: Apress出版年: 2016-12-29页数: 804定价: USD 59 ...
- Intro to Python for Data Science Learning 8 - NumPy: Basic Statistics
NumPy: Basic Statistics from:https://campus.datacamp.com/courses/intro-to-python-for-data-science/ch ...
- Main Steps to Setup an ODI data sync
0. Get ODI installed 1. Topo physical Architecture/new physical schema 2. New Logical schema 3. New ...
- SQLServer------Sql Server性能优化辅助指标SET STATISTICS TIME ON和SET STATISTICS IO ON
转载: http://www.cnblogs.com/xqhppt/p/4041799.html
- Cognition math based on Factor Space (2016.05)
Cognition math based on Factor Space Wang P Z1, Ouyang H2, Zhong Y X3, He H C4 1Intelligence Enginee ...
- [C1] Andrew Ng - AI For Everyone
About this Course AI is not only for engineers. If you want your organization to become better at us ...
随机推荐
- 1.3K star!VisActor团队开源神器,3秒生成商业级图表,程序员直呼真香!
嗨,大家好,我是小华同学,关注我们获得"最新.最全.最优质"开源项目和高效工作学习方法 项目速览 VChart 是VisActor团队推出的高性能可视化解决方案,GitHub斩获2 ...
- MCP-Playwright:AI自动化神器,一款超级好用的自动化测试框架!
在软件开发与测试领域,自动化测试早已成为提升效率.保障质量的核心工具.然而,传统自动化测试框架往往面临代码编写繁琐.跨工具协作困难.操作复杂等痛点. 而今天,给大家介绍一款自动化测试工具:MCP-Pl ...
- SQL 强化练习 (八)
继续练习写sql, 不能停下来. 今天还额外对 Excel 拼接 sql 语句做了一个代码实现, 逻辑是蛮简单的, 发现其实很多东西都是蛮简单的, 只要一点点去做, 明白逻辑过后, 慢慢去调试, 都是 ...
- MySQL的表空间释放
概述 最近为了对 MySQL 数据库磁盘占用瘦身,对一张近100GB表的历史数据进行了 delete 删除,删除了约2/3的数据,删除后发现该表占用的空间并未减少.通过下面语句查看该表的磁盘占用情况: ...
- SuperSocket 2.0 的发布标志着.NET Socket 服务器框架迈入了一个全新的时代
2025 年 4 月 20 日 - SuperSocket 团队自豪地宣布正式发布 SuperSocket 2.0,这是这款适用于 .NET 的高性能.可扩展套接字服务器应用程序框架的一个重要里程碑. ...
- MyBatis常见面试题:通常一个Xml映射文件,都会写一个Dao接口与之对应,请问,这个Dao接口的工作原理是什么?Dao接口里的方法,参数不同时,方法能重载吗?
MyBatis常见面试题:通常一个Xml映射文件,都会写一个Dao接口与之对应,请问,这个Dao接口的工作原理是什么?Dao接口里的方法,参数不同时,方法能重载吗? Dao接口即Mapper接 ...
- Free Mybatis Tool插件
Free Mybatis plugin Free Mybatis Tool 老规矩先吹一波......这个idea里面的插件真的十分nice,上个图让你们知道他的优秀.直接在idea插件搜索就可以安装 ...
- vue中使用axios获取到的Promise {<pending>}数据,无法使用的问题
使用axios拿到后端数据后 返回的是 Promise {} 我们可以看到数据是在[[PromiseResult]]这个Object对象中 此时我们是无法获取对象的 解决方法:使用async和awai ...
- 开箱即用,袋鼠云上线DeepSeek AI大模型一体机!
"服务器繁忙,请稍后再试."DeepSeek于2025年初爆火后,需求量剧增,算力资源被持续压榨,处于满负荷运行状态.加之因担忧数据安全与合规,大型组织纷纷将目光投向DeepSee ...
- 数栈产品分享:基于StreamWorks构建实时大数据处理平台
数栈是云原生-站式数据中台PaaS,我们在github和gitee上有一个有趣的开源项目:FlinkX,FlinkX是一个基于Flink的批流统一的数据同步工具,既可以采集静态的数据,也可以采集实时变 ...