Grafana监控OracleDB的完整过程
Grafana监控OracleDB的完整过程
背景
两年前曾经写过一个进行Oracle 监控的简单blog

但是周天晚上尝试进行处理时发现很不完整了.

很多数据获取不到.

晚上又熬夜了好久进行处理. 感觉还是需要总结一下,不然就忘记了
获取镜像
还是使用 docker 的方式来暴露Oracle的服务

使用的镜像为:

docker pull ghcr.io/iamseth/oracledb_exporter:0.4.3

需要注意这个镜像比较大, 压缩完还 270MB 左右
注意事项-1
镜像内的监控事项比较少. 可能只是非常简单的.

我这边想监控的是一些性能相关的内容, 仅看一些简单内容, 感觉没有任何意义.

然后继续从github上面找相关的资料:

https://github.com/saitiger008/oracledb_exporter_metrics/blob/main/default-metrics.toml

这个哥们自己加了一些监控事项挺好的.

我这边将他的监控与默认的default进行合并. 内容放到最下面.

然后通过-v 的方式在容器内加载默认的metrics的监控事项.

可以通过docker logs --tail=100 containername的方式进行查看具体内容.
注意事项-2
正常启用之后发现还是无法进行相关的监控信息.

主要是无法获取一些系统的监控信息.

日志里面很多这样的提示信息:

 msg="Error scraping for" context=resource metricsDesc="unsupported value type" s

 msg="Error scraping for" context=sysmetric metricsDesc="unsupported value type"

 msg="Error scraping for" context=wait_time metricsDesc="unsupported value type"

 msg="Error scraping for" context=rman_info metricsDesc="unsupported value type"

提示无法获取对应的监控信息.
注意事项-2
这个地方耗时很久进行处理. 发现总是比较难易解决问题.

主要问题是 只有 sys 账户会查询 select * from v$sysmetirc的视图.

并且必须要sysdba的账户进行登录, 如果不是sysdba 查询此视图都是空的.

所以问题的核心是用Docker的语法实现 sysdba 角色的登录.

我这边尝试 / as sysdba 发现是没有效果的.

查看官方文档是发现有一个解决方法为:

在 DATA_SOURCE_NAME 的和面添加 ?as=sysdba 的方式来指定角色.

# 清理之前的容器

docker rm -f oracledb_exporter

# 创建对应的容器进行监听

docker run -d --name oracledb_exporter  --restart=always --net=host \

-e DATA_SOURCE_NAME='sys/MYpassword@10.110.xx.xx/gscdb?as=sysdba' \

-v /oracledb/default-metrics.toml:/default-metrics.toml ghcr.io/iamseth/oracledb_exporter:0.4.3

# 查看日志信息.

docker logs -f  oracledb_exporter
注意事项-3
使用 桥接网络 也可以 但是需要注意写法为:

docker rm -f oracledb_exporter2

docker run -d --name oracledb_exporter2  --restart=always -p 9162:9161 --privileged \

-e DATA_SOURCE_NAME='sys/Mypassword@10.110.136.37/ora19c?as=sysdba' \

-v /oracledb/default-metrics.toml:/default-metrics.toml ghcr.io/iamseth/oracledb_exporter:0.4.3

docker logs -f  oracledb_exporter2
注意事项-4
Prometheus的设置为:

scrape_configs:

  - job_name: '116Oracle_ora19c' # job_name默认写入timeseries的labels中,可以用于查询使用

    static_configs: # 静态配置

      - targets: ['10.110.136.xxx:9162']

注意 需要重启Prometheus使之生效.

另外 yaml 格式一定注意空格和格式.
注意事项-5
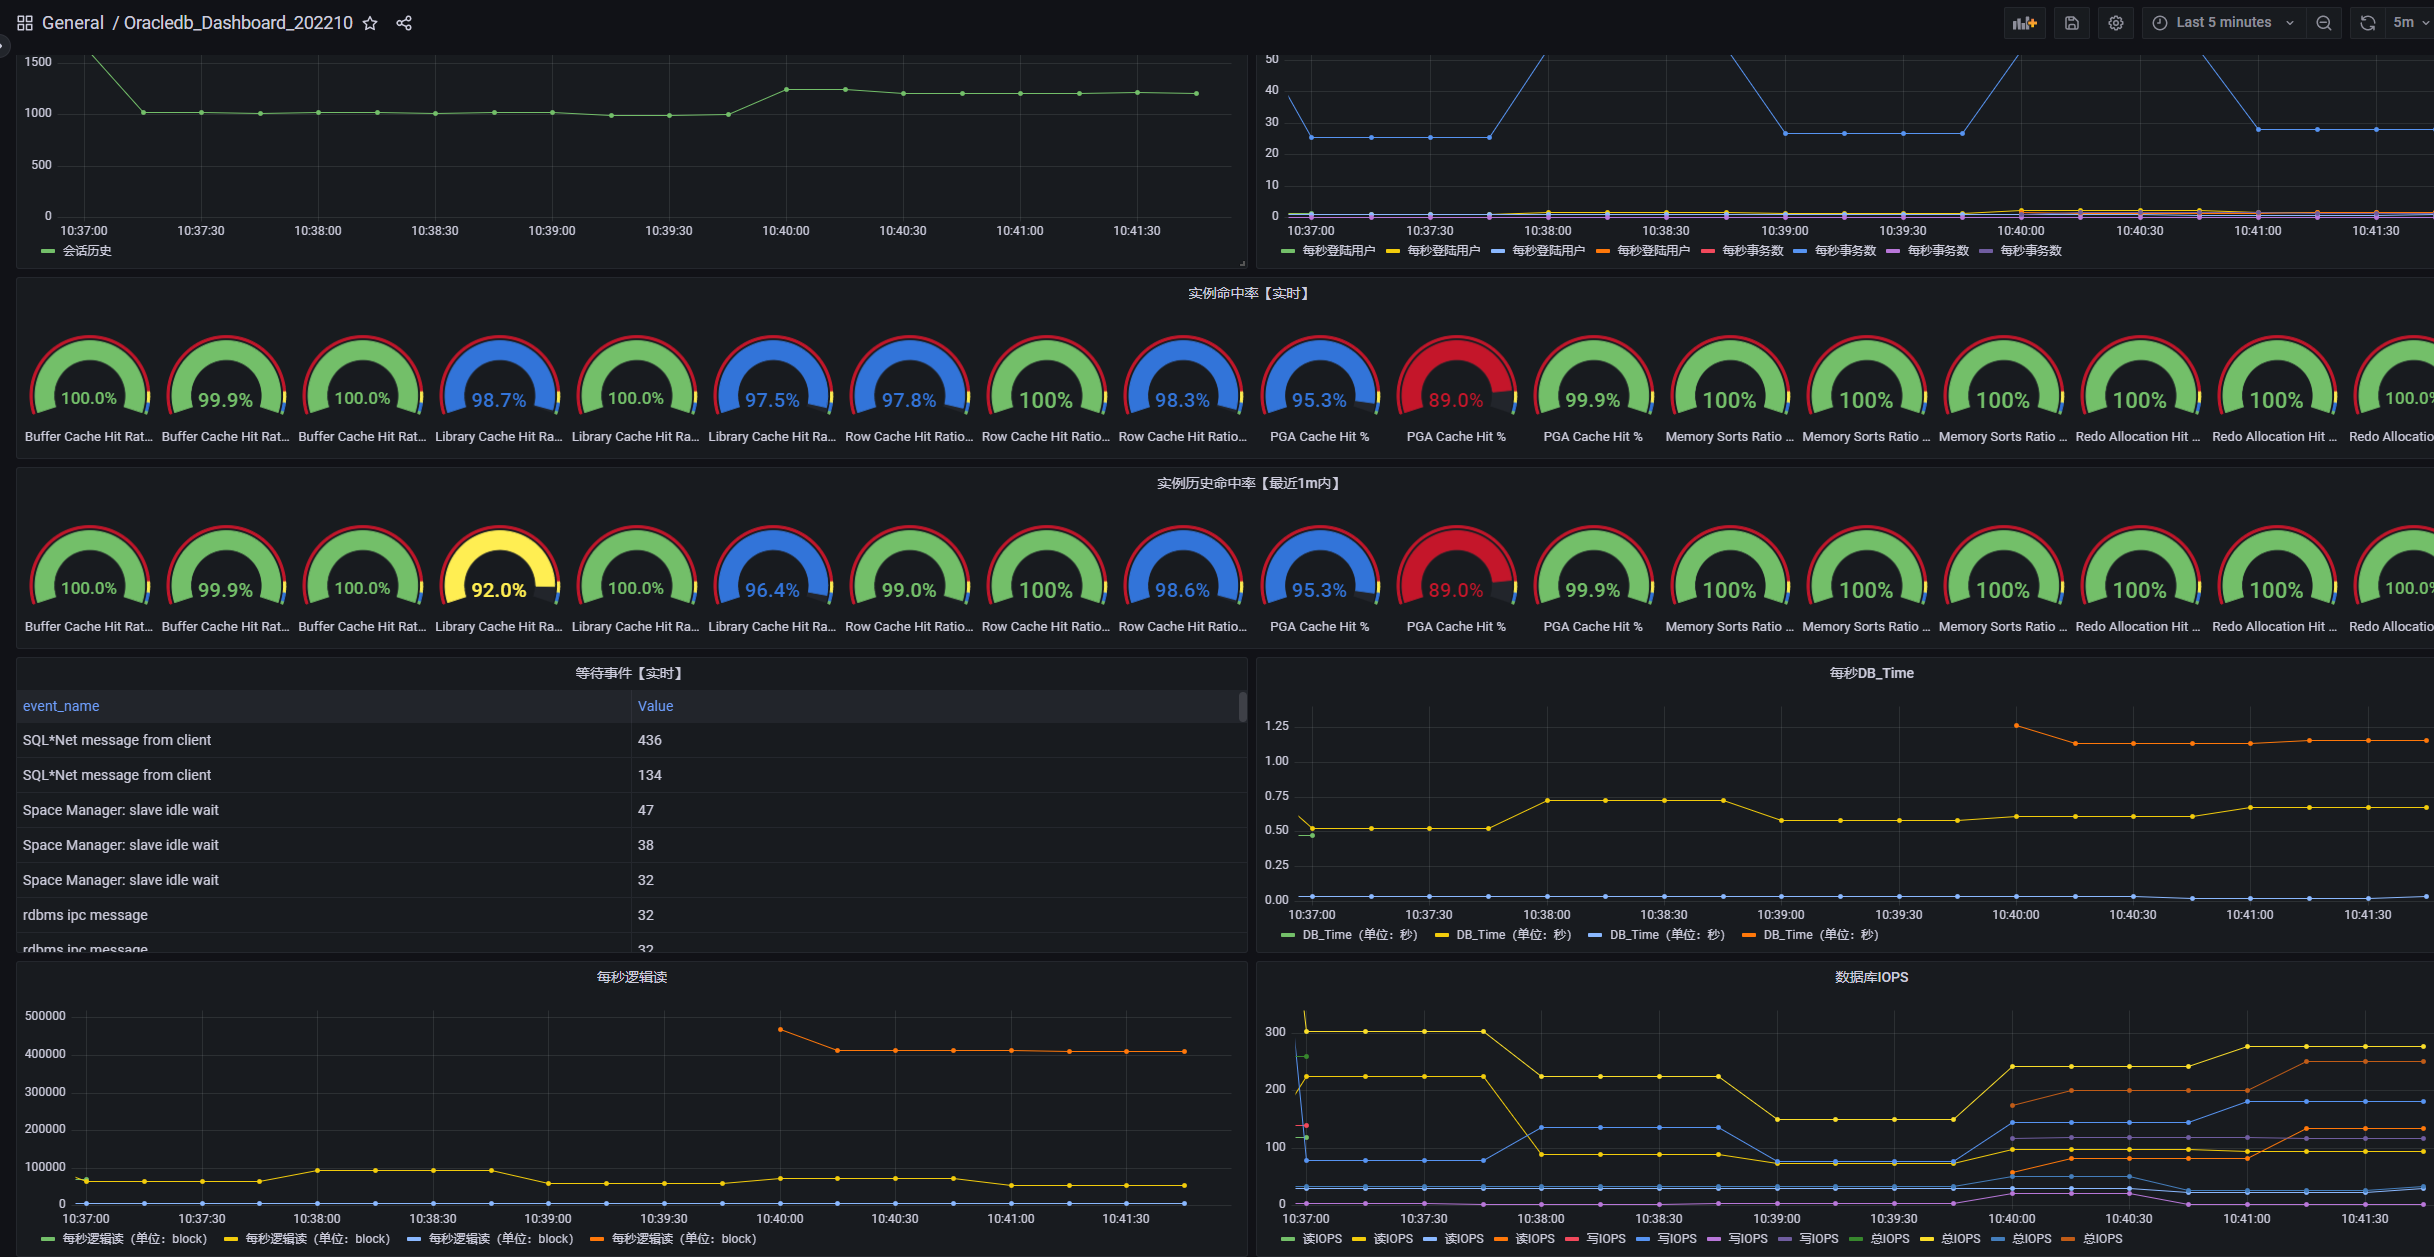
Grafana的设置

注意 这次选用的是国人开发的一个配置:

编号为: 17136

具体地址为:

https://grafana.com/grafana/dashboards/17136-oracledb-new-202210/
效果为
自己的公众号不定期更新内容

监控配置脚本
[[metric]]

context = "sessions"

labels = [ "status", "type" ]

metricsdesc = { value= "Gauge metric with count of sessions by status and type." }

request = "SELECT status, type, COUNT(*) as value FROM v$session GROUP BY status, type"

[[metric]]

context = "resource"

labels = [ "resource_name" ]

metricsdesc = { current_utilization= "Generic counter metric from v$resource_limit view in Oracle (current value).", limit_value="Generic counter metric from v$resource_limit view in Oracle (UNLIMITED: -1)." }

request="SELECT resource_name,current_utilization,CASE WHEN TRIM(limit_value) LIKE 'UNLIMITED' THEN '-1' ELSE TRIM(limit_value) END as limit_value FROM v$resource_limit"

[[metric]]

context = "asm_diskgroup"

labels = [ "name" ]

metricsdesc = { total = "Total size of ASM disk group.", free = "Free space available on ASM disk group." }

request = "SELECT name,total_mb*1024*1024 as total,free_mb*1024*1024 as free FROM v$asm_diskgroup_stat where exists (select 1 from v$datafile where name like '+%')"

ignorezeroresult = true

[[metric]]

context = "activity"

metricsdesc = { value="Generic counter metric from v$sysstat view in Oracle." }

fieldtoappend = "name"

request = "SELECT name, value FROM v$sysstat WHERE name IN ('parse count (total)', 'execute count', 'user commits', 'user rollbacks')"

[[metric]]

context = "process"

metricsdesc = { count="Gauge metric with count of processes." }

request = "SELECT COUNT(*) as count FROM v$process"

[[metric]]

context = "wait_time"

metricsdesc = { value="Generic counter metric from v$waitclassmetric view in Oracle." }

fieldtoappend= "wait_class"

request = '''

SELECT

  n.wait_class as WAIT_CLASS,

  round(m.time_waited/m.INTSIZE_CSEC,3) as VALUE

FROM

  v$waitclassmetric  m, v$system_wait_class n

WHERE

  m.wait_class_id=n.wait_class_id AND n.wait_class != 'Idle'

'''

[[metric]]

context = "tablespace"

labels = [ "tablespace", "type" ]

metricsdesc = { bytes = "Generic counter metric of tablespaces bytes in Oracle.", max_bytes = "Generic counter metric of tablespaces max bytes in Oracle.", free = "Generic counter metric of tablespaces free bytes in Oracle.", used_percent = "Gauge metric showing as a percentage of how much of the tablespace has been used." }

request = '''

SELECT

    dt.tablespace_name as tablespace,

    dt.contents as type,

    dt.block_size * dtum.used_space as bytes,

    dt.block_size * dtum.tablespace_size as max_bytes,

    dt.block_size * (dtum.tablespace_size - dtum.used_space) as free,

    dtum.used_percent

FROM  dba_tablespace_usage_metrics dtum, dba_tablespaces dt

WHERE dtum.tablespace_name = dt.tablespace_name

ORDER by tablespace

'''

[[metric]]

context = "parameter"

labels = [ "name","param" ]

metricsdesc = { value ="Gauge metric with database parameter" }

request = "select name,value as param,1 as value from v$parameter"

[[metric]]

context = "sessions"

labels = [ "status", "type" ]

metricsdesc = { value= "Gauge metric with count of sessions by status and type." }

request = "SELECT status, type, COUNT(*) as value FROM v$session GROUP BY status, type"

[[metric]]

context = "parameter_sessions"

metricsdesc = { value ="Gauge metric with sessions parameter" }

request = "select value  from v$parameter t where t.name = 'sessions'"

[[metric]]

context = "volumns"

metricsdesc = { value= "database total volumes,size G" }

request = "SELECT sum(bytes/1024/1024/1024) as value FROM dba_segments"

[[metric]]

context = "env"

labels = [ "host_name" ]

metricsdesc = { is_rac = "if 1 then rac." }

request = '''

select host_name,

decode((select value from v$option where parameter = 'Real Application Clusters'), 'TRUE',1,0) as is_rac

from v$instance

'''

[[metric]]

context = "env"

labels = [ "version" ]

metricsdesc = { running_time = "get version and running_time" }

request = '''

select version,trunc(sysdate - startup_time) as running_time from v$instance

'''

[[metric]]

context = "env"

labels = [ "platform_name","log_mode","force_logging","flashback_on","database_role","open_mode","nls_characterset" ]

metricsdesc = { value = "get other env" }

request = '''

select platform_name,log_mode,force_logging,flashback_on,database_role,open_mode,

(select value from nls_database_parameters where parameter = 'NLS_CHARACTERSET') as nls_characterset, 1 as value  from v$database

'''

[[metric]]

context = "env"

labels = [ "name" ]

metricsdesc = { redo_value = "get redo logs info" }

request = '''

with temp as(

select count(group#) as group_num,min(members) as member_num,min(bytes/1024/1024) as log_size from v$log

)

select  'group_num' as name ,group_num as redo_value from temp

union all

select  'member_num' as name ,member_num as redo_value from temp

union all

select  'log_size' as name ,log_size as redo_value from temp

'''

[[metric]]

context = "env"

metricsdesc = { redo_switch_value = "Gauge metric with sum of segments data." }

request = '''

select max(sequence#) as redo_switch_value from v$log

'''

[[metric]]

context = "env"

metricsdesc = { vols = "Gauge metric with sum of segments data." }

request = '''

select to_char(sum(bytes)) as vols from dba_segments

'''

[[metric]]

context = "events"

labels = [ "event_name"]

metricsdesc = { value = "get events from v$session_wait" }

request = '''

select event as event_name, count(*) as value

   from v$session_wait

      where wait_time >= -1 group by event order by 2 desc

'''

[[metric]]

context = "db_time"

metricsdesc = { value="Generic counter metric from v$sys_time_model view in Oracle." }

request = '''

select value from v$sys_time_model t where t.STAT_NAME = 'DB time'

'''

[[metric]]

context = "sysmetric"

metricsdesc = { value="Get sysmetrics from v$sysmetric view in Oracle." }

fieldtoappend = "metric_name"

request = '''

select replace(metric_name,'%','') as metric_name ,value from v$sysmetric  where group_id = 2 and metric_name != 'Average Synchronous Single-Block Read Latency'

'''

[[metric]]

context = "sysstat"

metricsdesc = { value="Compute Oracle IOPS and MBPS from v$sysstat view in Oracle." }

fieldtoappend = "name"

request = '''

select name , trunc(sum(value), 2) as value

  from (select decode(name,

                      'physical read total IO requests',

                      'Oracle IOPS',

                      'physical write total IO requests',

                      'Oracle IOPS',

                      'redo writes',

                      'Oracle IOPS',

                      'physical read total bytes',

                      'Oracle MBPS',

                      'physical write total bytes',

                      'Oracle MBPS',

                      'redo size',

                      'Oracle MBPS') as name,

               decode(name,

                      'physical read total IO requests',

                      value,

                      'physical write total IO requests',

                      value,

                      'redo writes',

                      value,

                      'physical read total bytes',

                      value / 1024 / 1024,

                      'physical write total bytes',

                      value / 1024 / 1024,

                      'redo size',

                      value / 1024 / 1024) as value

          from v$sysstat

         where name in (

                        'physical read total bytes',

                        'physical write total bytes',

                        'physical read total IO requests',

                        'physical write total IO requests',

                        'redo writes',

                        'redo size'))

 where name is not null

 group by name

union all

SELECT a.name, a.value

  FROM v$sysstat a, v$statname b

 where a.statistic# = b.statistic#

   and b.name in (

                  'consistent gets',

                  'execute count',

                  'parse count (hard)',

                  'parse count (total)',

                  'redo size',

                  'redo writes',

                  'sorts (disk)',

                  'sorts (memory)',

                  'sorts (rows)',

                  'user commits',

                  'user rollbacks',

                  'logons cumulative',

                  'bytes sent via SQL*Net to client',

                  'bytes received via SQL*Net from client')

'''

[[metric]]

context = "tablespace"

labels = [ "tablespace", "type" ]

metricsdesc = { bytes = "Generic counter metric of tablespaces bytes in Oracle.", max_bytes = "Generic counter metric of tablespaces max bytes in Oracle.", free = "Generic counter metric of tablespaces free bytes in Oracle." }

request = '''

SELECT

  df.tablespace_name       as tablespace,

  df.type                  as type,

  nvl(sum(df.bytes),0)     as bytes,

  nvl(sum(df.max_bytes),0) as max_bytes,

  nvl(sum(f.free),0)       as free

FROM

  (

    SELECT

      ddf.file_id,

      dt.contents as type,

      ddf.file_name,

      ddf.tablespace_name,

      TRUNC(ddf.bytes) as bytes,

      TRUNC(GREATEST(ddf.bytes,ddf.maxbytes)) as max_bytes

    FROM

      dba_data_files ddf,

      dba_tablespaces dt

    WHERE ddf.tablespace_name = dt.tablespace_name

  ) df,

  (

    SELECT

      TRUNC(SUM(bytes)) AS free,

      file_id

    FROM dba_free_space

    GROUP BY file_id

  ) f

WHERE df.file_id = f.file_id (+)

GROUP BY df.tablespace_name, df.type

UNION ALL

SELECT

  Y.name                   as tablespace_name,

  Y.type                   as type,

  SUM(Y.bytes)             as bytes,

  SUM(Y.max_bytes)         as max_bytes,

  MAX(nvl(Y.free_bytes,0)) as free

FROM

  (

    SELECT

      dtf.tablespace_name as name,

      dt.contents as type,

      dtf.status as status,

      dtf.bytes as bytes,

      (

        SELECT

          ((f.total_blocks - s.tot_used_blocks)*vp.value)

        FROM

          (SELECT tablespace_name, sum(used_blocks) tot_used_blocks FROM gv$sort_segment WHERE  tablespace_name!='DUMMY' GROUP BY tablespace_name) s,

          (SELECT tablespace_name, sum(blocks) total_blocks FROM dba_temp_files where tablespace_name !='DUMMY' GROUP BY tablespace_name) f,

          (SELECT value FROM v$parameter WHERE name = 'db_block_size') vp

        WHERE f.tablespace_name=s.tablespace_name AND f.tablespace_name = dtf.tablespace_name

      ) as free_bytes,

      CASE

        WHEN dtf.maxbytes = 0 THEN dtf.bytes

        ELSE dtf.maxbytes

      END as max_bytes

    FROM

      sys.dba_temp_files dtf,

      sys.dba_tablespaces dt

    WHERE dtf.tablespace_name = dt.tablespace_name

  ) Y

GROUP BY Y.name, Y.type

ORDER BY tablespace

'''

[[metric]]

context = "db_recovery_file_dest"

metricsdesc = { value="sum(PERCENT_SPACE_USED) of V$RECOVERY_AREA_USAG" }

request = '''

select sum(t.PERCENT_SPACE_USED) as value from V$RECOVERY_AREA_USAGE t

'''

[[metric]]

context = "db_recovery_file_dest"

labels = [ "file_type"]

metricsdesc = { percent_space_used = "percent_space_used of V$RECOVERY_AREA_USAGE ." }

request = '''

select t.file_type,t.percent_space_used from V$RECOVERY_AREA_USAGE t

'''

[[metric]]

context = "rman_status"

metricsdesc = { value= "0 indicates rman error or no config rman job, 1 indicates rman is ok" }

request = '''

select decode(max(t.COMPLETION_TIME),

              '',

              0,

              case when sysdate-max(t.COMPLETION_TIME) > 1 then 0 else 1 end) as value

  from v$backup_piece t

 where t.STATUS = 'A'

'''

[[metric]]

context = "rman_info"

labels = [ "recid","lv_type","controlfile_included","status","device_type","start_time","completion_time","elapsed_seconds","bak_size","compressed","tag" ]

metricsdesc = { value ="list rman information" }

request = '''

select a.recid as recid,

               decode(b.incremental_level,

                      '',

                      decode(backup_type, 'L', 'Archivelog', 'ControlFile'),

                      1,

                      'Incr-1',

                      0,

                      'Incr-0',

                      b.incremental_level) as lv_type,

               b.controlfile_included as controlfile_included,

               decode(a.status,

                      'A',

                      'AVAILABLE',

                      'D',

                      'DELETED',

                      'X',

                      'EXPIRED',

                      'ERROR') as status,

               a.device_type as device_type,

               a.start_time as start_time,

               a.completion_time as completion_time,

               a.elapsed_seconds as elapsed_seconds,

               round(a.bytes / 1024 / 1024 / 1024,3) as bak_size,

               a.compressed as compressed,

               a.tag as tag,

               1 as value

          from v$backup_piece a, v$backup_set b

         where a.set_stamp = b.set_stamp

           and a.deleted = 'NO'

           and a.set_count = b.set_count

           and a.start_time > sysdate-8

         order by a.completion_time desc

'''

[[metric]]

context = "dataguard_exist"

metricsdesc = { value ="1 indicates the presence of dg, 0 indicates no dg." }

request = '''

select decode(db_unique_name, 'NONE', 0, 1) as value

  from v$archive_dest_status

 where dest_name = 'LOG_ARCHIVE_DEST_2'

'''

[[metric]]

context = "dataguard_status"

metricsdesc = { value ="0 indicates no dg, 1 indicates dg has errors, 1 indicates dg is ok;" }

request = '''

select case

         when db_unique_name = 'NONE' then

          0

         when status != 'VALID' then

          1

         else

          decode(recovery_mode,

                 'IDLE',

                 1,

                 'MANAGED',

                 2,

                 'MANAGED REAL TIME APPLY',

                 2,

                 'LOGICAL REAL TIME APPLY',

                 2,

                 'LOGICAL APPLY',

                 2,

                 1)

       end as value

  from v$archive_dest_status

 where dest_name = 'LOG_ARCHIVE_DEST_2'

'''
Grafana监控OracleDB的完整过程的更多相关文章
- cAdvisor+Prometheus+Grafana监控docker
cAdvisor+Prometheus+Grafana监控docker 一.cAdvisor(需要监控的主机都要安装) 官方地址:https://github.com/google/cadvisor ...
- [转帖]Prometheus+Grafana监控Kubernetes
原博客的位置: https://blog.csdn.net/shenhonglei1234/article/details/80503353 感谢原作者 这里记录一下自己试验过程中遇到的问题: . 自 ...
- 快速接入业务监控体系,grafana监控的艺术
做一个系统,如果不做监控,是不完善的. 如果为做一个快速系统,花力气去做监控,是不值得的. 因为,我们有必要具备一个能够快速建立监控体系的能力.即使你只是一个普通开发人员! 个人觉得,做监控有三个核心 ...
- Promethus+Grafana监控解决方案
[MySQL]企业级监控解决方案Promethus+Grafana Promethus用作监控数据采集与处理,而Grafana只是用作数据展示 一.Promethus简介 Prometheus(普罗米 ...
- Prometheus + Grafana 监控系统搭
本文主要介绍基于Prometheus + Grafana 监控Linux服务器. 一.Prometheus 概述(略) 与其他监控系统对比 1 Prometheus vs. Zabbix Zabbix ...
- Prometheus+Grafana监控Kubernetes
涉及文件下载地址:链接:https://pan.baidu.com/s/18XHK7ex_J0rzTtfW-QA2eA 密码:0qn6 文件中需要下载的镜像需要自己提前下载好,eg:prom/node ...
- 字符型图片验证码识别完整过程及Python实现
字符型图片验证码识别完整过程及Python实现 1 摘要 验证码是目前互联网上非常常见也是非常重要的一个事物,充当着很多系统的 防火墙 功能,但是随时OCR技术的发展,验证码暴露出来的安全问题也越 ...
- StartSSL免费SSL证书申请和账户注册完整过程
StartSSL算是比较早提供免费SSL证书的第三方提供商,我们可以免费申请且免费续期使用到有需要HTTPS网址的用户.关于网站使用SSL证书主要还是因为谷歌在向导说明中提到如果一个网站使用到SSL证 ...
- 转: 数字证书原理 https 完整过程解析
点评: 讲的非常的详细与全面,值得一看. 转: http://www.cnblogs.com/JeffreySun/archive/2010/06/24/1627247.html 文中首先解释了加密解 ...
- Docker部署Zabbix+Grafana监控
Docker部署Zabbix+Grafana监控 环境 centos 7 ; Docker 17.12.0-ce ; docker-compose version 1.20.1 2018-4-1 当前 ...
随机推荐
- 日常Bug排查-应用Commit报错事务并没有回滚
日常Bug排查-应用Commit报错事务并没有回滚 前言 日常Bug排查系列都是一些简单Bug排查,笔者将在这里介绍一些排查Bug的简单技巧,同时顺便积累素材_. 应用Commit报错并不一定回滚 事 ...
- 一图看懂华为云CodeArts Link六大特性
本文分享自华为云社区<一图看懂华为云CodeArts Link六大特性,带你体验一站式跨平台数据互联>,作者:华为云PaaS服务小智 . 能够打破不同研发工具之间的壁垒,实现数据的无缝集成 ...
- 云小课|云小课带你玩转可视化分析ELB日志
阅识风云是华为云信息大咖,擅长将复杂信息多元化呈现,其出品的一张图(云图说).深入浅出的博文(云小课)或短视频(云视厅)总有一款能让您快速上手华为云.更多精彩内容请单击此处. 云日志服务支持可视化查看 ...
- GaussDB NoSQL架构设计分享
摘要:文章总结了当前数据库的发展趋势.GaussDB NoSQL关键技术解密以及核心竞争力. 本文分享自华为云社区<华为云GaussDB NoSQL云原生多模数据库的超融合实践>,作者:华 ...
- 华为云VSS漏洞扫描服务之开源组件漏洞检测能力
摘要:华为云VSS漏洞扫描服务提供针对于Web.主机和软件包的漏洞检测能力. 近日Apache Log4j2漏洞持续发酵,已成为中国互联网2021年年底前最大的安全事件.华为云VSS漏洞扫描服务,提供 ...
- storybook 编写stories的story基础语法
编写 stories story 用于展示组件某个状态,每个组件可以包含任意多个 story,用来测试组件的各种场景.根据默认配置,只需要在组件的文件夹中,以 **.component.stories ...
- Mybatis 模块拆份带来的 Mapper 扫描问题
项目中,两个模块中都放了 Mapper,如下所示 @MapperScan(basePackages ={"com.vipsoft.his.mapper","com.vip ...
- Java ZIP文件解压
Java ZIP文件解压 备忘笔记 代码: private byte[] unZip(byte[] data) { byte[] bArr = null; try { ByteArrayInputSt ...
- LaTex常用数学符号整理
在论文和博客的写作中,经常会用到Latex的语法来书写数学公式,一份详细的数学符号对照表必不可少,本文重写了部分 Markdown 公式指导手册 . 在线Latex公式编辑器 -1.求和积分的上下标位 ...
- Educational Codeforces Round 93 (Rated for Div. 2)
Educational Codeforces Round 93 (Rated for Div. 2) A. Bad Triangle input 3 7 4 6 11 11 15 18 20 4 10 ...