Zabbix系列之五——监控TCP端口
监控端口的几个主要Keys:
|
net.tcp.listen[port] |
Checks if this port is in LISTEN state. 0 - it is not, 1 - it is in LISTEN state. 监控TCP端口是否监听 |
|
net.tcp.port[<ip>,port] |
Check, if it is possible to make TCP connection to the port number. 0 - cannot connect, 1 - can connect. IP address is optional. If ip is missing, 127.0.0.1 is used. Example: net.tcp.port[,80] 检查TCP端口是否可以正常连接。 |
|
net.tcp.service[service,<ip>,<port>] |
Check if service is available. 0 - service is down, 1 - service is running. If ip is missing 127.0.0.1 is used. If port number is missing, default service port is used. Example: net.tcp.service[ftp,,45]. 检查服务是否可用,FTP服务可直接使用FTP模板 |
|
net.tcp.service.perf[service,<ip>,<port>] |
Check performance of service "service". 0 - service is down, sec - number of seconds spent on connection to the service. If ip is missing 127.0.0.1 is used. If port number is missing, default service port is used. 监控服务(端口)连接性能 |
|
net.udp.listen[port] |
Checks if this port is in LISTEN state. 0 - it is not, 1 - it is in LISTEN state. 监控UDP端口是否监听(不支持windows) |
说明:Zabbix自带单独服务检测模板,如Template App FTP Service,就是使用的ket.tcp.service[ftp]这个KEY来监控的。
模板如下,可根据需求修改端口及触发器名称:
<?xml version="1.0" encoding="UTF-8"?>
<zabbix_export>
<version>3.4</version>
<date>2018-06-19T06:10:48Z</date>
<groups>
<group>
<name>Tcp Port</name>
</group>
</groups>
<templates>
<template>
<template>Template Tcp Port 4234</template>
<name>Template Tcp Port 4234</name>
<description/>
<groups>
<group>
<name>Tcp Port</name>
</group>
</groups>
<applications>
<application>
<name>Tcp Port Monitor</name>
</application>
</applications>
<items>
<item>
<name>tcp port 4234 is listen</name>
<type>0</type>
<snmp_community/>
<snmp_oid/>
<key>net.tcp.listen[4234]</key>
<delay>30s</delay>
<history>90d</history>
<trends>365d</trends>
<status>0</status>
<value_type>3</value_type>
<allowed_hosts/>
<units/>
<snmpv3_contextname/>
<snmpv3_securityname/>
<snmpv3_securitylevel>0</snmpv3_securitylevel>
<snmpv3_authprotocol>0</snmpv3_authprotocol>
<snmpv3_authpassphrase/>
<snmpv3_privprotocol>0</snmpv3_privprotocol>
<snmpv3_privpassphrase/>
<params/>
<ipmi_sensor/>
<authtype>0</authtype>
<username/>
<password/>
<publickey/>
<privatekey/>
<port/>
<description/>
<inventory_link>0</inventory_link>
<applications>
<application>
<name>Tcp Port Monitor</name>
</application>
</applications>
<valuemap/>
<logtimefmt/>
<preprocessing/>
<jmx_endpoint/>
<master_item/>
</item>
<item>
<name>tcp port 4234 is connection</name>
<type>0</type>
<snmp_community/>
<snmp_oid/>
<key>net.tcp.port[,4234]</key>
<delay>30s</delay>
<history>90d</history>
<trends>365d</trends>
<status>0</status>
<value_type>3</value_type>
<allowed_hosts/>
<units/>
<snmpv3_contextname/>
<snmpv3_securityname/>
<snmpv3_securitylevel>0</snmpv3_securitylevel>
<snmpv3_authprotocol>0</snmpv3_authprotocol>
<snmpv3_authpassphrase/>
<snmpv3_privprotocol>0</snmpv3_privprotocol>
<snmpv3_privpassphrase/>
<params/>
<ipmi_sensor/>
<authtype>0</authtype>
<username/>
<password/>
<publickey/>
<privatekey/>
<port/>
<description/>
<inventory_link>0</inventory_link>
<applications>
<application>
<name>Tcp Port Monitor</name>
</application>
</applications>
<valuemap/>
<logtimefmt/>
<preprocessing/>
<jmx_endpoint/>
<master_item/>
</item>
<item>
<name>tcp port 4234 performance</name>
<type>0</type>
<snmp_community/>
<snmp_oid/>
<key>net.tcp.service.perf[http,,4234]</key>
<delay>30s</delay>
<history>90d</history>
<trends>365d</trends>
<status>0</status>
<value_type>0</value_type>
<allowed_hosts/>
<units/>
<snmpv3_contextname/>
<snmpv3_securityname/>
<snmpv3_securitylevel>0</snmpv3_securitylevel>
<snmpv3_authprotocol>0</snmpv3_authprotocol>
<snmpv3_authpassphrase/>
<snmpv3_privprotocol>0</snmpv3_privprotocol>
<snmpv3_privpassphrase/>
<params/>
<ipmi_sensor/>
<authtype>0</authtype>
<username/>
<password/>
<publickey/>
<privatekey/>
<port/>
<description/>
<inventory_link>0</inventory_link>
<applications>
<application>
<name>Tcp Port Monitor</name>
</application>
</applications>
<valuemap/>
<logtimefmt/>
<preprocessing/>
<jmx_endpoint/>
<master_item/>
</item>
<item>
<name>tcp port 4234 is running</name>
<type>0</type>
<snmp_community/>
<snmp_oid/>
<key>net.tcp.service[http,,4234]</key>
<delay>30s</delay>
<history>90d</history>
<trends>365d</trends>
<status>0</status>
<value_type>3</value_type>
<allowed_hosts/>
<units/>
<snmpv3_contextname/>
<snmpv3_securityname/>
<snmpv3_securitylevel>0</snmpv3_securitylevel>
<snmpv3_authprotocol>0</snmpv3_authprotocol>
<snmpv3_authpassphrase/>
<snmpv3_privprotocol>0</snmpv3_privprotocol>
<snmpv3_privpassphrase/>
<params/>
<ipmi_sensor/>
<authtype>0</authtype>
<username/>
<password/>
<publickey/>
<privatekey/>
<port/>
<description/>
<inventory_link>0</inventory_link>
<applications>
<application>
<name>Tcp Port Monitor</name>
</application>
</applications>
<valuemap/>
<logtimefmt/>
<preprocessing/>
<jmx_endpoint/>
<master_item/>
</item>
</items>
<discovery_rules/>
<httptests/>
<macros/>
<templates/>
<screens/>
</template>
</templates>
<triggers>
<trigger>
<expression>{Template Tcp Port 4234:net.tcp.listen[4234].last()}=0</expression>
<recovery_mode>0</recovery_mode>
<recovery_expression/>
<name>tcp port 4234(Paypre) is down</name>
<correlation_mode>0</correlation_mode>
<correlation_tag/>
<url/>
<status>0</status>
<priority>5</priority>
<description/>
<type>0</type>
<manual_close>0</manual_close>
<dependencies/>
<tags/>
</trigger>
</triggers>
<graphs>
<graph>
<name>tcp port 4234</name>
<width>900</width>
<height>200</height>
<yaxismin>0.0000</yaxismin>
<yaxismax>100.0000</yaxismax>
<show_work_period>1</show_work_period>
<show_triggers>1</show_triggers>
<type>0</type>
<show_legend>1</show_legend>
<show_3d>0</show_3d>
<percent_left>0.0000</percent_left>
<percent_right>0.0000</percent_right>
<ymin_type_1>0</ymin_type_1>
<ymax_type_1>0</ymax_type_1>
<ymin_item_1>0</ymin_item_1>
<ymax_item_1>0</ymax_item_1>
<graph_items>
<graph_item>
<sortorder>0</sortorder>
<drawtype>0</drawtype>
<color>1A7C11</color>
<yaxisside>0</yaxisside>
<calc_fnc>2</calc_fnc>
<type>0</type>
<item>
<host>Template Tcp Port 4234</host>
<key>net.tcp.port[,4234]</key>
</item>
</graph_item>
<graph_item>
<sortorder>1</sortorder>
<drawtype>0</drawtype>
<color>F63100</color>
<yaxisside>0</yaxisside>
<calc_fnc>2</calc_fnc>
<type>0</type>
<item>
<host>Template Tcp Port 4234</host>
<key>net.tcp.listen[4234]</key>
</item>
</graph_item>
<graph_item>
<sortorder>2</sortorder>
<drawtype>0</drawtype>
<color>2774A4</color>
<yaxisside>0</yaxisside>
<calc_fnc>2</calc_fnc>
<type>0</type>
<item>
<host>Template Tcp Port 4234</host>
<key>net.tcp.service[http,,4234]</key>
</item>
</graph_item>
<graph_item>
<sortorder>3</sortorder>
<drawtype>0</drawtype>
<color>A54F10</color>
<yaxisside>0</yaxisside>
<calc_fnc>2</calc_fnc>
<type>0</type>
<item>
<host>Template Tcp Port 4234</host>
<key>net.tcp.service.perf[http,,4234]</key>
</item>
</graph_item>
</graph_items>
</graph>
</graphs>
</zabbix_export>
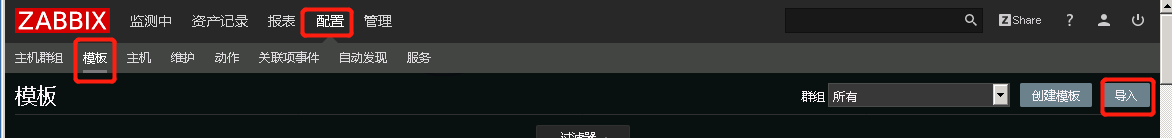
导入模板
【配置】——【模板】——【导入】
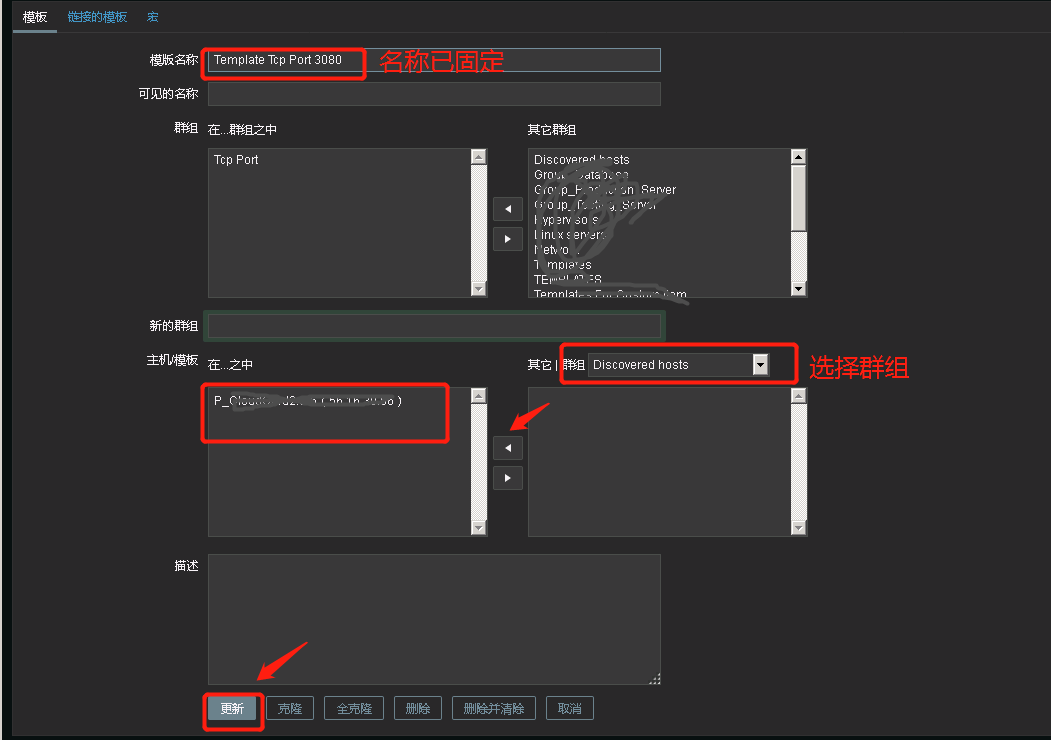
进入模板添加主机

设置被监控主机
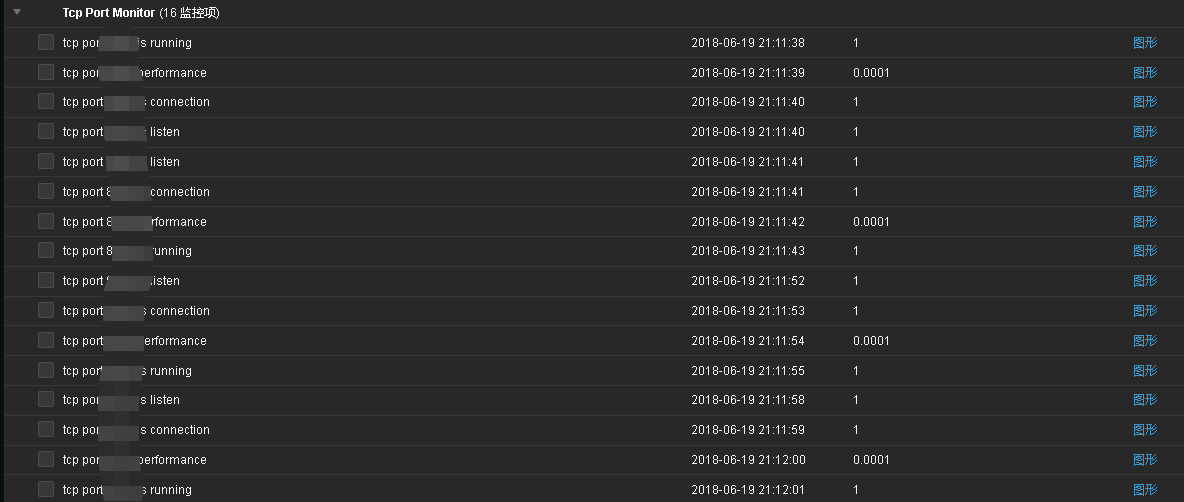
查看效果
Zabbix系列之五——监控TCP端口的更多相关文章
- zabbix自定义模板——监控TCP连接状态
TCP十二种连接状态说明 可以使用man netstat查看 LISTEN - 侦听来自远方TCP端口的连接请求: SYN-SENT -在发送连接请求后等待匹配的连接请求: SYN-RECEIVED ...
- zabbix自动发现监控远程端口
zabbix监控远程服务器端口,simple checks是zabbix用来监控无agent的主机 脚本和模板地址: https://github.com/mikeluwen/tcpmonitor
- zabbix系列 ~ mongo监控相关
,一 简介: 我们来谈谈mongo的监控二 核心命令 rs.status() 关注复制集群是否健康 db.serverStatus() 关注实例整体性能三 目标解读 主要来解读下db. ...
- zabbix系列 ~ 自动监控多实例功能
一 场景 监控mongo的多实例端口二 目标 定制一套模板,根据不同的端口进行批量监控项的生成三 步骤 1 编写py脚本实现端口josin化输出,以便zabbix_server能进行识别 ...
- zabbix系列之监控类型及方式
http://www.ttlsa.com/zabbix/how-to-chose-zabbix-item-type/ zabbix提供十几种监控类型: 监控类型 特性 备注 Zabbix agent ...
- zabbix系列之五——安装后配置一
https://www.zabbix.com/documentation/3.4/manual/appliance Configuration 1Hosts and host groups Overv ...
- zabbix系列 ~ linux监控相关
Linux 监控 一 相关名词解释 cpu context switch (上下文切换) 1 定义 CPU给每个任务一定的服务时间,当时间片轮转的时候,需要把当前状态保存下来,同时加载下一个 ...
- zabbix监控tcp连接并发数
第一步,想在zabbix的web监控tcp连接数,那么要看zabbix-server的版本和zabbix-agent版本是否一致,不然TCP-status图没有数据 也会报错.下图就是版本不符合报错的 ...
- zabbix Server 4.0 监控TCP的12种状态
zabbix Server 4.0 监控TCP的12种状态 作者:尹正杰 版权声明:原创作品,谢绝转载!否则将追究法律责任. 大家对TCP三次握手比较熟悉了,都知道当发生DOSS攻击时,客户端发送 ...
随机推荐
- pycharm:terminal中显示乱码的解决方式
pycharm:terminal中显示乱码的解决方式
- ibatis中的resultMap
优点: resultMap可以实现一种功能 当你是1对多 这种多张表查询的时候 你没办法 通过表连接来实现一个集合设置到一个实例里,但是通过resultMap里可以做到 根据关联的字段 查询到一个集合 ...
- dubbo入门学习 一SOA
SOA是什么?SOA全英文是Service-Oriented Architecture,中文意思是中文面向服务编程,是一种思想,一种方法论,一种分布式的服务架构(具体可以百度). 用途:SOA解决多服 ...
- table增删改查操作--jq
<!doctype html> <html> <head> <meta charset="utf-8"> <title> ...
- 信息安全技能树(SecWiki中Web安全工程师职位建议)
职位描述: 对公司网站.业务系统进行安全评估测试(黑盒.白盒测试): 对公司各类系统进行安全加固: 对公司安全事件进行响应,清理后门,根据日志分析攻击途径: 安全技术研究,包括安全防范技术,黑客技术等 ...
- Android逆向破解表单注册程序
Android逆向破解表单注册程序 Android开发 ADT: android studio(as) 程序界面如下,注册码为6位随机数字,注册成功时弹出通知注册成功,注册失败时弹出通知注册失败. 布 ...
- expdp错误案例
转自:https://www.cnblogs.com/kerrycode/p/3960328.html Oracle数据泵(Data Dump)使用过程当中经常会遇到一些奇奇怪怪的错误案例,下面总结一 ...
- windows系统中配置多版本anaconda
1.最好从国内的镜像站下载anaconda,国外那个站实在是太慢了,清华开源软件镜像站(https://mirrors.tuna.tsinghua.edu.cn/help/anaconda/) 2.如 ...
- easyui时的时间格式yyyy-MM-dd与yyyy-MM-ddd HH:mm:ss
easyui日期的转换,日期汉化导入:<script type="text/javascript" src="../easyui/locale/easyui-lan ...
- 31.Stack
在Java中Stack类表示后进先出(LIFO)的对象堆栈.栈是一种非常常见的数据结构,它采用典型的先进后出的操作方式完成的.每一个栈都包含一个栈顶,每次出栈是将栈顶的数据取出,如下: Stack通过 ...