
Python 005- 使用Pyecharts来绘制各种各样的图形
本文转载自:https://blog.csdn.net/qq_39143076/article/details/79065448,如有侵权,请联系删除啊
如何做Python 的数据可视化?
pyecharts 是一个用于生成 Echarts 图表的类库。 Echarts 是百度开源的一个数据可视化 JS 库。主要用于数据可视化。
一、安装
pyecharts 兼容 Python2 和 Python3。目前版本为 0.1.4
pip install pyecharts
二、入门
首先开始来绘制你的第一个图表
frompyecharts importBarbar =Bar("我的第一个图表", "这里是副标题")bar.add("服装", ["衬衫", "羊毛衫", "雪纺衫", "裤子", "高跟鞋", "袜子"], [5, 20, 36, 10, 75, 90])bar.show_config()bar.render()
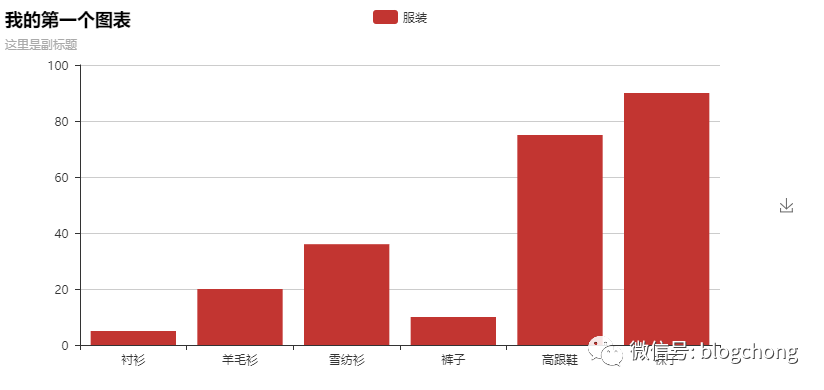
Tip:可以按右边的下载按钮将图片下载到本地
add()
主要方法,用于添加图表的数据和设置各种配置项
show_config()
打印输出图表的所有配置项
render()
默认将会在根目录下生成一个 render.html 的文件,支持 path 参数,设置文件保存位置,如 render(r"e:my_first_chart.html"),文件用浏览器打开。
默认的编码类型为 UTF-8,在 Python3 中是没什么问题的,Python3 对中文的支持好很多。但是在 Python2 中,编码的处理是个很头疼的问题,暂时没能找到完美的解决方法,目前只能通过文本编辑器自己进行二次编码,我用的是 Visual Studio Code,先通过 Gbk 编码重新打开,然后再用 UTF-8 重新保存,这样用浏览器打开的话就不会出现中文乱码问题了。
基本上所有的图表类型都是这样绘制的:
chart_name = Type() 初始化具体类型图表。
add() 添加数据及配置项。
render() 生成 .html 文件。
三、图表类型
因篇幅原因,这里只给出了每种图表类型的示例(代码 + 生成图表),目的是为了引起读者的兴趣。详细参数的介绍请参考项目 README.md 文档
1 Bar(柱状图/条形图)
frompyecharts importBarbar =Bar("标记线和标记点示例")bar.add("商家A", attr, v1, mark_point=["average"])bar.add("商家B", attr, v2, mark_line=["min", "max"])bar.render()
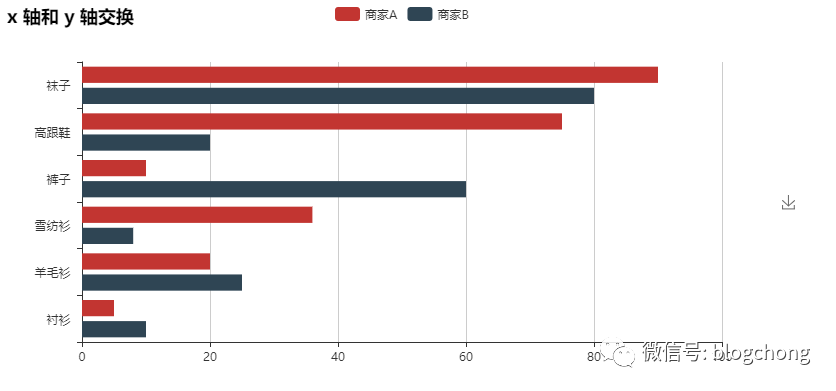
frompyecharts importBarbar =Bar("x 轴和 y 轴交换")bar.add("商家A", attr, v1)bar.add("商家B", attr, v2, is_convert=True)bar.render()
2 EffectScatter(带有涟漪特效动画的散点图)
frompyecharts importEffectScatterv1 =[10, 20, 30, 40, 50, 60]v2 =[25, 20, 15, 10, 60, 33]es =EffectScatter("动态散点图示例")es.add("effectScatter", v1, v2)es.render()
es =EffectScatter("动态散点图各种图形示例")es.add("", [10], [10], symbol_size=20, effect_scale=3.5, effect_period=3, symbol="pin")es.add("", [20], [20], symbol_size=12, effect_scale=4.5, effect_period=4,symbol="rect")es.add("", [30], [30], symbol_size=30, effect_scale=5.5, effect_period=5,symbol="roundRect")es.add("", [40], [40], symbol_size=10, effect_scale=6.5, effect_brushtype='fill',symbol="diamond")es.add("", [50], [50], symbol_size=16, effect_scale=5.5, effect_period=3,symbol="arrow")es.add("", [60], [60], symbol_size=6, effect_scale=2.5, effect_period=3,symbol="triangle")es.render()

3 Funnel(漏斗图)
frompyecharts importFunnelattr =["衬衫", "羊毛衫", "雪纺衫", "裤子", "高跟鞋", "袜子"]value =[20, 40, 60, 80, 100, 120]funnel =Funnel("漏斗图示例")funnel.add("商品", attr, value, is_label_show=True, label_pos="inside", label_text_color="#fff")funnel.render()
4 Gauge(仪表盘)
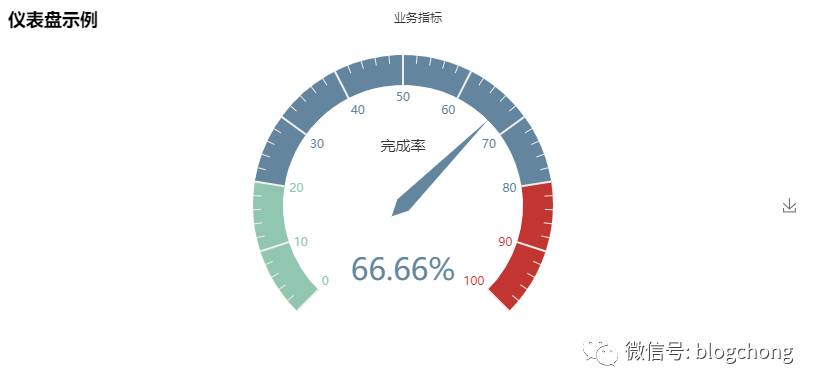
frompyecharts importGaugegauge =Gauge("仪表盘示例")gauge.add("业务指标", "完成率", 66.66)gauge.show_config()gauge.render()
5 Geo(地理坐标系)
frompyecharts importGeodata =[ ("海门", 9),("鄂尔多斯", 12),("招远", 12),("舟山", 12),("齐齐哈尔", 14),("盐城", 15), ("赤峰", 16),("青岛", 18),("乳山", 18),("金昌", 19),("泉州", 21),("莱西", 21), ("日照", 21),("胶南", 22),("南通", 23),("拉萨", 24),("云浮", 24),("梅州", 25)...]geo =Geo("全国主要城市空气质量", "data from pm2.5", title_color="#fff", title_pos="center",width=1200, height=600, background_color='#404a59')attr, value =geo.cast(data)geo.add("", attr, value, visual_range=[0, 200], visual_text_color="#fff", symbol_size=15, is_visualmap=True)geo.show_config()geo.render()
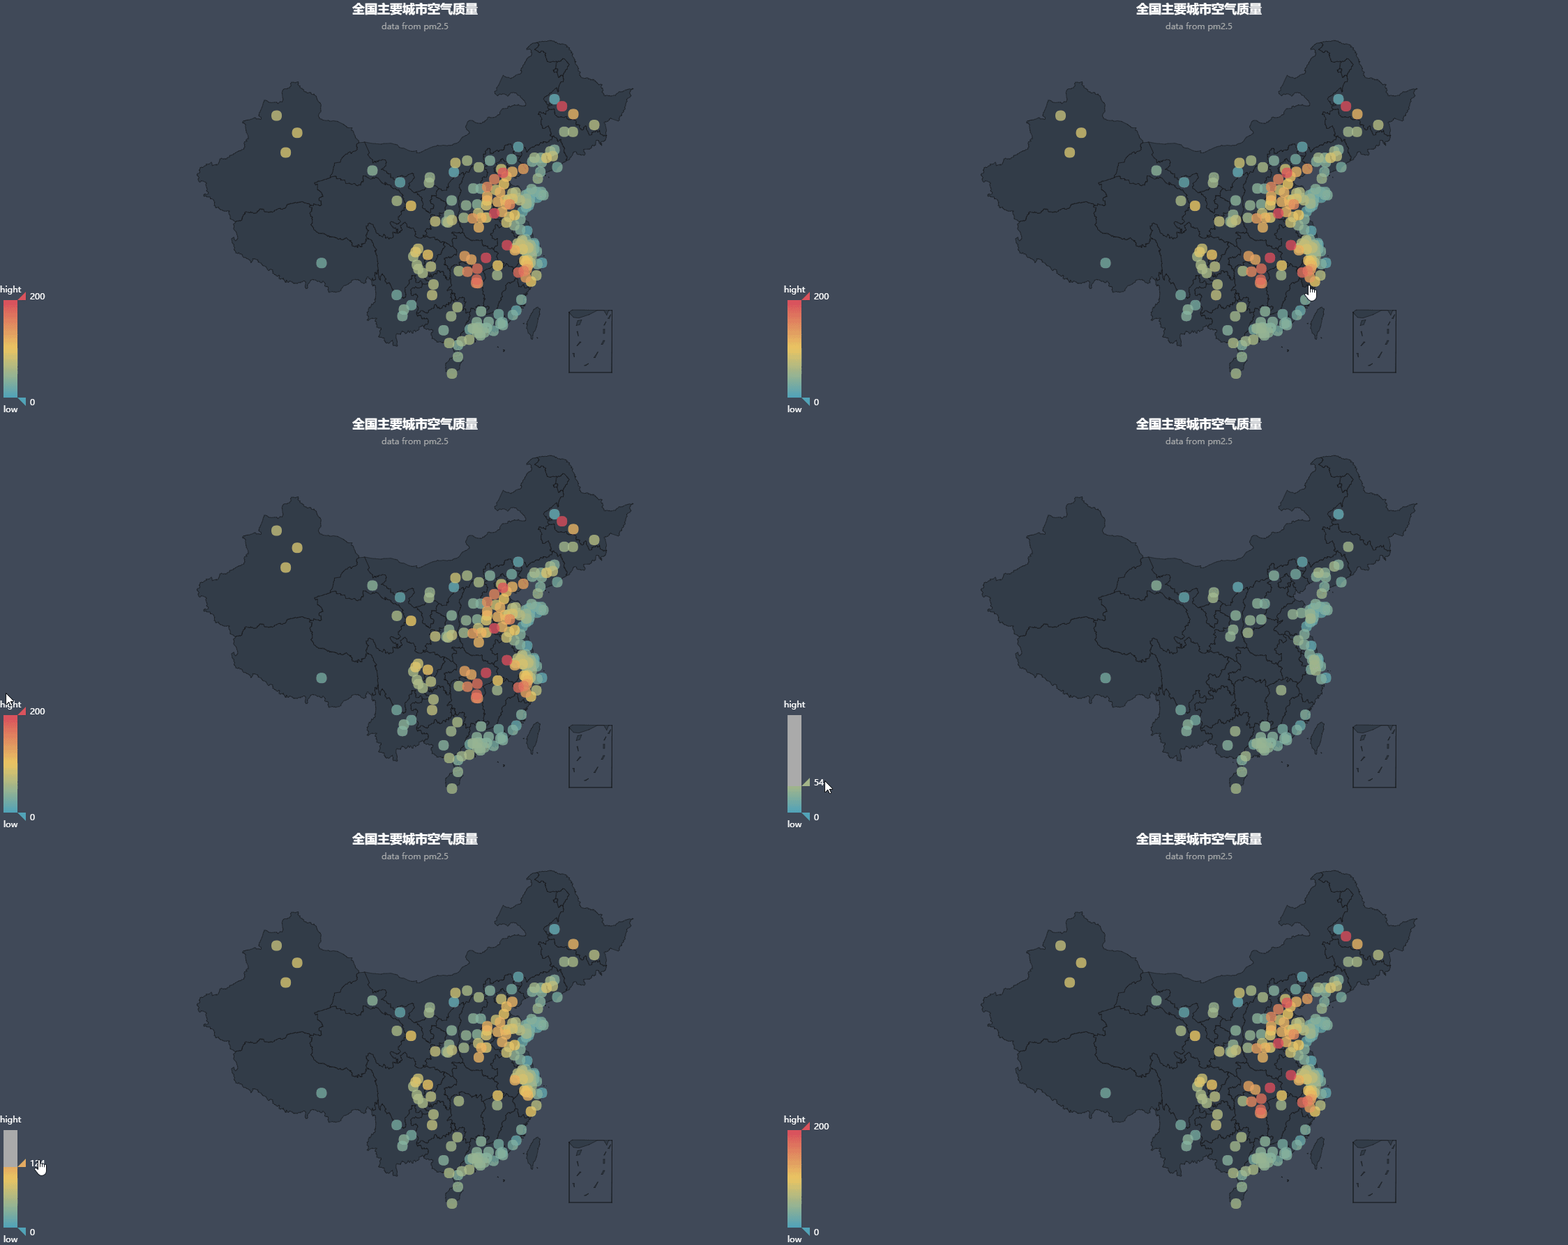
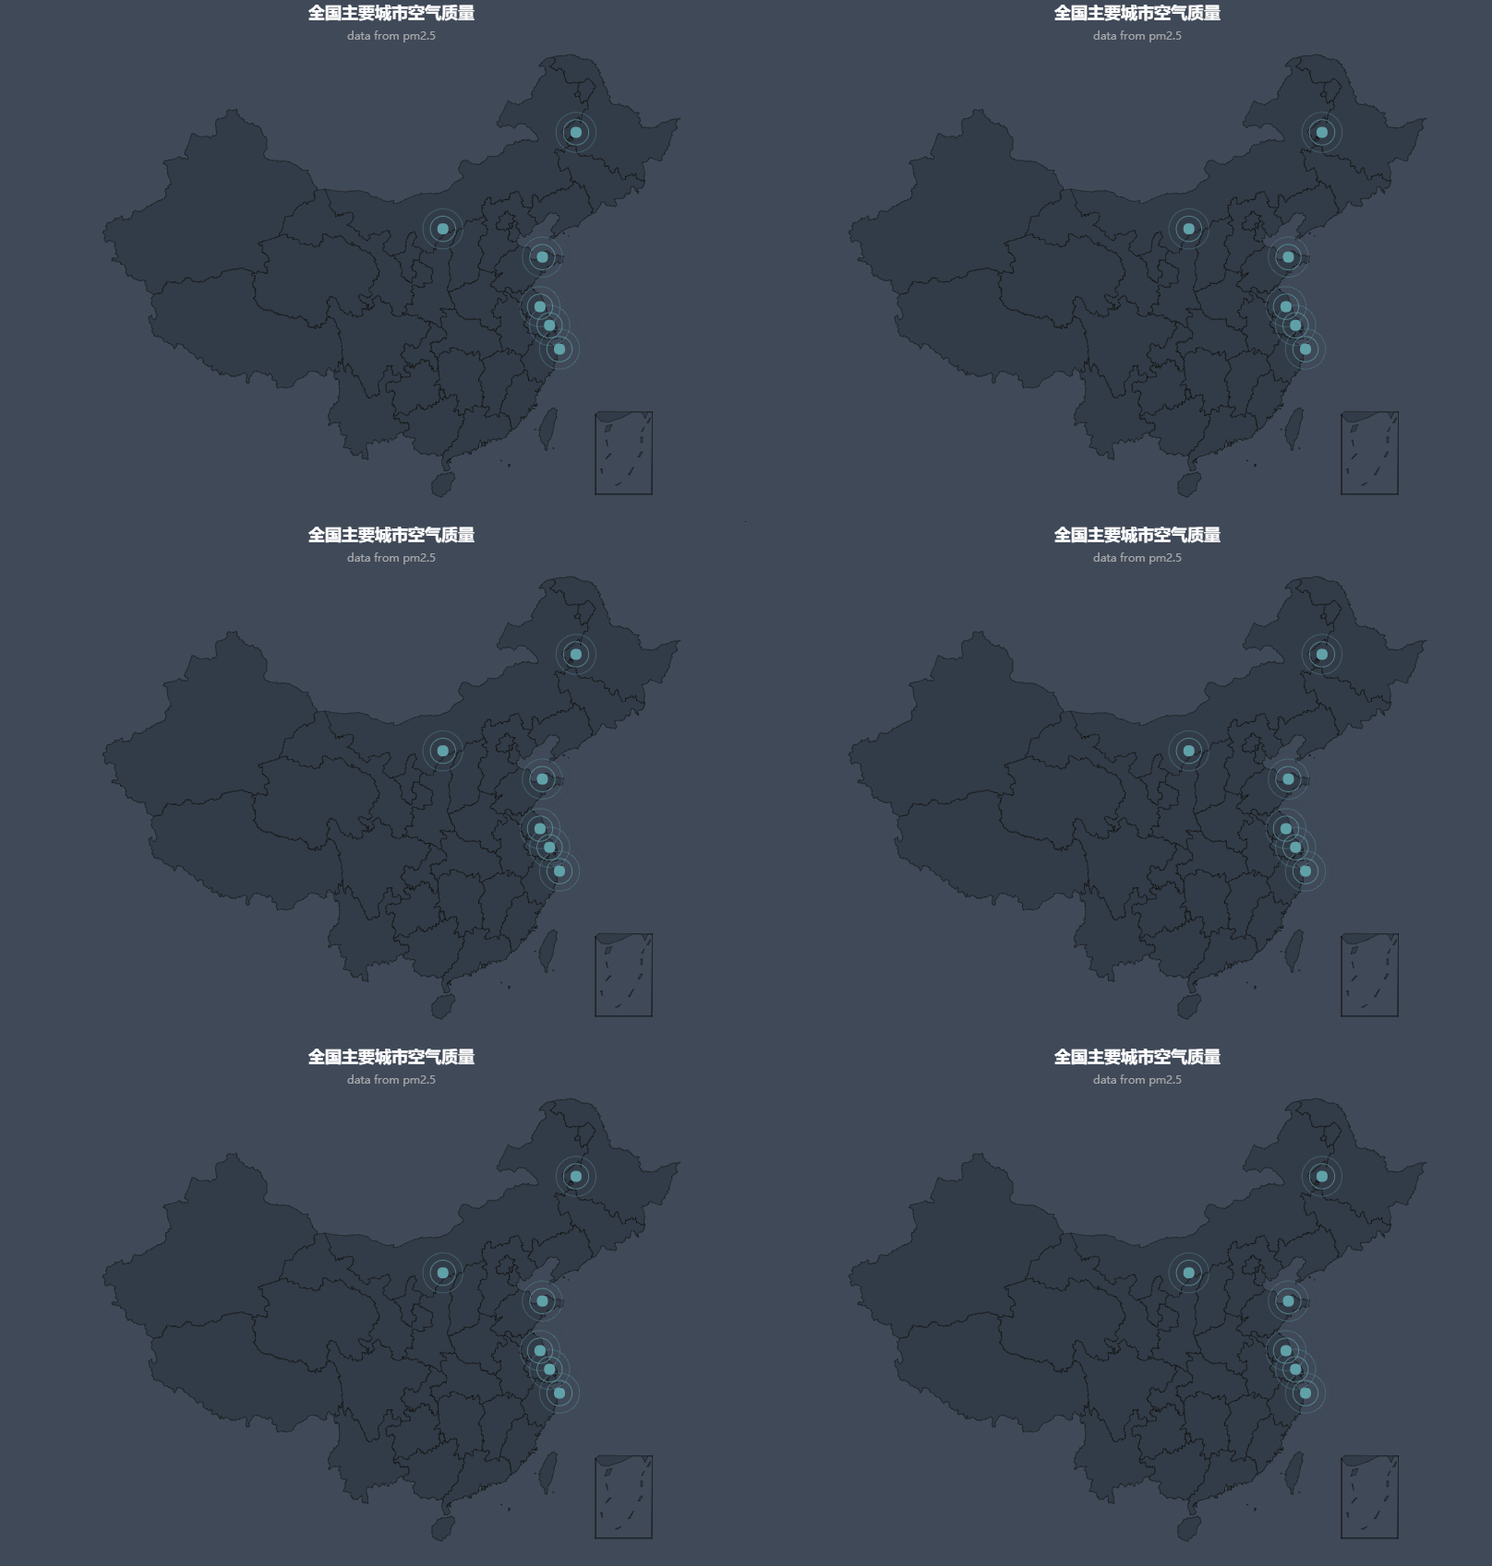
frompyecharts importGeodata =[("海门", 9), ("鄂尔多斯", 12), ("招远", 12), ("舟山", 12), ("齐齐哈尔", 14), ("盐城", 15)]geo =Geo("全国主要城市空气质量", "data from pm2.5", title_color="#fff", title_pos="center", width=1200, height=600, background_color='#404a59')attr, value =geo.cast(data)geo.add("", attr, value, type="effectScatter", is_random=True, effect_scale=5)geo.show_config()geo.render()
6 Graph(关系图)
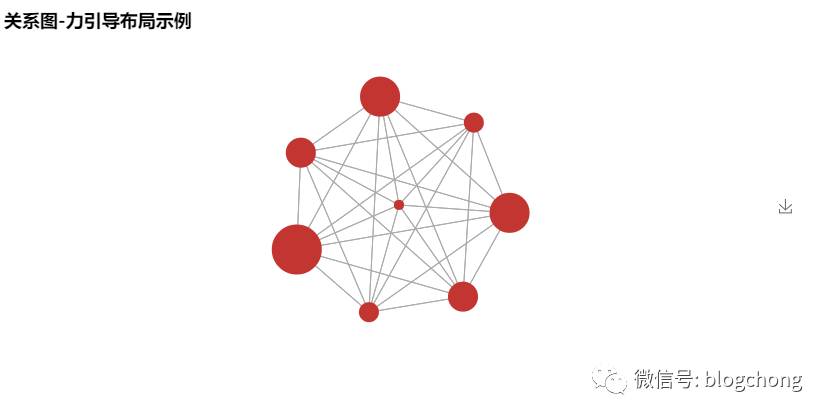
frompyecharts importGraphnodes =[{"name": "结点1", "symbolSize": 10}, {"name": "结点2", "symbolSize": 20}, {"name": "结点3", "symbolSize": 30}, {"name": "结点4", "symbolSize": 40}, {"name": "结点5", "symbolSize": 50}, {"name": "结点6", "symbolSize": 40}, {"name": "结点7", "symbolSize": 30}, {"name": "结点8", "symbolSize": 20}]links =[]fori innodes: forj innodes: links.append({"source": i.get('name'), "target": j.get('name')})graph =Graph("关系图-环形布局示例")graph.add("", nodes, links, is_label_show=True, repulsion=8000, layout='circular', label_text_color=None)graph.show_config()graph.render()
frompyecharts importGraphimportjsonwithopen("..jsonweibo.json", "r", encoding="utf-8") asf: j =json.load(f) nodes, links, categories, cont, mid, userl =jgraph =Graph("微博转发关系图", width=1200, height=600)graph.add("", nodes, links, categories, label_pos="right", repulsion=50, is_legend_show=False, line_curve=0.2, label_text_color=None)graph.show_config()graph.render()

7 Line(折线/面积图)
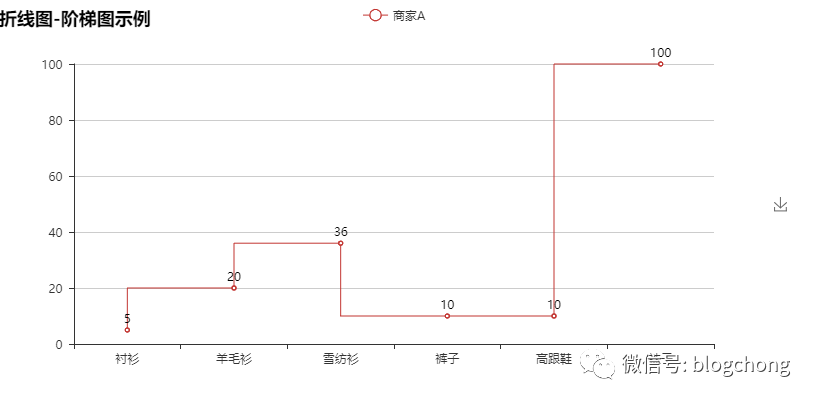
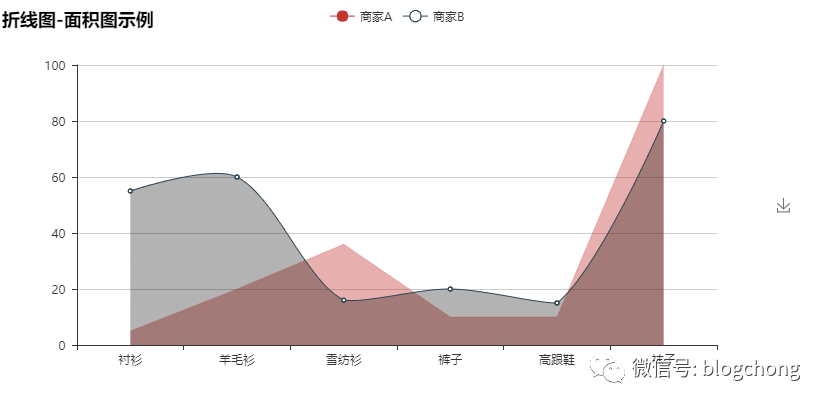
frompyecharts importLineattr =["衬衫", "羊毛衫", "雪纺衫", "裤子", "高跟鞋", "袜子"]v1 =[5, 20, 36, 10, 10, 100]v2 =[55, 60, 16, 20, 15, 80]line =Line("折线图示例")line.add("商家A", attr, v1, mark_point=["average"])line.add("商家B", attr, v2, is_smooth=True, mark_line=["max", "average"])line.show_config()line.render()
line =Line("折线图-阶梯图示例")line.add("商家A", attr, v1, is_step=True, is_label_show=True)line.show_config()line.render()
line =Line("折线图-面积图示例")line.add("商家A", attr, v1, is_fill=True, line_opacity=0.2, area_opacity=0.4, symbol=None)line.add("商家B", attr, v2, is_fill=True, area_color='#000', area_opacity=0.3, is_smooth=True)line.show_config()line.render()
8 Liquid(水球图)
frompyecharts importLiquidliquid =Liquid("水球图示例")liquid.add("Liquid", [0.6])liquid.show_config()liquid.render()
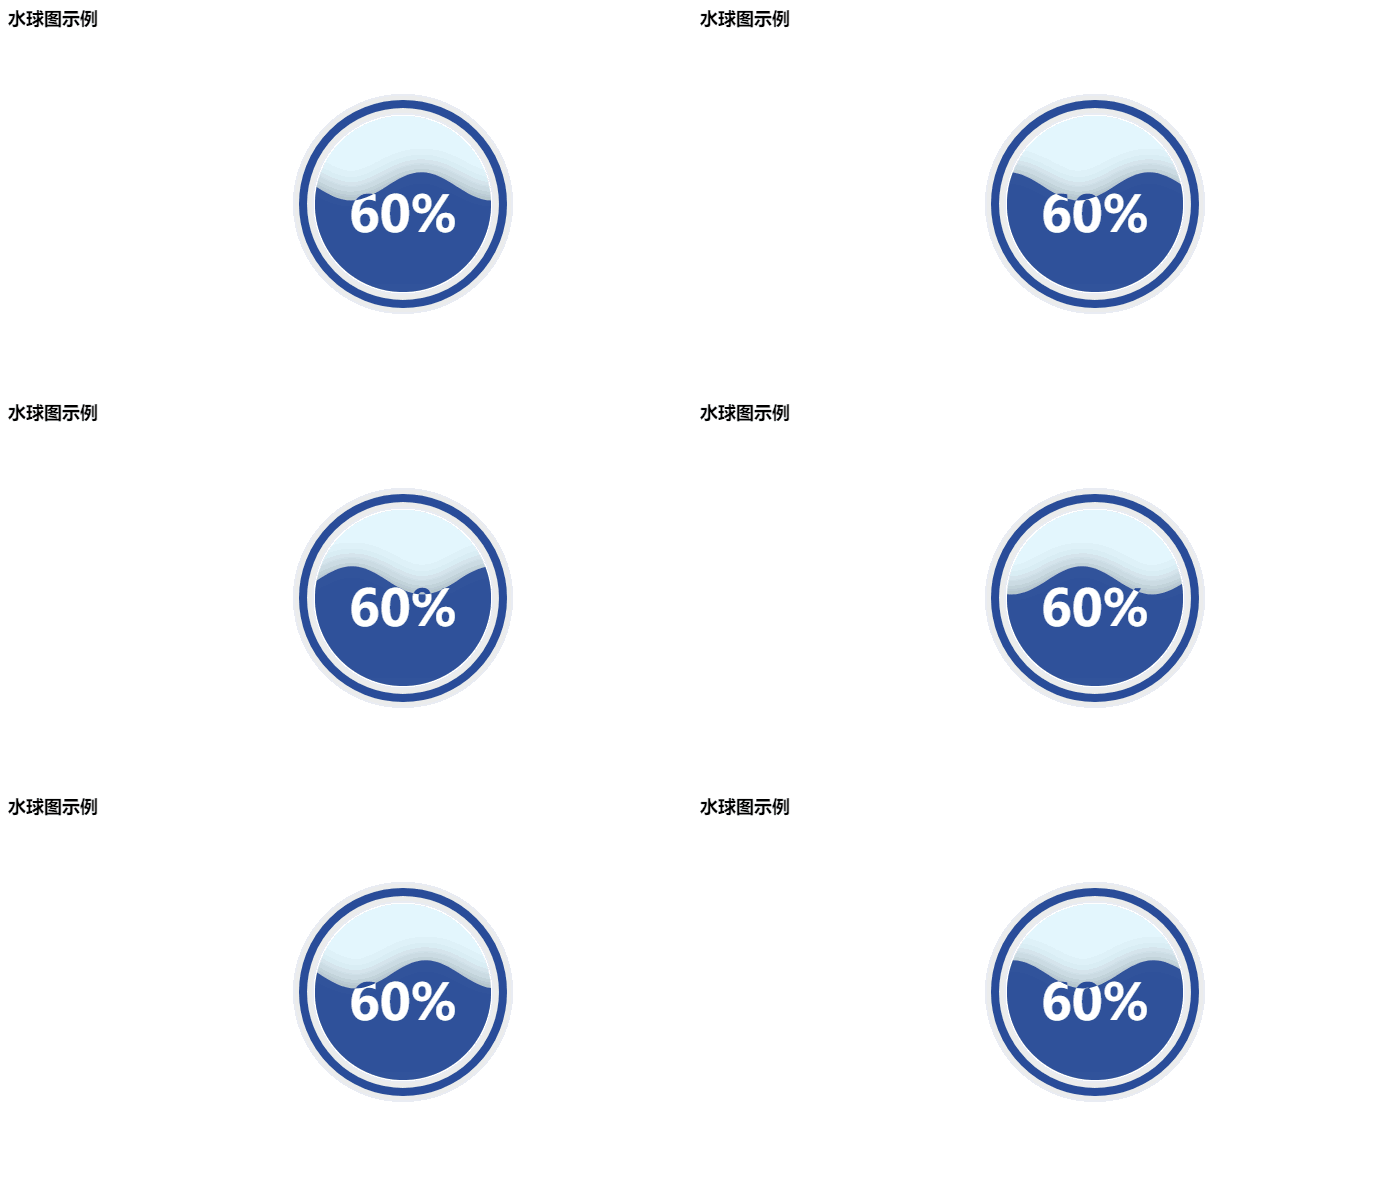
frompyecharts importLiquidliquid =Liquid("水球图示例")liquid.add("Liquid", [0.6, 0.5, 0.4, 0.3], is_liquid_outline_show=False)liquid.show_config()liquid.render()
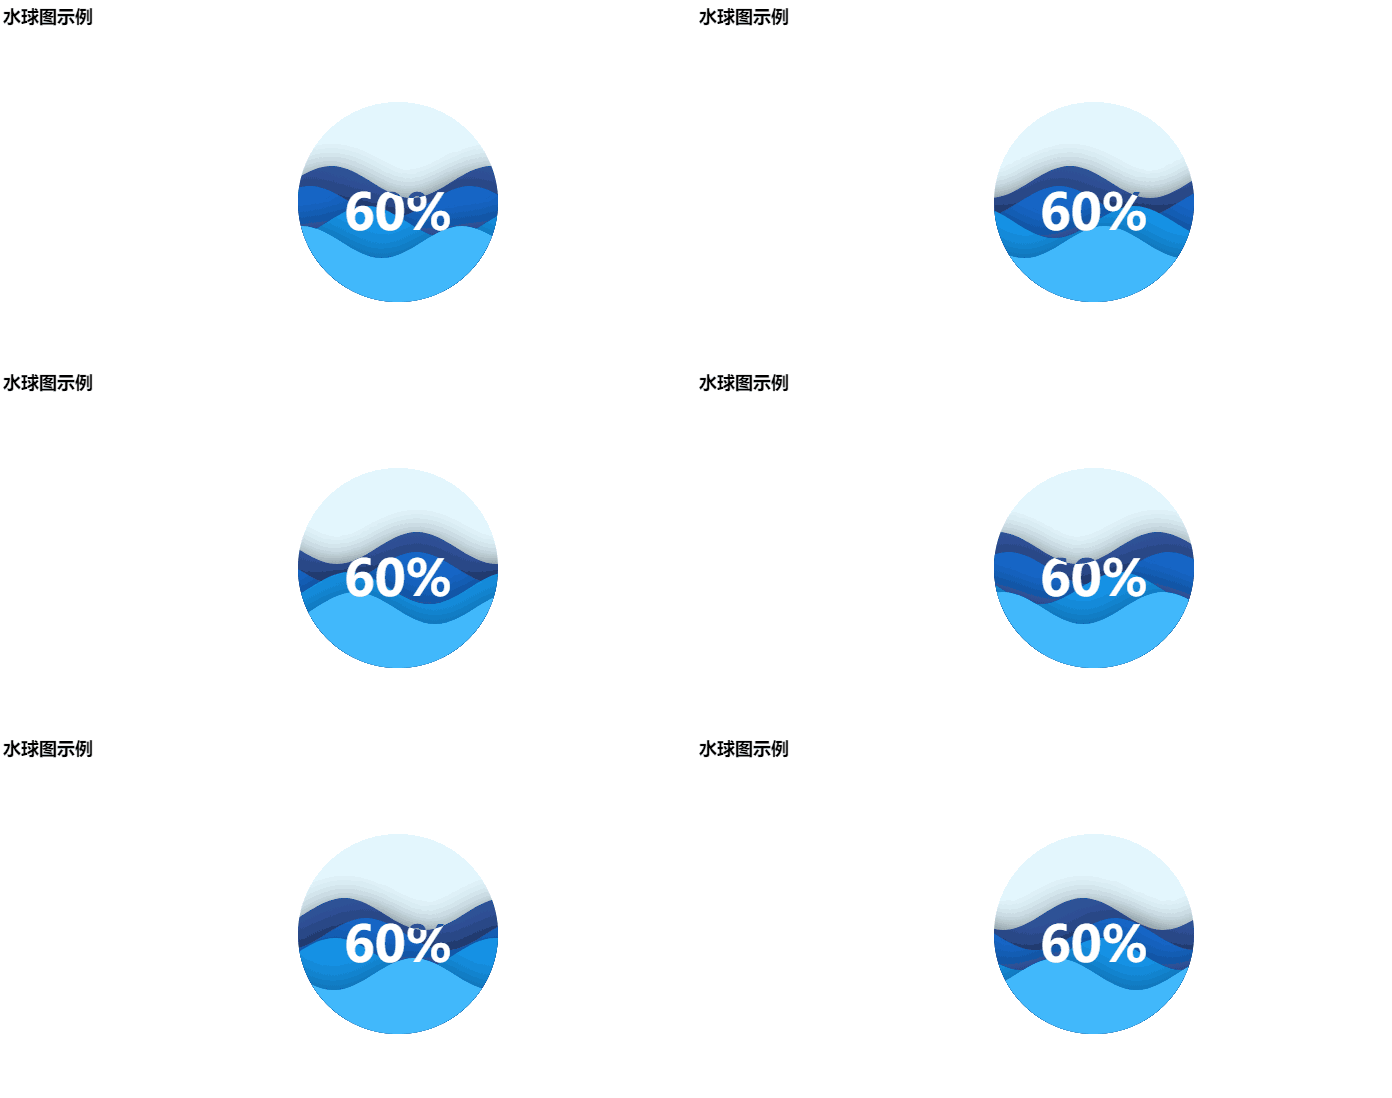
frompyecharts importLiquidliquid =Liquid("水球图示例")liquid.add("Liquid", [0.6, 0.5, 0.4, 0.3], is_liquid_animation=False, shape='diamond')liquid.show_config()liquid.render()

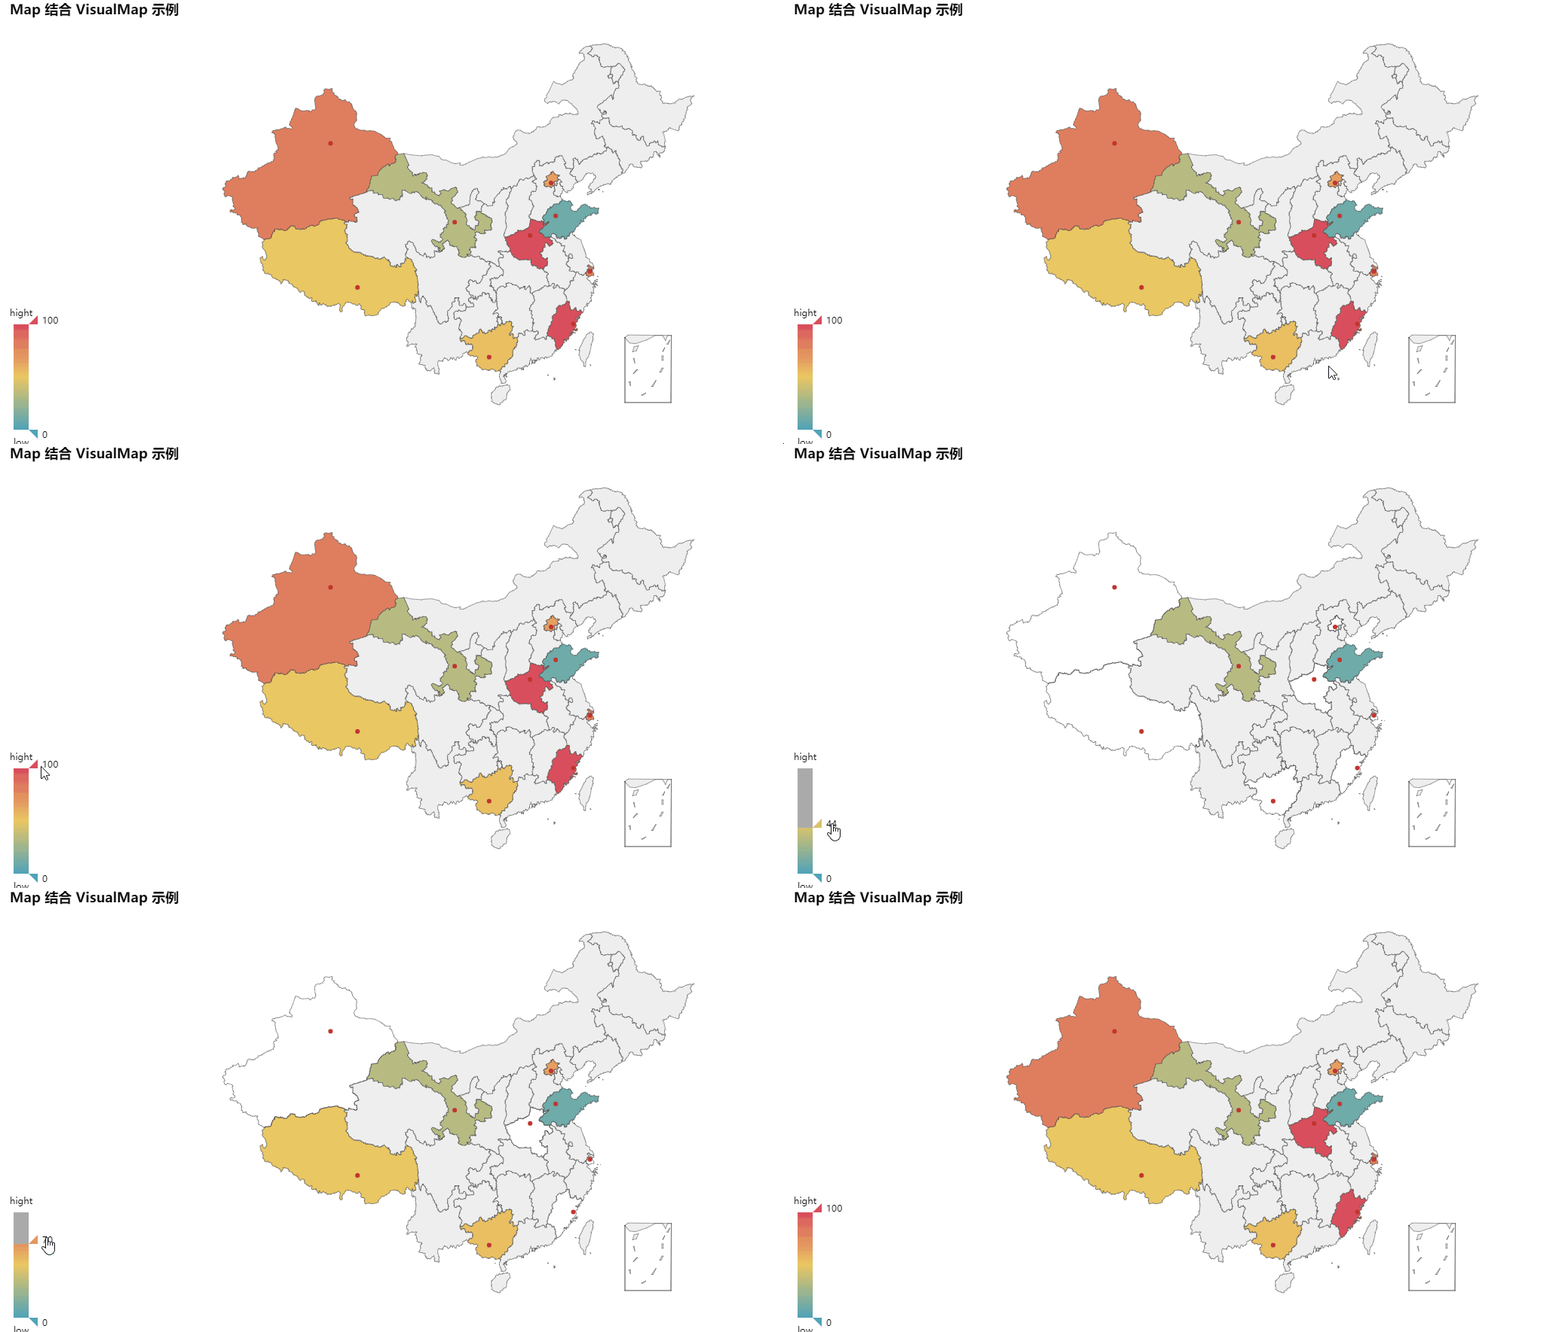
9 Map(地图)
frompyecharts importMapvalue =[155, 10, 66, 78, 33, 80, 190, 53, 49.6]attr =["福建", "山东", "北京", "上海", "甘肃", "新疆", "河南", "广西", "西藏"]map=Map("Map 结合 VisualMap 示例", width=1200, height=600)map.add("", attr, value, maptype='china', is_visualmap=True, visual_text_color='#000')map.show_config()map.render()
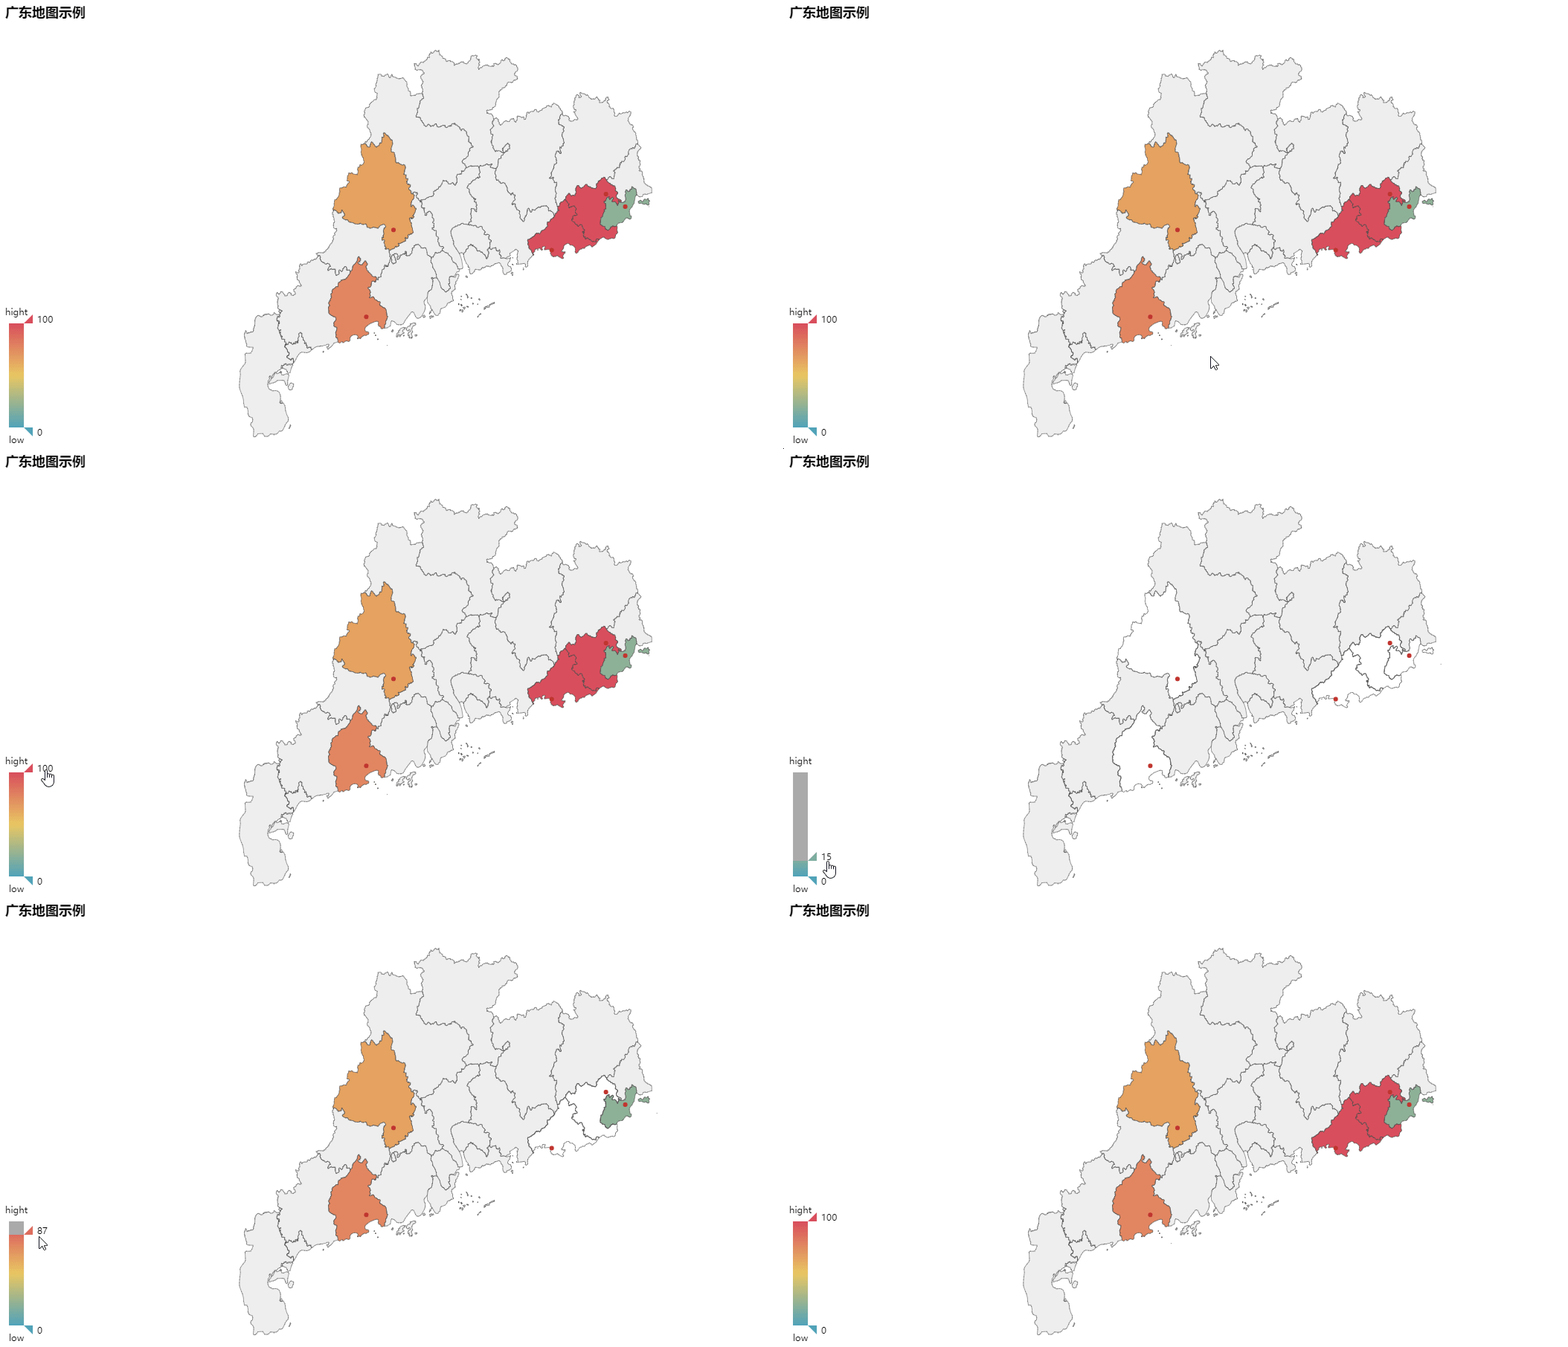
frompyecharts importMapvalue =[20, 190, 253, 77, 65]attr =['汕头市', '汕尾市', '揭阳市', '阳江市', '肇庆市']map=Map("广东地图示例", width=1200, height=600)map.add("", attr, value, maptype='广东', is_visualmap=True, visual_text_color='#000')map.show_config()map.render()
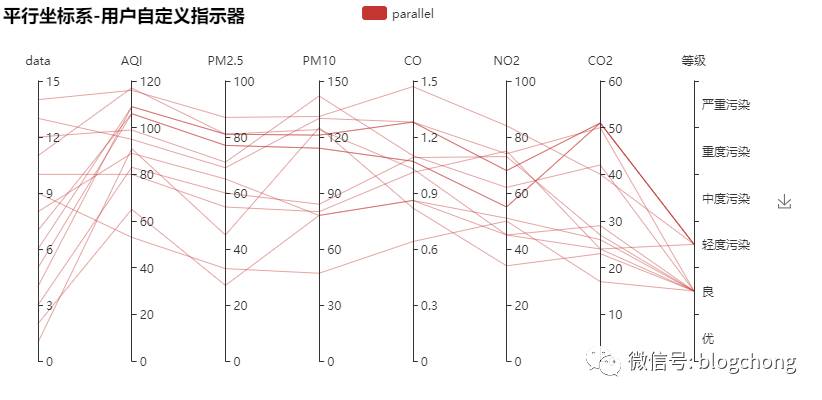
10 Parallel(平行坐标系)
frompyecharts importParallelc_schema =[ {"dim": 0, "name": "data"}, {"dim": 1, "name": "AQI"}, {"dim": 2, "name": "PM2.5"}, {"dim": 3, "name": "PM10"}, {"dim": 4, "name": "CO"}, {"dim": 5, "name": "NO2"}, {"dim": 6, "name": "CO2"}, {"dim": 7, "name": "等级", "type": "category", "data": ['优', '良', '轻度污染', '中度污染', '重度污染', '严重污染']}]data =[ [1, 91, 45, 125, 0.82, 34, 23, "良"], [2, 65, 27, 78, 0.86, 45, 29, "良"], [3, 83, 60, 84, 1.09, 73, 27, "良"], [4, 109, 81, 121, 1.28, 68, 51, "轻度污染"], [5, 106, 77, 114, 1.07, 55, 51, "轻度污染"], [6, 109, 81, 121, 1.28, 68, 51, "轻度污染"], [7, 106, 77, 114, 1.07, 55, 51, "轻度污染"], [8, 89, 65, 78, 0.86, 51, 26, "良"], [9, 53, 33, 47, 0.64, 50, 17, "良"], [10, 80, 55, 80, 1.01, 75, 24, "良"], [11, 117, 81, 124, 1.03, 45, 24, "轻度污染"], [12, 99, 71, 142, 1.1, 62, 42, "良"], [13, 95, 69, 130, 1.28, 74, 50, "良"], [14, 116, 87, 131, 1.47, 84, 40, "轻度污染"]]parallel =Parallel("平行坐标系-用户自定义指示器")parallel.config(c_schema=c_schema)parallel.add("parallel", data)parallel.show_config()parallel.render()
11 Pie(饼图)
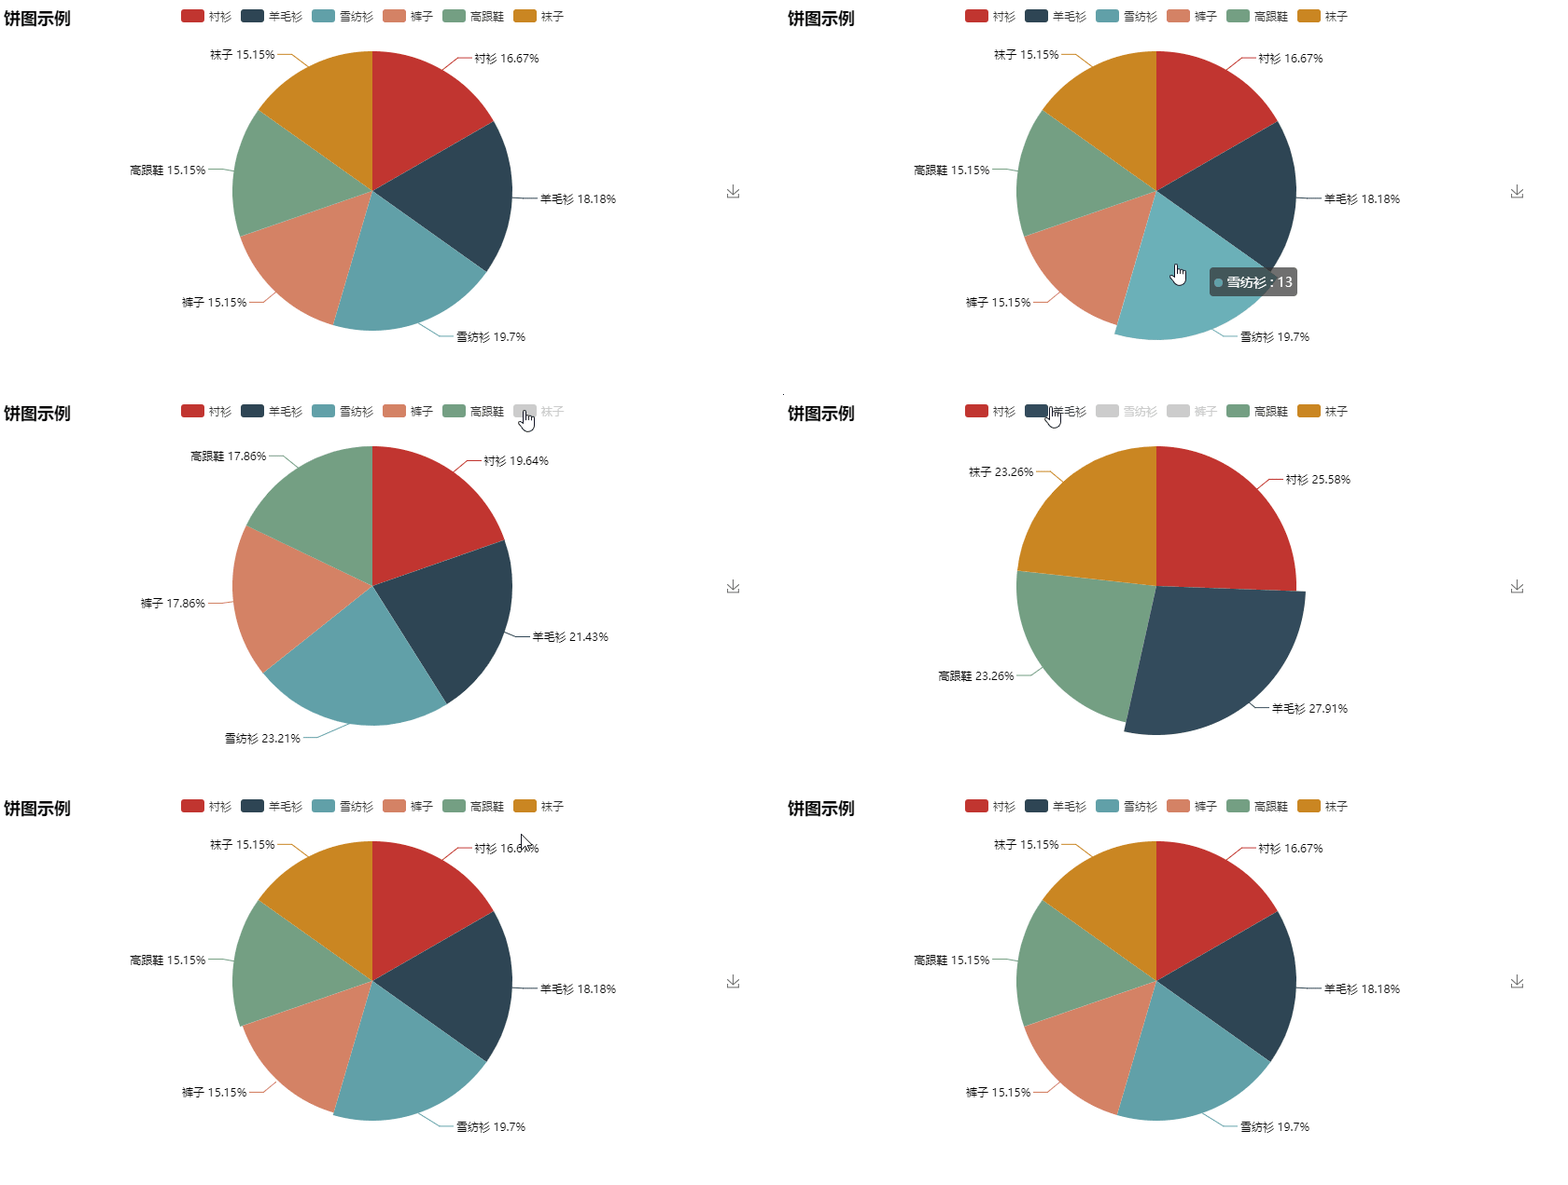
frompyecharts importPieattr =["衬衫", "羊毛衫", "雪纺衫", "裤子", "高跟鞋", "袜子"]v1 =[11, 12, 13, 10, 10, 10]pie =Pie("饼图示例")pie.add("", attr, v1, is_label_show=True)pie.show_config()pie.render()
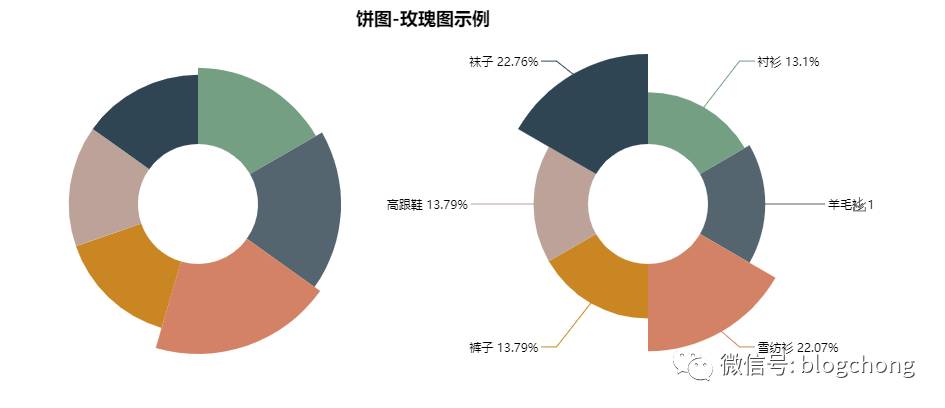
frompyecharts importPieattr =["衬衫", "羊毛衫", "雪纺衫", "裤子", "高跟鞋", "袜子"]v1 =[11, 12, 13, 10, 10, 10]v2 =[19, 21, 32, 20, 20, 33]pie =Pie("饼图-玫瑰图示例", title_pos='center', width=900)pie.add("商品A", attr, v1, center=[25, 50], is_random=True, radius=[30, 75], rosetype='radius')pie.add("商品B", attr, v2, center=[75, 50], is_random=True, radius=[30, 75], rosetype='area', is_legend_show=False, is_label_show=True)pie.show_config() pie.render()
12 Polar(极坐标系)
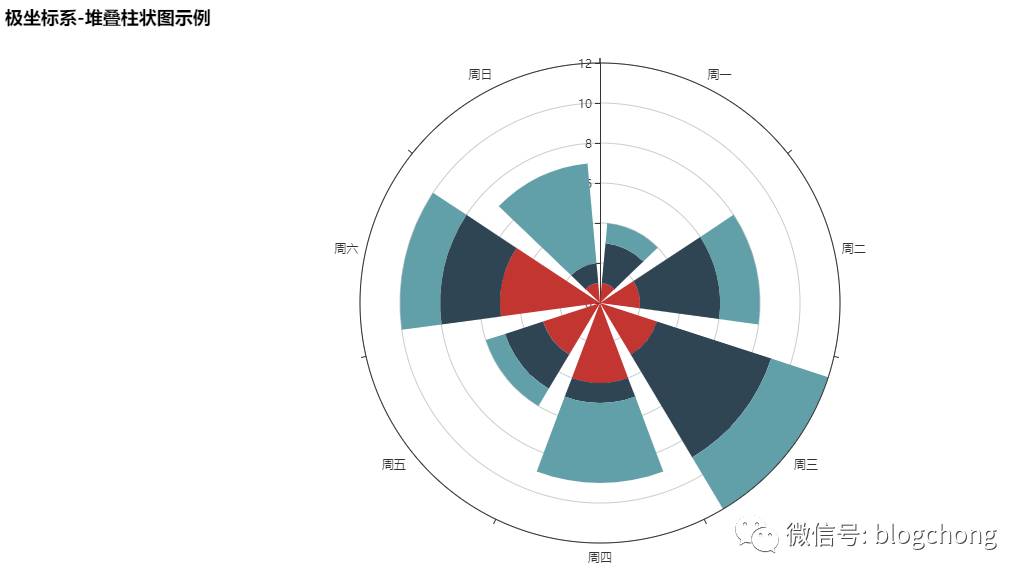
frompyecharts importPolarradius =['周一', '周二', '周三', '周四', '周五', '周六', '周日']polar =Polar("极坐标系-堆叠柱状图示例", width=1200, height=600)polar.add("A", [1, 2, 3, 4, 3, 5, 1], radius_data=radius, type='barRadius', is_stack=True)polar.add("B", [2, 4, 6, 1, 2, 3, 1], radius_data=radius, type='barRadius', is_stack=True)polar.add("C", [1, 2, 3, 4, 1, 2, 5], radius_data=radius, type='barRadius', is_stack=True)polar.show_config()polar.render()
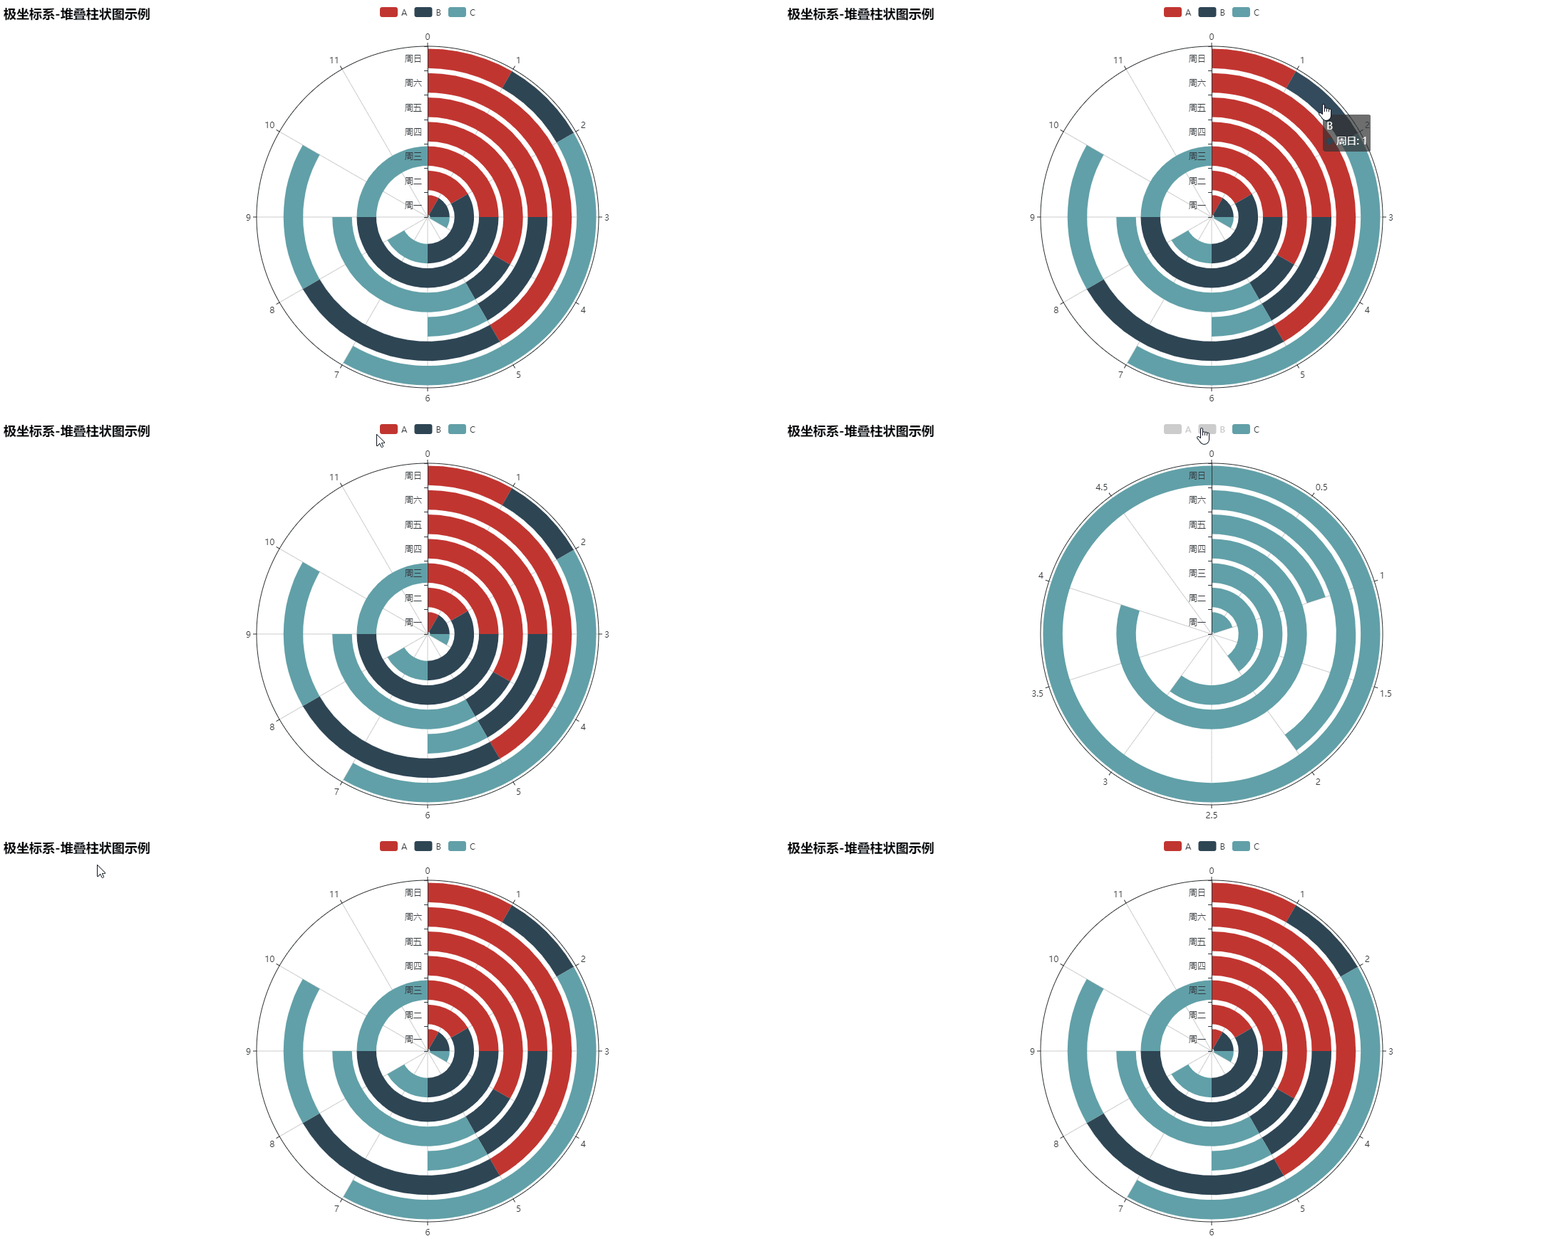
frompyecharts importPolarradius =['周一', '周二', '周三', '周四', '周五', '周六', '周日']polar =Polar("极坐标系-堆叠柱状图示例", width=1200, height=600)polar.add("", [1, 2, 3, 4, 3, 5, 1], radius_data=radius, type='barAngle', is_stack=True)polar.add("", [2, 4, 6, 1, 2, 3, 1], radius_data=radius, type='barAngle', is_stack=True)polar.add("", [1, 2, 3, 4, 1, 2, 5], radius_data=radius, type='barAngle', is_stack=True)polar.show_config()polar.render()
13 Radar(雷达图)
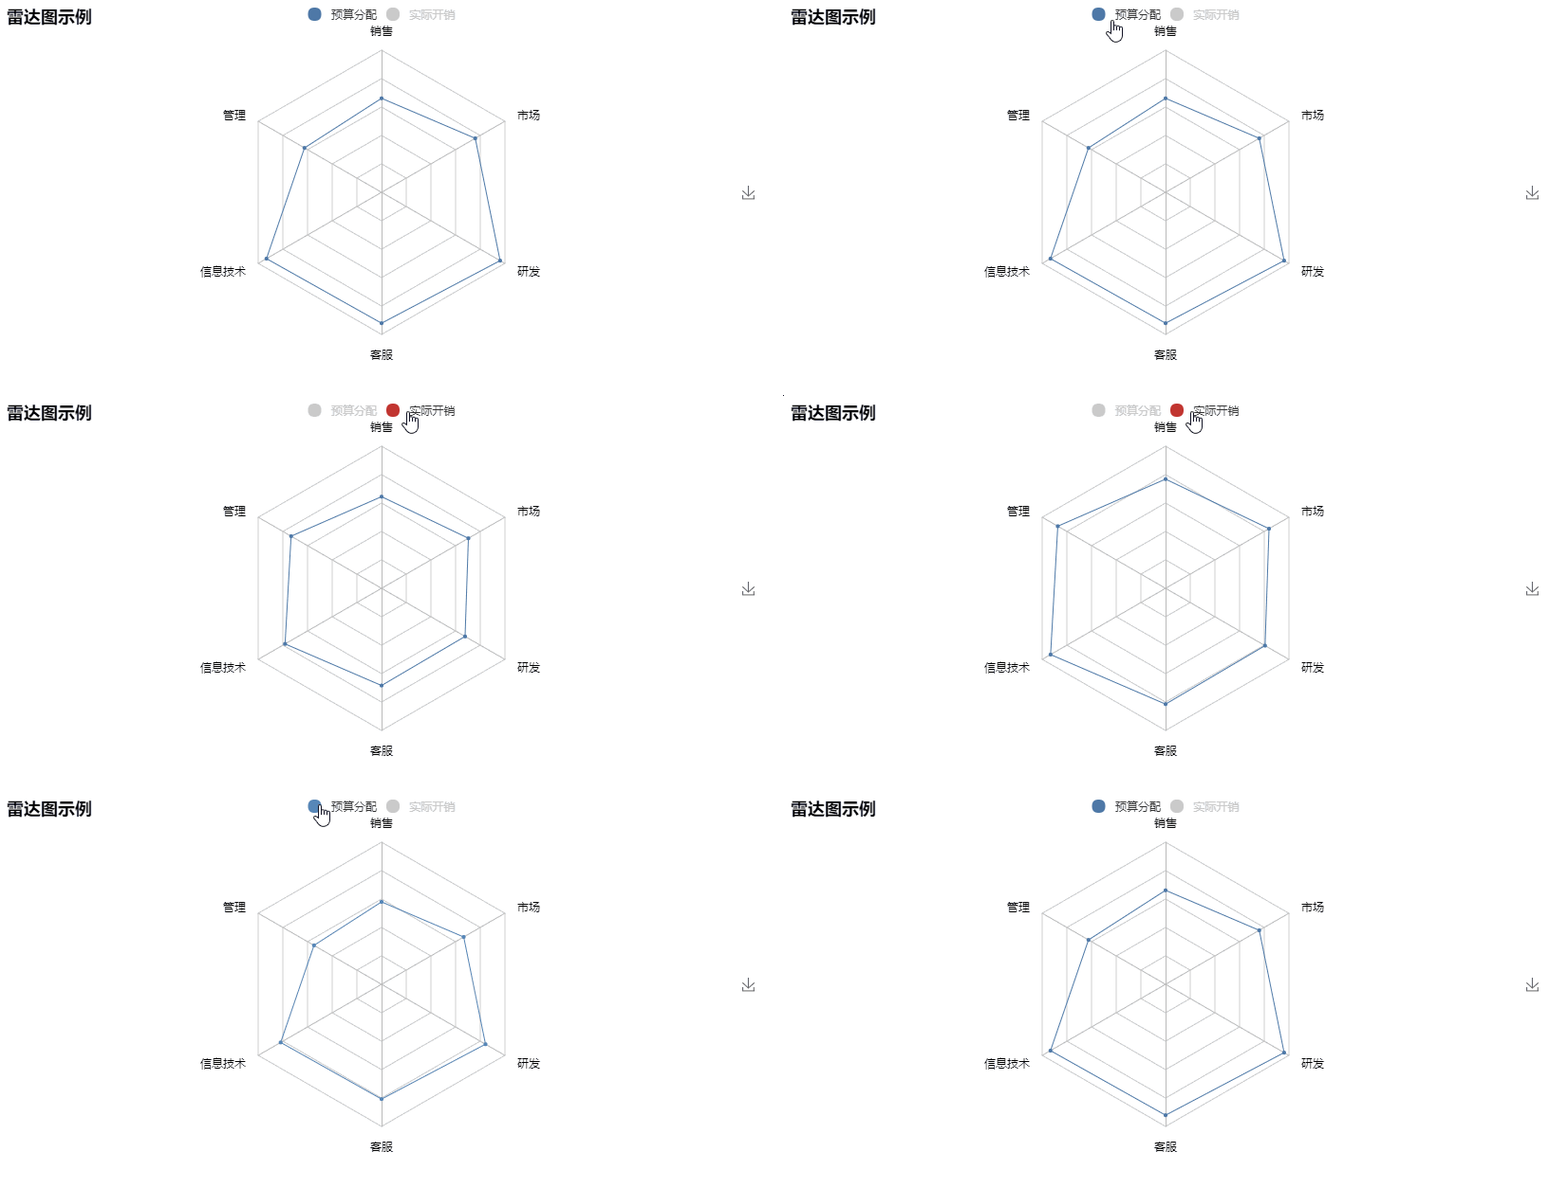
frompyecharts importRadarschema =[ ("销售", 6500), ("管理", 16000), ("信息技术", 30000), ("客服", 38000), ("研发", 52000), ("市场", 25000)]v1 =[[4300, 10000, 28000, 35000, 50000, 19000]]v2 =[[5000, 14000, 28000, 31000, 42000, 21000]]radar =Radar()radar.config(schema)radar.add("预算分配", v1, is_splitline=True, is_axisline_show=True)radar.add("实际开销", v2, label_color=["#4e79a7"], is_area_show=False)radar.show_config()radar.render()
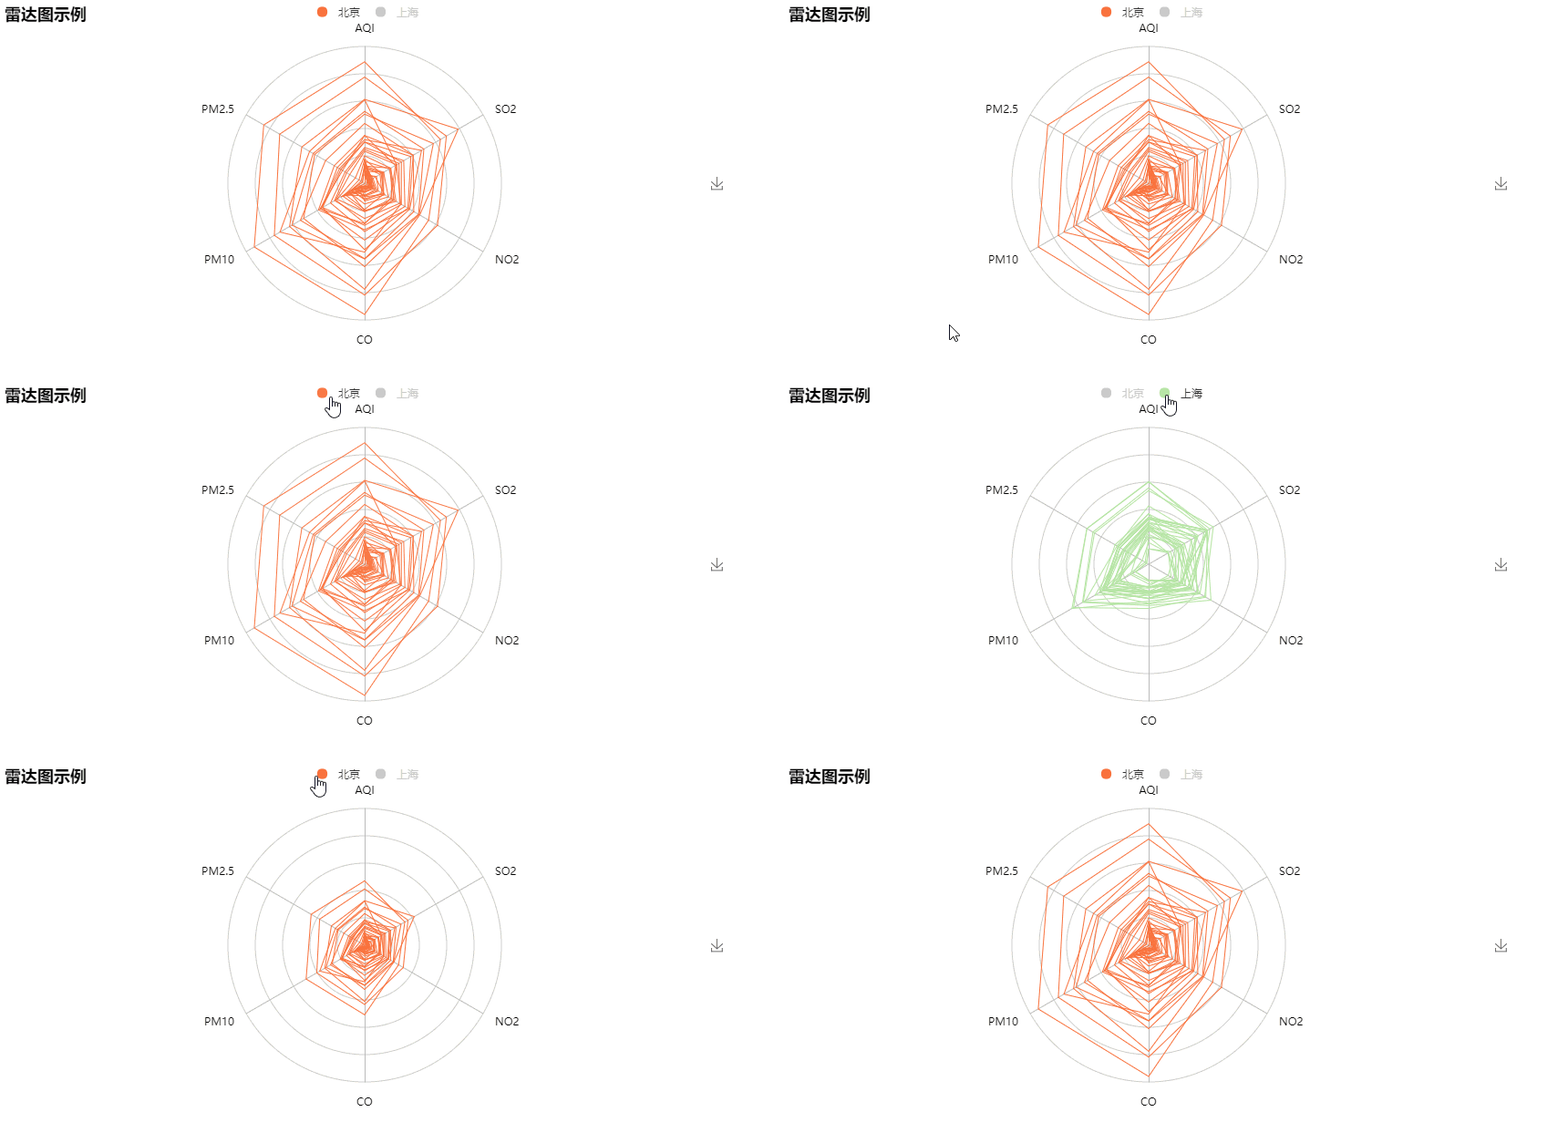
value_bj =[ [55, 9, 56, 0.46, 18, 6, 1], [25, 11, 21, 0.65, 34, 9, 2], [56, 7, 63, 0.3, 14, 5, 3], [33, 7, 29, 0.33, 16, 6, 4]...]value_sh =[ [91, 45, 125, 0.82, 34, 23, 1], [65, 27, 78, 0.86, 45, 29, 2], [83, 60, 84, 1.09, 73, 27, 3], [109, 81, 121, 1.28, 68, 51, 4]...]c_schema=[{"name": "AQI", "max": 300, "min": 5}, {"name": "PM2.5", "max": 250, "min": 20}, {"name": "PM10", "max": 300, "min": 5}, {"name": "CO", "max": 5}, {"name": "NO2", "max": 200}, {"name": "SO2", "max": 100}]radar =Radar()radar.config(c_schema=c_schema, shape='circle')radar.add("北京", value_bj, item_color="#f9713c", symbol=None)radar.add("上海", value_sh, item_color="#b3e4a1", symbol=None)radar.show_config()radar.render()
14 Scatter(散点图)
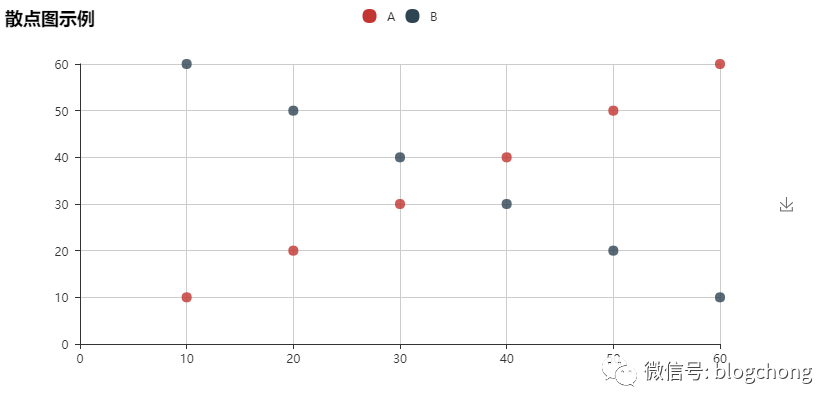
frompyecharts importScatterv1 =[10, 20, 30, 40, 50, 60]v2 =[10, 20, 30, 40, 50, 60]scatter =Scatter("散点图示例")scatter.add("A", v1, v2)scatter.add("B", v1[::-1], v2)scatter.show_config()scatter.render()
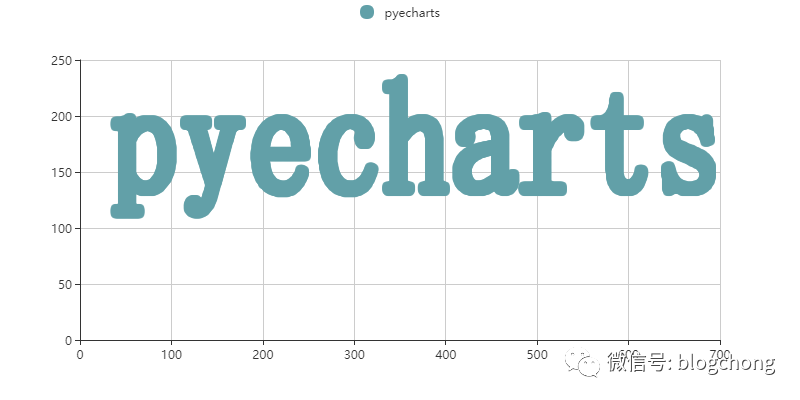
散点打印Pyecharts字体。
frompyecharts importScatterscatter =Scatter("散点图示例")v1, v2 =scatter.draw("../images/pyecharts-0.png")scatter.add("pyecharts", v1, v2, is_random=True)scatter.show_config()scatter.render()
15 WordCloud(词云图)
frompyecharts importWordCloudname =['Sam S Club', 'Macys', 'Amy Schumer', 'Jurassic World', 'Charter Communications', 'Chick Fil A', 'Planet Fitness', 'Pitch Perfect', 'Express', 'Home', 'Johnny Depp', 'Lena Dunham', 'Lewis Hamilton', 'KXAN', 'Mary Ellen Mark', 'Farrah Abraham', 'Rita Ora', 'Serena Williams', 'NCAA baseball tournament', 'Point Break']value =[10000, 6181, 4386, 4055, 2467, 2244, 1898, 1484, 1112, 965, 847, 582, 555, 550, 462, 366, 360, 282, 273, 265]wordcloud =WordCloud(width=1300, height=620)wordcloud.add("", name, value, word_size_range=[20, 100])wordcloud.show_config()wordcloud.render()

wordcloud =WordCloud(width=1300, height=620)wordcloud.add("", name, value, word_size_range=[30, 100], shape='diamond')wordcloud.show_config()wordcloud.render()

五、用户自定义
用户还可以自定义结合 Line/Bar 图表
需使用 get_series() 和 custom() 方法
get_series()"""获取图表的 series 数据 """
custom(series)'''追加自定义图表类型 '''
series -> dict
追加图表类型的 series 数据
先用 get_series() 获取数据,再使用 custom() 将图表结合在一起
frompyecharts importBar, Lineattr =['A', 'B', 'C', 'D', 'E', 'F']v1 =[10, 20, 30, 40, 50, 60]v2 =[15, 25, 35, 45, 55, 65]v3 =[38, 28, 58, 48, 78, 68]bar =Bar("Line - Bar 示例")bar.add("bar", attr, v1)line =Line()line.add("line", v2, v3)bar.custom(line.get_series())bar.show_config()bar.render()
六、更多示例
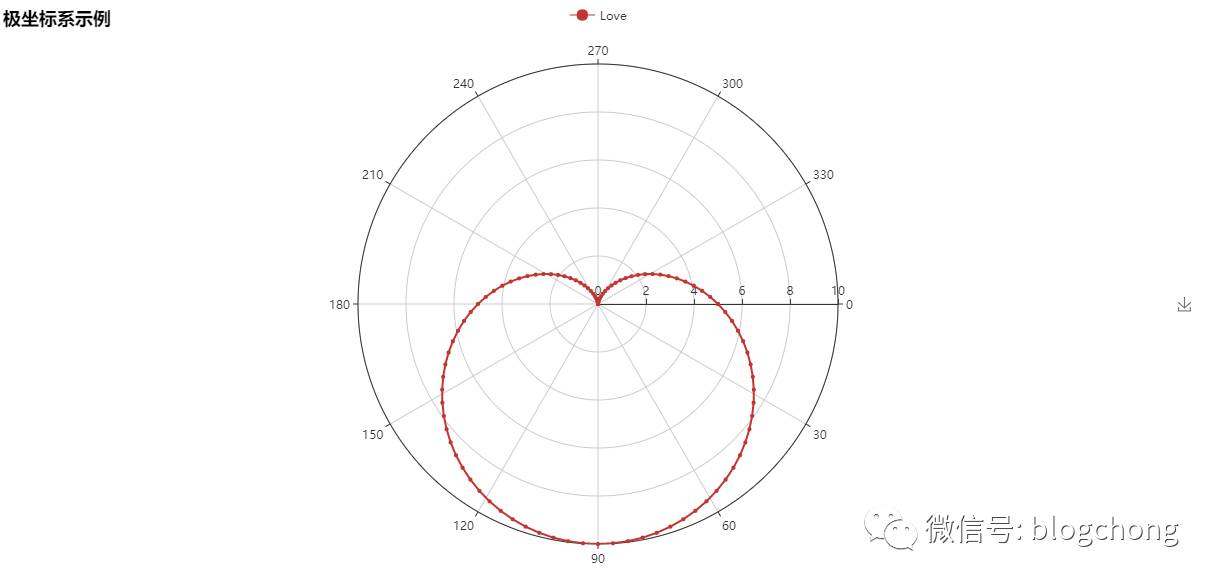
用极坐标系画出一个爱心
importmathfrompyecharts importPolardata =[]fori inrange(101): theta =i /100*360r =5*(1+math.sin(theta /180*math.pi)) data.append([r, theta])hour =[i fori inrange(1, 25)]polar =Polar("极坐标系示例", width=1200, height=600)polar.add("Love", data, angle_data=hour, boundary_gap=False,start_angle=0)polar.show_config()polar.render()
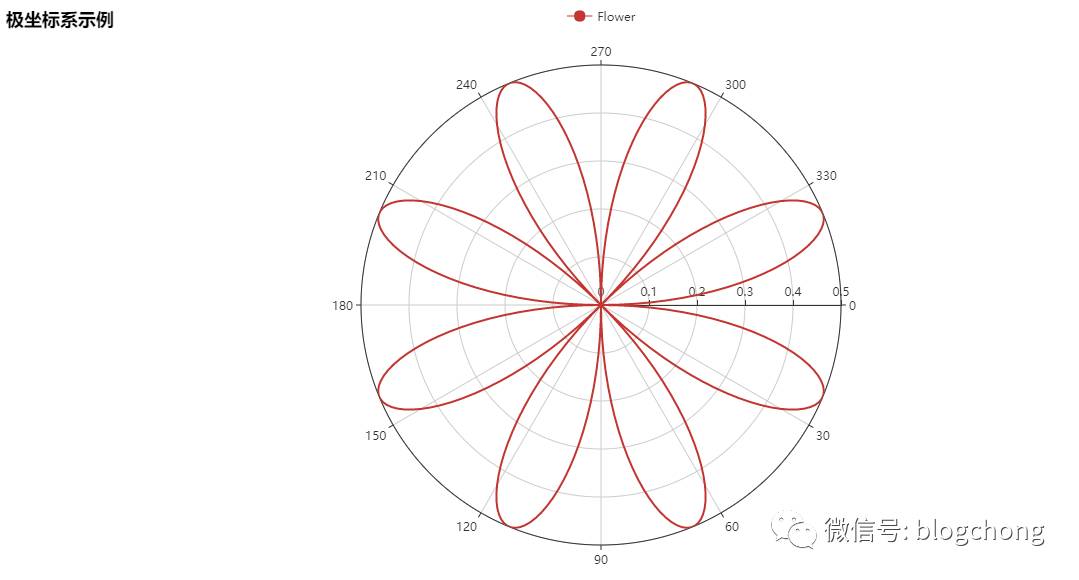
用极坐标系画出一朵小花
importmathfrompyecharts importPolardata =[]fori inrange(361): t =i /180*math.pi r =math.sin(2*t) *math.cos(2*t) data.append([r, i])polar =Polar("极坐标系示例", width=1200, height=600)polar.add("Flower", data, start_angle=0, symbol=None, axis_range=[0, None])polar.show_config()polar.render()
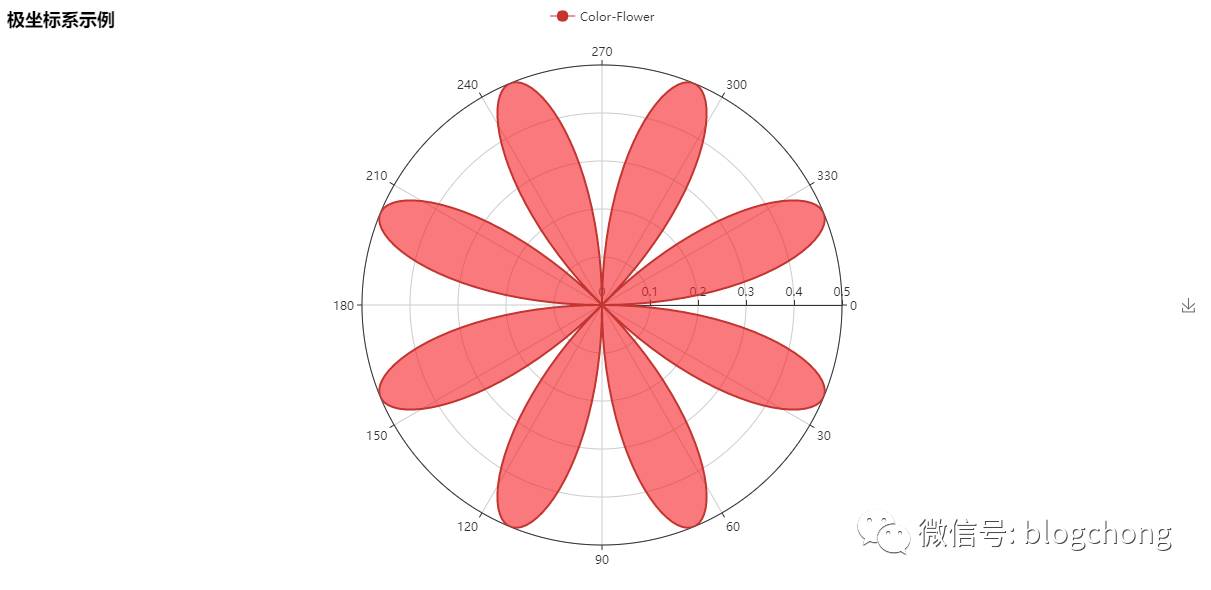
还可以给小花涂上颜色
importmathfrompyecharts importPolardata =[]fori inrange(361): t =i /180*math.pi r =math.sin(2*t) *math.cos(2*t) data.append([r, i])polar =Polar("极坐标系示例", width=1200, height=600)polar.add("Color-Flower", data, start_angle=0, symbol=None, axis_range=[0, None], area_color="#f71f24", area_opacity=0.6)polar.show_config()polar.render()
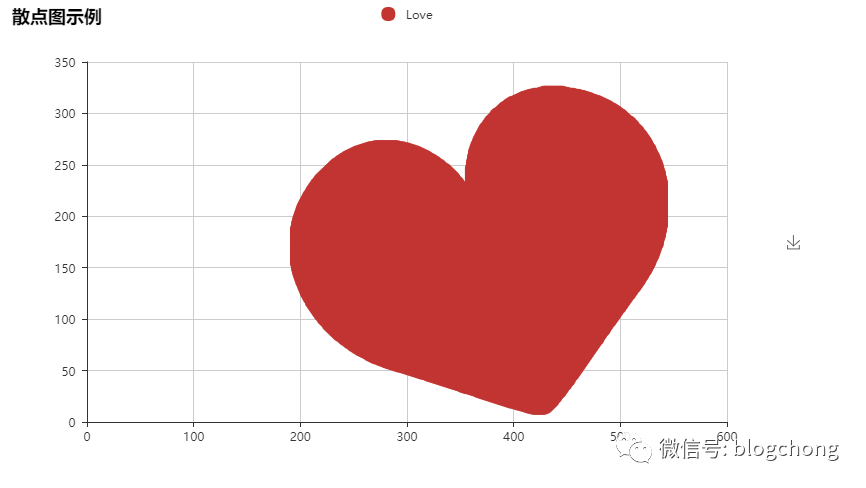
用散点图画出一个爱心
frompyecharts importScatterscatter =Scatter("散点图示例", width=800, height=480)v1 ,v2 =scatter.draw("../images/love.png")scatter.add("Love", v1, v2)scatter.render()
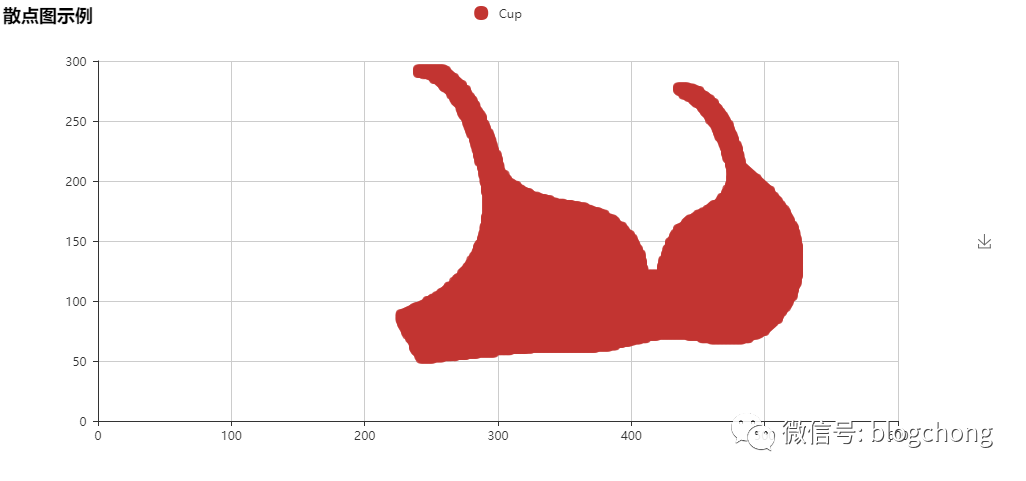
用散点图画出一个火辣的 Bra
frompyecharts importScatterscatter =Scatter("散点图示例", width=1000, height=480)v1 ,v2 =scatter.draw("../images/cup.png")scatter.add("Cup", v1, v2)scatter.render()
某地最低温和最高气温折线图
frompyecharts importLineattr =['周一', '周二', '周三', '周四', '周五', '周六', '周日', ]line =Line("折线图示例")line.add("最高气温", attr, [11, 11, 15, 13, 12, 13, 10], mark_point=["max", "min"], mark_line=["average"])line.add("最低气温", attr, [1, -2, 2, 5, 3, 2, 0], mark_point=["max", "min"], mark_line=["average"], yaxis_formatter="°C")line.show_config()line.render()
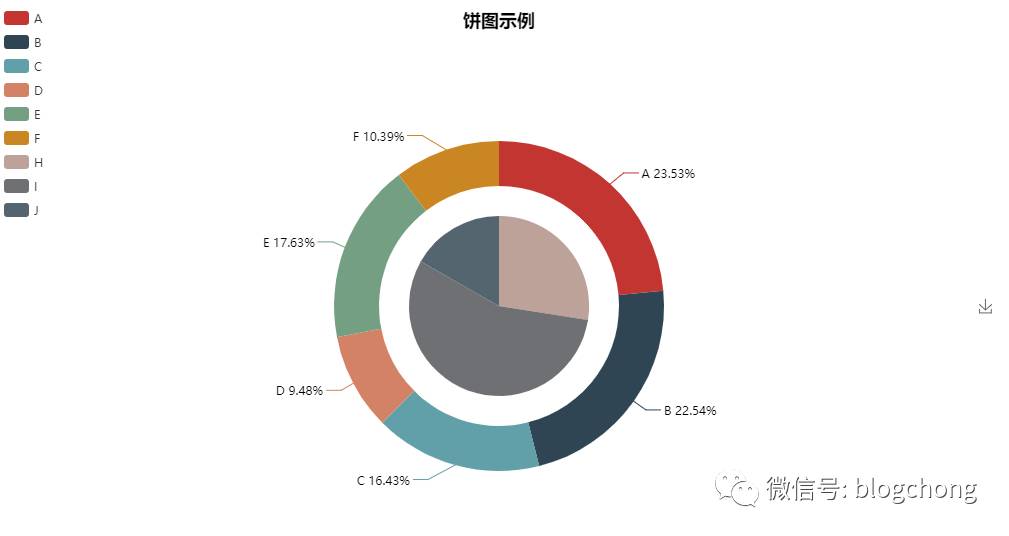
饼图嵌套
frompyecharts importPiepie =Pie("饼图示例", title_pos='center', width=1000, height=600)pie.add("", ['A', 'B', 'C', 'D', 'E', 'F'], [335, 321, 234, 135, 251, 148], radius=[40, 55],is_label_show=True)pie.add("", ['H', 'I', 'J'], [335, 679, 204], radius=[0, 30], legend_orient='vertical', legend_pos='left')pie.show_config()pie.render()
饼图再嵌套
importrandomfrompyecharts importPieattr =['A', 'B', 'C', 'D', 'E', 'F']pie =Pie("饼图示例", width=1000, height=600)pie.add("", attr, [random.randint(0, 100) for_ inrange(6)], radius=[50, 55], center=[25, 50],is_random=True)pie.add("", attr, [random.randint(20, 100) for_ inrange(6)], radius=[0, 45], center=[25, 50],rosetype='area')pie.add("", attr, [random.randint(0, 100) for_ inrange(6)], radius=[50, 55], center=[65, 50],is_random=True)pie.add("", attr, [random.randint(20, 100) for_ inrange(6)], radius=[0, 45], center=[65, 50],rosetype='radius')pie.show_config()pie.render()
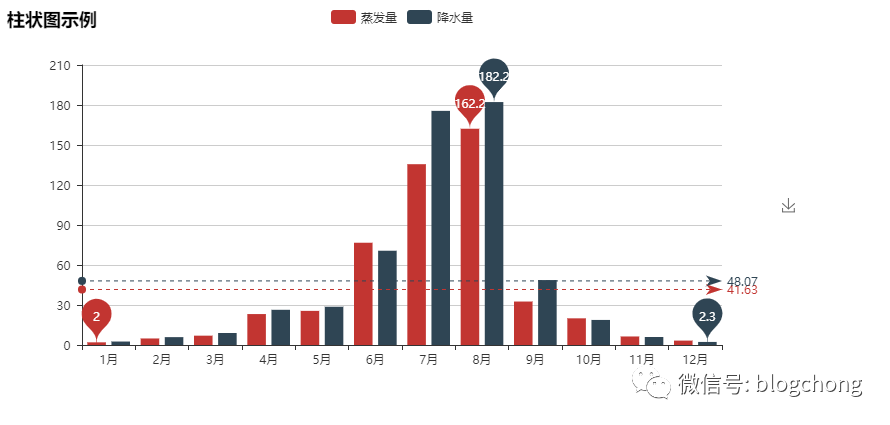
某地的降水量和蒸发量柱状图
frompyecharts importBarattr =["{}月".format(i) fori inrange(1, 13)]v1 =[2.0, 4.9, 7.0, 23.2, 25.6, 76.7, 135.6, 162.2, 32.6, 20.0, 6.4, 3.3]v2 =[2.6, 5.9, 9.0, 26.4, 28.7, 70.7, 175.6, 182.2, 48.7, 18.8, 6.0, 2.3]bar =Bar("柱状图示例")bar.add("蒸发量", attr, v1, mark_line=["average"], mark_point=["max", "min"])bar.add("降水量", attr, v2, mark_line=["average"], mark_point=["max", "min"])bar.show_config()bar.render()
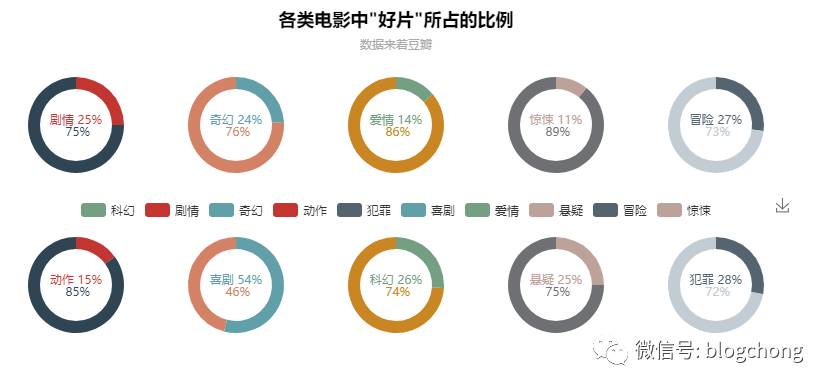
各类电影中"好片"所占的比例
frompyecharts importPiepie =Pie('各类电影中"好片"所占的比例', "数据来着豆瓣", title_pos='center')pie.add("", ["剧情", ""], [25, 75], center=[10, 30], radius=[18, 24], label_pos='center', is_label_show=True, label_text_color=None, )pie.add("", ["奇幻", ""], [24, 76], center=[30, 30], radius=[18, 24], label_pos='center', is_label_show=True, label_text_color=None, legend_pos='left')pie.add("", ["爱情", ""], [14, 86], center=[50, 30], radius=[18, 24], label_pos='center', is_label_show=True, label_text_color=None)pie.add("", ["惊悚", ""], [11, 89], center=[70, 30], radius=[18, 24], label_pos='center', is_label_show=True, label_text_color=None)pie.add("", ["冒险", ""], [27, 73], center=[90, 30], radius=[18, 24], label_pos='center', is_label_show=True, label_text_color=None)pie.add("", ["动作", ""], [15, 85], center=[10, 70], radius=[18, 24], label_pos='center', is_label_show=True, label_text_color=None)pie.add("", ["喜剧", ""], [54, 46], center=[30, 70], radius=[18, 24], label_pos='center', is_label_show=True, label_text_color=None)pie.add("", ["科幻", ""], [26, 74], center=[50, 70], radius=[18, 24], label_pos='center', is_label_show=True, label_text_color=None)pie.add("", ["悬疑", ""], [25, 75], center=[70, 70], radius=[18, 24], label_pos='center', is_label_show=True, label_text_color=None)pie.add("", ["犯罪", ""], [28, 72], center=[90, 70], radius=[18, 24], label_pos='center', is_label_show=True, label_text_color=None, is_legend_show=True, legend_top="center")pie.show_config()pie.render()
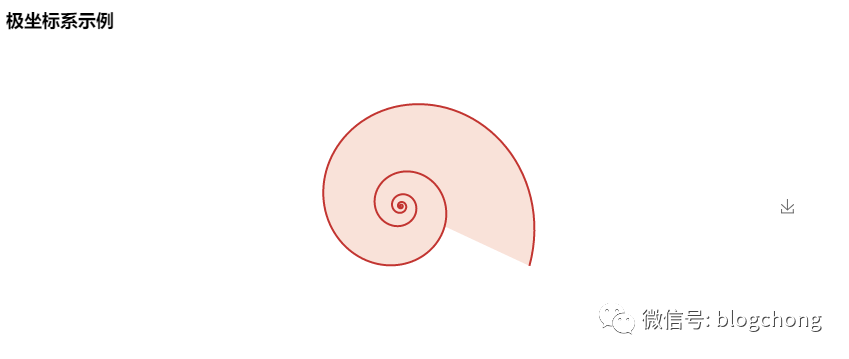
用极坐标系画出一个蜗牛壳
importmathfrompyecharts importPolardata =[]fori inrange(5): forj inrange(101): theta =j /100*360alpha =i *360+theta r =math.pow(math.e, 0.003*alpha) data.append([r, theta])polar =Polar("极坐标系示例")polar.add("", data, symbol_size=0, symbol='circle', start_angle=-25, is_radiusaxis_show=False, area_color="#f3c5b3", area_opacity=0.5, is_angleaxis_show=False)polar.show_config()polar.render()
Python 005- 使用Pyecharts来绘制各种各样的图形的更多相关文章
- Python 读取WAV文件并绘制波形图
aa Python 读取WAV文件并绘制波形图 ffmpeg -i test_pcm_mulaw.wav -f wav -codec:a pcm_s16le -ar 8000 -ac 1 out.wa ...
- Python解析Wav文件并绘制波形的方法
资源下载 #本文PDF版下载 Python解析Wav文件并绘制波形的方法 #本文代码下载 Wav波形绘图代码 #本文实例音频文件night.wav下载 音频文件下载 (石进-夜的钢琴曲) 前言 在现在 ...
- 【神经网络与深度学习】【python开发】caffe-windows使能python接口使用draw_net.py绘制网络结构图过程
[神经网络与深度学习][python开发]caffe-windows使能python接口使用draw_net.py绘制网络结构图过程 标签:[神经网络与深度学习] [python开发] 主要是想用py ...
- 用Python的Pandas和Matplotlib绘制股票KDJ指标线
我最近出了一本书,<基于股票大数据分析的Python入门实战 视频教学版>,京东链接:https://item.jd.com/69241653952.html,在其中给出了MACD,KDJ ...
- matlab绘制二维图形
常用的二维图形命令: plot:绘制二维图形 loglog:用全对数坐标绘图 semilogx:用半对数坐标(X)绘图 semilogy:用半对数坐标(Y)绘图 fill:绘制二维多边填充图形 pol ...
- 使用matplotlib绘制多个图形单独显示
使用matplotlib绘制多个图形单独显示 一 代码 import numpy as np import matplotlib.pyplot as plt #创建自变量数组 x= np.linspa ...
- RRDtool绘制lvs连接数图形
需求:用RRDtool绘制lvs的连接数图形 RRDtool是一个强大的绘图工具,作者是Tobias Oetiker. RRD全称Round Robin Database,轮转数据库,也是一个时间序列 ...
- [Swift通天遁地]八、媒体与动画-(5)使用开源类库绘制文字、图形、图像、图表、SVG(可缩放矢量图形)
★★★★★★★★★★★★★★★★★★★★★★★★★★★★★★★★★★★★★★★★➤微信公众号:山青咏芝(shanqingyongzhi)➤博客园地址:山青咏芝(https://www.cnblogs. ...
- 小白学Python(11)——pyecharts,绘制饼图 Pie
Pie-基本示例 from example.commons import Faker from pyecharts import options as opts from pyecharts.char ...
随机推荐
- POJ 1745 Divisibility
Divisibility Time Limit: 1000MS Memory Limit: 10000K Total Submissions: 9476 Accepted: 3300 Desc ...
- iOS开发工具篇-AppStore统计工具
苹果官方的iTunes Connect提供的销售数据统计功能比较弱,例如只能保存最近30天的详细销售数据,界面丑陋, 无法查看App的排名历史变化情况等. 早有一些公司提供了专门的解决方案或工具.这些 ...
- bzoj2748 [HAOI2012]音量调节 背包
Description 一个吉他手准备参加一场演出.他不喜欢在演出时始终使用同一个音量,所以他决定每一首歌之前他都要改变一次音量.在演出开始之前,他已经做好了一个列表,里面写着在每首歌开始之前他想要改 ...
- Ubuntu 常用命令和一些 tips
001. ubuntu 解压.tar.xz文件到另一个文件夹:sudo tar -xvJf ***.tar.xz -C /usr/src sudo 超级用户tar [选项...][file]...-x ...
- log4j中isDebugEnabled(), log.isInfoEnabled()和log.isTraceEnabled的封装
1. log4j中log.isDebugEnabled(), log.isInfoEnabled()和log.isTraceEnabled()作用 项目在应用log4j打印Debug,Info和Tra ...
- Spring Boot SpringSecurity5 身份验证
对于没有访问权限的用户需要转到登录表单页面.要实现访问控制的方法多种多样,可以通过Aop.拦截器实现,也可以通过框架实现(如:Apache Shiro.Spring Security). pom.xm ...
- 并发编程辅助工具-java.util.concurrent
1. CountDownLatch 类似于计数器的功能,主要用于控制某个任务的执行先后顺序,可以控制某个任务在其他任务(可能是多线程的)执行完 之后,才会去执行. public static void ...
- HDU 5015 233 Matrix(网络赛1009) 矩阵快速幂
先贴四份矩阵快速幂的模板:http://www.cnblogs.com/shangyu/p/3620803.html http://www.cppblog.com/acronix/archive/20 ...
- Android 网络通信之Socket
Android 网络通信之Socket 应用软件的网络通信无非就是Socket和HTTP,其中Socket又可以用TCP和UDP,HTTP的话就衍生出很多方式,基础的HTTP GET和POST请求,然 ...
- 多语言业务错误日志收集监控工具Sentry 安装与使用
Sentry 是一个实时事件日志记录和汇集的平台.其专注于错误监控以及提取一切事后处理所需信息而不依赖于麻烦的用户反馈. Sentry是一个日志平台, 它分为客户端和服务端,客户端(目前客户端有Pyt ...