我们在做网络服务器的时候,通常会很关心网络的带宽和延迟。因为我们的很多协议都是request-reponse协议,延迟决定了最大的QPS,而带宽决定了最大的负荷。 通常我们知道自己的网卡是什么型号,交换机什么型号,主机之间的物理距离是多少,理论上是知道带宽和延迟是多少的。但是现实的情况是,真正的带宽和延迟情况会有很多变数的,比如说网卡驱动,交换机跳数,丢包率,协议栈配置,光实际速度都很大的影响了数值的估算。 所以我们需要找到工具来实际测量下。
网络测量的工具有很多,netperf什么的都很不错。 我这里推荐了qperf,这是RHEL 6发行版里面自带的,所以使用起来很方便,只要简单的:
yum install qperf
就好。
我们看下man qperf的介绍:
qperf measures bandwidth and latency between two nodes. It can work over TCP/IP as well as the RDMA transports. On one of the nodes, qperf is typically run with no arguments designating it the server node. One may then run qperf on a client node to obtain measurements such as bandwidth, latency and cpu utilization.
In its most basic form, qperf is run on one node in server mode by invoking it with no arguments. On the other node, it is run with two arguments: the name of the server node followed by the name of the test. A list of tests can be found in the section, TESTS. A variety of options may also be specified.
使用起来也相当简单:
在其中一台机器上运行qperf,不带任何参数就好,这台机器就充当服务器角色:
2.6.32-131.21.1.tb477.el6.x86_64 |
在另外一台机器上运行qperf,测量tcp的带宽和延时,顺便看下双方机器的配置情况:
$ qperf 10.232.64.yyy tcp_bw tcp_lat conf |
loc_cpu = 16 Cores: Intel Xeon L5630 @ 2.13GHz |
loc_os = Linux 2.6.32-131.21.1.tb477.el6.x86_64 |
rem_cpu = 16 Cores: Intel Xeon L5630 @ 2.13GHz |
rem_os = Linux 2.6.32-131.21.1.tb477.el6.x86_64 |
是不是很方便?典型情况下我们的带宽是118M,延迟是32us, 在标准的千M环境下是符合预期的。
当然qperf有很多高级参数,可以设置socket buffer的大小,绑定CPU亲缘性等, 很赞的一个特性是可以通过持续改变某个重要参数的值,来观察临界点:
-oo, –loop Var:Init:Last:Incr
Run a test multiple times sequencing through a series of values. Var is the loop variable;
Init is the initial value; Last is the value it must not exceed and Incr is the increment. It
is useful to set the –verbose_used (-vu) option in conjunction with this option.
比如我们可以透过改变消息的大小(msg_size),比如从1个字节到64K,每次倍增的方式,来观察带宽和延迟的变化情况,演示下:
$ qperf -oo msg_size:1:64K:*2 10.232.64.yyy tcp_bw tcp_lat |
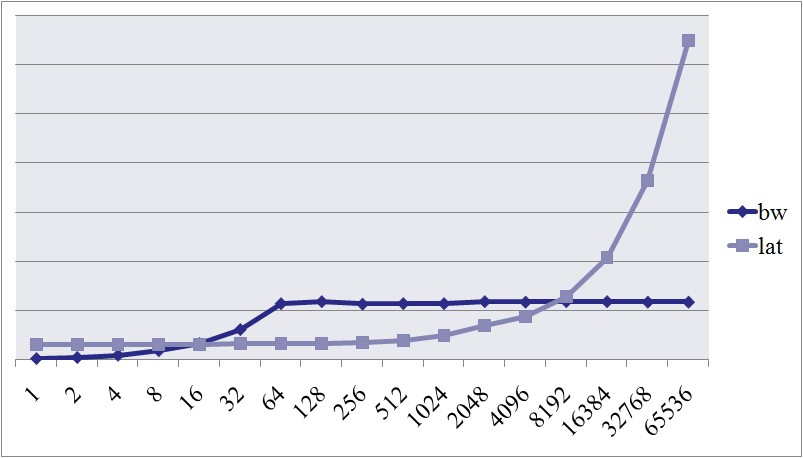
我们可以看到当包的大小达到64字节的时候,带宽就上不去了;包到达1K的时候,延迟有了很大的变化。 这些临界点对我们的服务器编程时候对性能的估计和预期非常有帮助。
qperf除了测量tcp的,还可以测试rdma, udp, sctp等主流网络协议的带宽和延迟,算是个很新的工具,推荐大家使用。
祝玩得开心!
- 如何使用qperf来衡量网络带宽和延迟性能?
解析度 安装 qperf从RHEL服务器通道安装: 生的 # yum install qperf 检查带宽 服务器 让一个系统监听服务器: 生的 server # qperf 服务器默认在TCP端口1 ...
- 树莓派使用iperf3测量网络带宽
这个工具需要两台设备都安装iperf3工具,一台作为服务端,一台作为客户端.客户端通过链接服务端测量吞吐量. 安装iperf3 sudo apt install iperf3 开启服务端 假设在一台I ...
- 网络带宽和速度测试windows和linux用iperf工具
网络带宽和速度测试windows和linux用iperf工具 Iperf是一个网络性能测试工具.Iperf可以测试TCP和UDP带宽质量.Iperf可以测量最大TCP带宽,具有多种参数和UDP特性 ...
- RTMP服务器的延迟,多级边缘不影响延迟,gop为最大因素
转自:http://blog.chinaunix.net/uid-26000296-id-4932826.html 编码器用FMLE,用手机秒表作为延迟计算. 结论: 1. 影响延迟的三个重要因素:网 ...
- 网络性能测试工具iperf详细使用图文教程
Iperf是一个网络性能测试工具.Iperf可以测试TCP和UDP带宽质量.Iperf可以测量最大TCP带宽,具有多种参数和UDP特性. Iperf可以报告带宽,延迟抖动和数据包丢失.利用Iper ...
- 网络性能测试工具iperf详细使用图文教程【转载】
原文:http://blog.163.com/hlz_2599/blog/static/142378474201341341339314/ 参考:http://man.linuxde.net/iper ...
- Python 全栈开发 -- 监控篇
如果你已经玩转了 Python 编程语言语法,肯定想用这些知识,开发一款应用程序,它可以是在网上,可以炫耀或出售,那就需要全栈式开发 Python.具体如何创建,部署和运行生产 Python Web ...
- [转]网络性能评估工具Iperf详解(可测丢包率)
原文链接:安全运维之:网络性能评估工具Iperf详解:http://os.51cto.com/art/201410/454889.htm 参考博文:http://linoxide.com/monito ...
- 网络性能测试工具Iperf/Jperf解读
Iperf 是一个网络性能测试工具.Iperf 可以测试TCP 和UDP 带宽质量.Iperf 可以测量最大TCP 带宽,具有多种参数和UDP 特性. Iperf 可以报告带宽,延时抖动和数据包丢失. ...
随机推荐
- VS2010 SP1安装失败之”此计算机的状态不支持此安装“()
升级安装VS2010SP1的时候,出现“此计算机的状态不支持此安装”,Google得之: 如下图显示: 安装程序已经检测到,此计算机不满足安装此软件所需的条件.必须先解决以下这些造成阻止的问题,才可以 ...
- iOS开发-Bug锦囊
duplicate symbols for architecture armv7 今天修改了自己项目的部分代码,发现XCode编译的时候报错:duplicate symbols for archite ...
- C#利用tabControl控件实现多窗体嵌入及关闭
创建一个主窗体(Formmain).两个副窗体(Form1,Form2);在主窗体中分别添加一个menuStrip控件.tabControl控件,并在menu控件上添加一个主菜单和两个子菜单 继而 ...
- Ios开发之协议protocol
Protocol是ios开发中的一个难点也是一个重点,要想使用好,或者理解好它,可能需要时间的累积.今天我们就通过一个例子来简单的看一下,怎么样使用protocol. 我们今天用的例子就是模拟电脑插入 ...
- bash: php: command not found
bash: php: command not found 解决:export PATH=$PATH:/usr/local/php/bin
- Gradle - Manifest
Manifest DSL提供了配置以下Manifest条目的功能: minSdkVersion / targetSdkVersion / versionCode / versionName / app ...
- python 听课笔记(一)
- 如何把本地代码提交到git(码云)、github代码管理项目上
前提必须安装了git工具 以下命令操作都是通过git bash操作. 将本地代码提交到码云空项目操作: D:\>mkdir inek_winprop D:\>cd inek_winprop ...
- GitHub最新命令使用教程
一.创建github仓库并提交代码 1.在github创建public仓库 2.会生成一个git地址 https://github.com/ae6623/Zebra.git 3.在本地打开命令,在文件 ...
- C#.NET常见问题(FAQ)-如何声明list的多维数组
可以用下面的方法来声明多维list数组,但是不推荐使用 //对于一维数组:List<数据类型> 变量 = new List<数据类型>(); List<int> ...