
机器学习入门-随机森林温度预测-增加样本数据 1.sns.pairplot(画出两个关系的散点图) 2.MAE(平均绝对误差) 3.MAPE(准确率指标)
在上一个博客中,我们构建了随机森林温度预测的基础模型,并且研究了特征重要性。
在这个博客中,我们将从两方面来研究数据对预测结果的影响
第一方面:特征不变,只增加样本的数据
第二方面:增加特征数,增加样本的数据
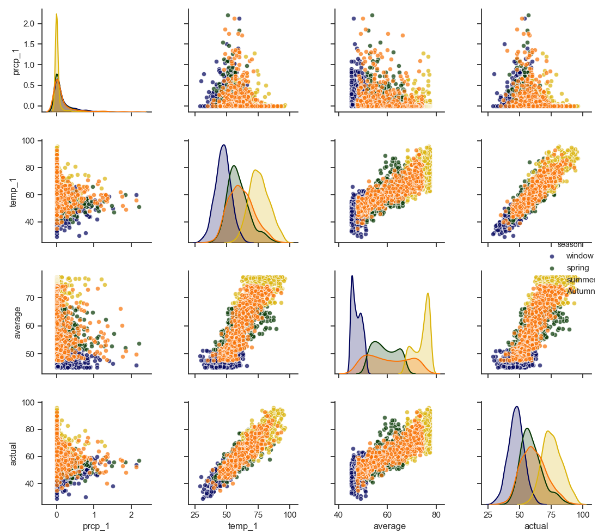
1.sns.pairplot 画出两个变量的关系图,用于研究变量之间的线性相关性,sns.pattle([color]) 用于设置调色板, 有点像scatter_matrix
2.MSE round(abs(pred - test_y).mean(), 2) 研究预测值与真实值之差的平均值
3.MAPE round(100 -abs(pred-test_y)/test_y*100, 2) (1 - 误差与真实值的比值)的平均值
代码:
第一步:载入数据
第二步:使用datetime.datetime.strptime() 将年月日进行组合,构造出日期的标签
第三步: 对数据中的温度特征进行画图
第四步:对新增的特征进行画图
第五步:sns.pairplot进行两两变量的关系画图,使用sns.pattle()生成颜色的调色板
第六步:建立随机森林模型,研究新增加的数据对预测精度的影响,不加入新增的特征
第七步:建立随机森林模型,研究新增加的数据对预测精度的影响,加入新增的特征
import datetime

import numpy as np

import matplotlib.pyplot as plt

import pandas as pd

# 第一步:导入数据

features = pd.read_csv('data/temps_extended.csv')

print(features.describe())

print(features.columns)

# 第二步:使用datetime.datetime.strptime将字符串转换为日期类型

years = features['year']

months = features['month']

days = features['day']

# 先转换为字符串类型

dates = [str(int(year)) + '-' + str(int(month)) + '-' + str(int(day)) for year, month, day in zip(years, months, days)]

# 字符串类型转换为日期类型

dates = [datetime.datetime.strptime(date, '%Y-%m-%d') for date in dates]

# 第三步对温度特征进行画图操作

fig, ((ax1, ax2), (ax3, ax4)) = plt.subplots(ncols=2, nrows=2, figsize=(12, 12))

fig.autofmt_xdate(rotation=60)

ax1.plot(dates, features['temp_2'], linewidth=4)

ax1.set_xlabel(''); ax1.set_ylabel('temperature'); ax1.set_title('pre two max')

ax2.plot(dates, features['temp_1'], linewidth=4)

ax2.set_xlabel(''); ax2.set_ylabel('temperature'); ax2.set_title('pre max')

ax3.plot(dates, features['actual'], linewidth=4)

ax3.set_xlabel(''); ax3.set_ylabel('temperature'); ax3.set_title('today max')

ax4.plot(dates, features['friend'], linewidth=4)

ax4.set_xlabel(''); ax4.set_ylabel('temperature'); ax4.set_title('friend max')

plt.show()

# 第四步:对新增的特征和平均温度进行作图

fig, ((ax1, ax2), (ax3, ax4)) = plt.subplots(ncols=2, nrows=2, figsize=(12, 12))

fig.autofmt_xdate(rotation=60)

ax1.plot(dates, features['average'])

ax1.set_xlabel(''); ax1.set_ylabel('temperature'); ax1.set_title('average')

ax2.plot(dates, features['ws_1'], 'r-')

ax2.set_xlabel(''); ax2.set_ylabel('temperature'); ax2.set_title('WS')

ax3.plot(dates, features['prcp_1'], 'r-')

ax3.set_xlabel(''); ax3.set_ylabel('temperature'); ax3.set_title('Prcp')

ax4.plot(dates, features['snwd_1'], 'ro')

ax4.set_xlabel(''); ax4.set_ylabel('temperature'); ax4.set_title('Snwd')

plt.show()


# 第五步:使用sns.pairplot画两两关系的散点图

# 新增加季节特征,用做画图时的区分

season = []

for month in months:

    if month in [12, 1, 2]:

        season.append('window')

    elif month in [3, 4, 5]:

        season.append('spring')

    elif month in [6, 7, 8]:

        season.append('summer')

    else:

        season.append('Autumn')

feature_matrix = features[['prcp_1', 'temp_1', 'average', 'actual']]

feature_matrix['season'] = season

import  seaborn as sns

sns.set(style='ticks', color_codes=True)

palette = sns.xkcd_palette(['dark blue', 'dark green', 'gold', 'orange'])

# hue表示通过什么进行分类

sns.pairplot(feature_matrix, hue='season', palette=palette, plot_kws=dict(alpha=0.7), diag_kind='kde',

             diag_kws=dict(shade=True))

plt.show()
# 第六步使用增加的数据进行随机森林的建模,不添加新增的特征

feature_names = list(features.columns)

feature_indices = [feature_names.index(feature_name) for feature_name in feature_names

    if feature_names not in ['ws_1', 'prcp_1', 'snwd_1']]

print(feature_indices)

# 使用pd.get_dummies 将week的文本标签转换为one-hot编码

features = pd.get_dummies(features)

# 提取特征和标签

X = features.iloc[:, feature_indices]

y = np.array(features['actual'])

X = X.drop('actual', axis=1)

X = np.array(X)

# 使用train_test_split 进行训练集和测试集的分开

from sklearn.model_selection import train_test_split

train_x, test_x, train_y, test_y = train_test_split(X, y, test_size=0.3, random_state=42)

# 构建随机森林模型进行预测

from sklearn.ensemble import RandomForestRegressor

rf = RandomForestRegressor(n_estimators=1000, random_state=42)

rf.fit(train_x, train_y)

pred_y = rf.predict(test_x)

# 使用MAE指标

MAE = round(abs(pred_y - test_y).mean(), 2)

# 使用MAPE指标

MAPE = round(((1-abs(pred_y-test_y)/test_y)*100).mean(), 2)

print(MAE, MAPE)

# 探讨原来数据的MAE和MAPE

# 使用pd.get_dummies 将week的文本标签转换为one-hot编码

features = pd.read_csv('data/temps.csv')

features = pd.get_dummies(features)

# 提取特征和标签

y = np.array(features['actual'])

X = features.drop('actual', axis=1)

X = np.array(X)

# 使用train_test_split 进行训练集和测试集的分开

from sklearn.model_selection import train_test_split

train_x, test_x, train_y, test_y = train_test_split(X, y, test_size=0.3, random_state=42)

# 构建随机森林模型进行预测

from sklearn.ensemble import RandomForestRegressor

rf = RandomForestRegressor(n_estimators=1000, random_state=42)

rf.fit(train_x, train_y)

pred_y = rf.predict(test_x)

# 使用MAE指标

MAE = round(abs(pred_y - test_y).mean(), 2)

# 使用MAPE指标

MAPE = round(((1-abs(pred_y-test_y)/test_y)*100).mean(), 2)

print(MAE, MAPE)

# 第七步: 探讨将新增加的指标也加入对数据结果的影响

features = pd.read_csv('data/temps_extended.csv')

features = pd.get_dummies(features)

# 提取特征和标签

y = np.array(features['actual'])

X = features.drop('actual', axis=1)

X = np.array(X)

# 使用train_test_split 进行训练集和测试集的分开

from sklearn.model_selection import train_test_split

train_x, test_x, train_y, test_y = train_test_split(X, y, test_size=0.3, random_state=42)

# 构建随机森林模型进行预测

from sklearn.ensemble import RandomForestRegressor

rf = RandomForestRegressor(n_estimators=1000, random_state=42)

rf.fit(train_x, train_y)

pred_y = rf.predict(test_x)

# 使用MAE指标

MAE = round(abs(pred_y - test_y).mean(), 2)

# 使用MAPE指标

MAPE = round(((1-abs(pred_y-test_y)/test_y)*100).mean(), 2)

print(MAE, MAPE)
原始数据的MAE,MAPE 3.87 93.96
只增加数据量的MAE, MAPE 3.73 93.72
增加数据量增加特征的MAE,MAPE 3.71 93.76
从上面可以看出增加数据量和样本特征对结果还是能产生正面的影响
机器学习入门-随机森林温度预测-增加样本数据 1.sns.pairplot(画出两个关系的散点图) 2.MAE(平均绝对误差) 3.MAPE(准确率指标)的更多相关文章
- 机器学习入门-随机森林温度预测的案例 1.datetime.datetime.datetime(将字符串转为为日期格式) 2.pd.get_dummies(将文本标签转换为one-hot编码) 3.rf.feature_importances_(研究样本特征的重要性) 4.fig.autofmt_xdate(rotation=60) 对标签进行翻转
在这个案例中: 1. datetime.datetime.strptime(data, '%Y-%m-%d') # 由字符串格式转换为日期格式 2. pd.get_dummies(features) ...
- 机器学习入门-随机森林预测温度-不同参数对结果的影响调参 1.RandomedSearchCV(随机参数组的选择) 2.GridSearchCV(网格参数搜索) 3.pprint(顺序打印) 4.rf.get_params(获得当前的输入参数)
使用了RamdomedSearchCV迭代100次,从参数组里面选择出当前最佳的参数组合 在RamdomedSearchCV的基础上,使用GridSearchCV在上面最佳参数的周围选择一些合适的参数 ...
- 100天搞定机器学习|Day56 随机森林工作原理及调参实战(信用卡欺诈预测)
本文是对100天搞定机器学习|Day33-34 随机森林的补充 前文对随机森林的概念.工作原理.使用方法做了简单介绍,并提供了分类和回归的实例. 本期我们重点讲一下: 1.集成学习.Bagging和随 ...
- Python机器学习笔记——随机森林算法
随机森林算法的理论知识 随机森林是一种有监督学习算法,是以决策树为基学习器的集成学习算法.随机森林非常简单,易于实现,计算开销也很小,但是它在分类和回归上表现出非常惊人的性能,因此,随机森林被誉为“代 ...
- 使用基于Apache Spark的随机森林方法预测贷款风险
使用基于Apache Spark的随机森林方法预测贷款风险 原文:Predicting Loan Credit Risk using Apache Spark Machine Learning R ...
- 100天搞定机器学习|Day33-34 随机森林
前情回顾 机器学习100天|Day1数据预处理 100天搞定机器学习|Day2简单线性回归分析 100天搞定机器学习|Day3多元线性回归 100天搞定机器学习|Day4-6 逻辑回归 100天搞定机 ...
- paper 84:机器学习算法--随机森林
http://www.cnblogs.com/wentingtu/archive/2011/12/13/2286212.html中一些内容 基础内容: 这里只是准备简单谈谈基础的内容,主要参考一下别人 ...
- 【机器学习】随机森林(Random Forest)
随机森林是一个最近比较火的算法 它有很多的优点: 在数据集上表现良好 在当前的很多数据集上,相对其他算法有着很大的优势 它能够处理很高维度(feature很多)的数据,并且不用做特征选择 在训练完后, ...
- 【机器学习】随机森林RF
随机森林(RF, RandomForest)包含多个决策树的分类器,并且其输出的类别是由个别树输出的类别的众数而定.通过自助法(boot-strap)重采样技术,不断生成训练样本和测试样本,由训练样本 ...
随机推荐
- WPF中Image显示本地图片(转)
private void SetSource(System.Windows.Controls.Image image, string fileName) { System.Drawing.Image ...
- MySQL--禁用账号和设置账号有效期
======================================================================= MySQL5.5/5.6版本 在MySQL 5.7 版本 ...
- Oracle 多行合并一行 方法
假如有如下表,其中各个i值对应的行数是不定的 SQL> select * from t; I A D ---------- ---------- --------------- ...
- ereg()替换为preg_match(),ereg_repalce替换为preg_replace得加斜杠
PHP 5.3 ereg() 无法正常使用,提示“Function ereg() is deprecated Error”是因为它长ereg 函数进行了升级处理,需要像preg_match使用/ /来 ...
- Asp.Net操作MySql数据库增删改查
Asp.Net操作MySql数据库增删改查,话不多说直接步入正题.git源码地址:https://git.oschina.net/gxiaopan/NetMySql.git 1.安装MySQL数据库 ...
- 2018第52周日&技术人员如何面对裁员?
2018的最后一周,看了汽车的两个趋势,纯电动车和自动驾驶,两个现在很火但还有很多问题要解决的方向,尤其是自动驾驶.虽然它因为一些问题当前不能完全被克服,但因它而生的各种辅助驾驶技术却被用的越来越多, ...
- AQS源码分析
AQS全程为AbstractQueuedSynchronizer,其定义了一套多线程访问共享资源的同步框架,大部分的同步类的实现都依赖于他,比如ReentrantLock,ReentrantReadW ...
- Oracle根据表的大小排序SQL语句
--按照数据行数排序select table_name,blocks,num_rows from dba_tables where owner not like '%SYS%' and table_n ...
- vqmod for opencart插件制作进阶与技巧
FROM: http://www.sdtclass.com/4799.html 15年的时候,我写过一篇文章<略谈 vqmod for opencart 插件制作过程>,也不知道被哪些人抄 ...
- MySQL的结构图
MySQL的结构图 为了更好的了解和配置MySQL,就必须先了解一下MySQL的体系结构.如下图所示: ▲MySQL体系架构图 理解MySQL的体系架构对于成功的配置和调试至关重要.以下将对架构图进行 ...