13款Linux运维比较实用的工具
本文介绍几款Linux运维比较实用的工具,希望对Linux管理员有所帮助。
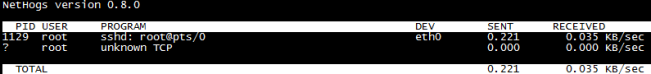
1、查看进程占用带宽情况-Nethogs
Nethogs 是一个终端下的网络流量监控工具可以直观的显示每个进程占用的带宽。
下载:http://sourceforge.net/projects/nethogs/files/nethogs/0.8/nethogs-0.8.0.tar.gz/download
- [root@localhost ~]#yum -y install libpcap-devel ncurses-devel
- [root@localhost ~]# tar zxvf nethogs-0.8.0.tar.gz
- [root@localhost ~]# cd nethogs
- [root@localhost nethogs]# make && make install
- [root@localhost nethogs]# nethogs eth0
2、硬盘读取性能测试-IOZone
IOZone是一款Linux文件系统性能测试工具 可以测试不同的操作系统中文件系统的读写性能。
下载:http://www.iozone.org/src/current/
- [root@localhost current]# tar xvf iozone3_420.tar
- [root@localhost ~]# cd iozone3_420/src/current/
- [root@localhost current]# make linux
- [root@localhost current]# ./iozone -a -n 512m -g 16g -i 0 -i 1 -i 5 -f /mnt/iozone -Rb ./iozone.xls
- -a使用全自动模式
- -n为自动模式设置最小文件大小(Kbytes)。
- -g设置自动模式可使用的最大文件大小Kbytes。
- -i用来指定运行哪个测试。
- -f指定测试文件的名字完成后自动删除
- -R产生Excel到标准输出
- -b指定输出到指定文件上
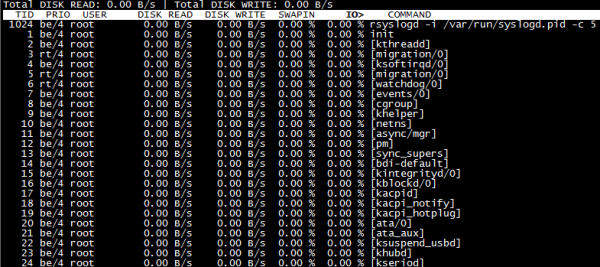
3、实时监控磁盘IO-IOTop
IOTop命令是专门显示硬盘IO的命令,界面风格类似top命令。
- [root@localhost ~]# yum -y install iotop
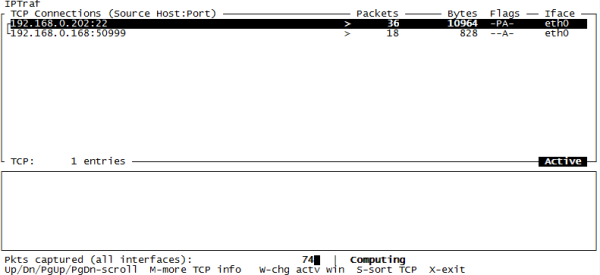
4、网络流量监控-IPtraf
IPtraf是一个运行在Linux下的简单的网络状况分析工具。
- [root@localhost ~]# yum -y install iptraf
5、网络流量监控-IFTop
iftop是类似于linux下面top的实时流量监控工具。比iptraf直观些。
下载:http://www.ex-parrot.com/~pdw/iftop/
- [root@localhost ~]# tar zxvf iftop-0.17.tar.gz
- [root@localhost ~]# cd iftop-0.17
- [root@localhost iftop-0.17]# ./configure
- [root@localhost iftop-0.17]# make && make install
- [root@localhost iftop-0.17]# iftop
- [root@localhost iftop-0.17]# iftop -i eth0 #指定监控网卡接口
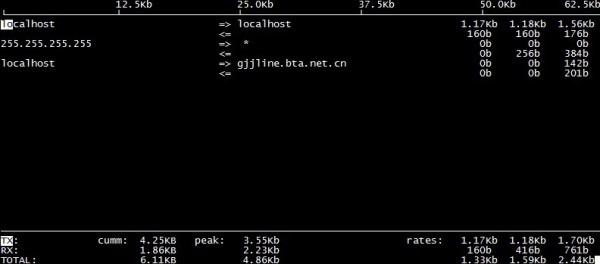
- TX:发送流量
- RX:接收流量
- TOTAL:总流量
- Cumm:运行iftop到目前时间的总流量
- peak:流量峰值
- rates:分别表示过去 2s 10s 40s 的平均流量
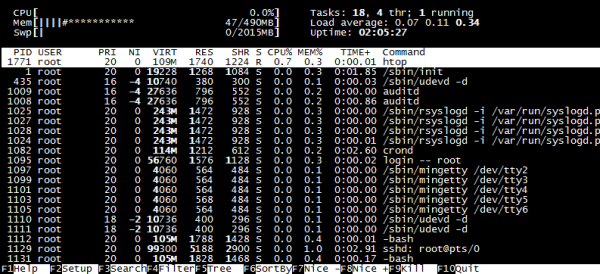
6、进程实时监控-HTop
HTop是一个 Linux 下的交互式的进程浏览器可以用来替换Linux下的top命令。
rpm -ivh http://pkgs.repoforge.org/rpmforge-release/rpmforge-release-0.5.2-2.el6.rf.x86_64.rpm(安装第三方YUM源)
- [root@localhost ~]# yum -y install htop
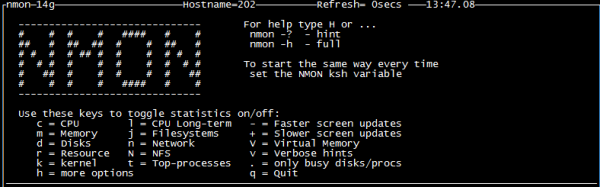
7、系统资源监控-NMON
NMON是一种在AIX与各种Linux操作系统上广泛使用的监控与分析工具
下载:http://sourceforge.jp/projects/sfnet_nmon/releases/
- [root@localhost ~]# chmod +x nmon_x86_64_rhel6
- [root@localhost ~]# mv nmon_x86_64_rhel6 /usr/sbin/nmon
- [root@localhost ~]# nmon
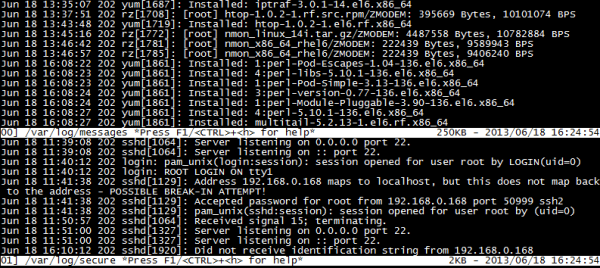
8、监控多个日志-MultiTail
MultiTail是在控制台打开多个窗口用来实现同时监控多个日志文档、类似tail命令的功能的软件。
rpm -ivh http://pkgs.repoforge.org/rpmforge-release/rpmforge-release-0.5.2-2.el6.rf.x86_64.rpm (安装第三方YUM源)
- [root@localhost ~]# yum -y install multitail
- [root@localhost ~]# multitail -e "fail" /var/log/secure #筛选关键字进行监控
- [root@localhost ~]# multitail -l "ping baidu.com" #监控后面的命令-l将要执行的命令
- [root@localhost ~]# multitail -i /var/log/messages -i /var/log/secure #-i指定一个文件名
9、SSH暴力破解防护-Fail2ban
Fail2ban可以监视你的系统日志然后匹配日志的错误信息正则式匹配执行相应的屏蔽动作一般情况下是调用防火墙屏蔽
下载:http://www.fail2ban.org/wiki/index.php/Downloads
- [root@localhost ~]# cd fail2ban-0.8.11
- [root@localhost fail2ban-0.8.11]# python setup.py install
- [root@localhost fail2ban-0.8.11]# cd files/
- [root@localhost files]# cp ./redhat-initd /etc/init.d/fail2ban
- [root@localhost files]# service fail2ban start
- [root@localhost files]# chkconfig --add fail2ban
- [root@localhost files]# chkconfig fail2ban on
注:需要配置iptables实用,如果重启iptables了也要重启fail2ban,因为fail2ban的原理是调用iptables实时阻挡外界的攻击。
- [root@localhost ~]# grep -v "^#" /etc/fail2ban/jail.conf | grep -v "^$"
- [DEFAULT]
- ignoreip = 127.0.0.1/8#忽略本机IP
- bantime = 600 #符合规则后封锁时间
- findtime = 600 #在多长时间内符合规则执行封锁如600秒达到3次则执行
- maxretry = 3 #最大尝试次数
- backend = auto #日志修改检测日志gamin、polling和auto这三种
- usedns = warn
- [ssh-iptables]
- enabled = true#默认是禁用false
- filter = sshd
- action = iptables[name=SSH, port=ssh, protocol=tcp]
- # sendmail-whois[name=SSH,dest=收件人邮箱, sender=发件人邮箱, sendername="Fail2Ban"]
- logpath = /var/log/sshd.log #响应的错误日志一般在/var/log/secure
- maxretry = 5 #尝试错误次数覆盖全局中的maxretry
注:默认所有的应用防护都是关闭的,需要我们手动开启。fail2ban.conf文件是日志信息,jail.conf文件是保护的具体服务和动作配置信息。
- [root@localhost ~]# touch /var/log/sshd.log
- [root@localhost ~]# service fail2ban restart
- [root@localhost ~]# fail2ban-client status #查看监控已经开启
- Status
- |- Number of jail: 1
- `- Jail list: ssh-iptables
- [root@localhost ~]# iptables -L #iptables过滤表有fail2ban一条规则
- fail2ban-SSH tcp -- anywhere anywhere tcp dpt:ssh
10、连接会话终端持续化-Tmux
Tmux是一个优秀的终端复用软件类似GNU Screen比Screen更加方面、灵活和高效。为了确保连接SSH时掉线不影响任务运行。
rpm -ivh http://pkgs.repoforge.org/rpmforge-release/rpmforge-release-0.5.2-2.el6.rf.x86_64.rpm(安装第三方YUM源)
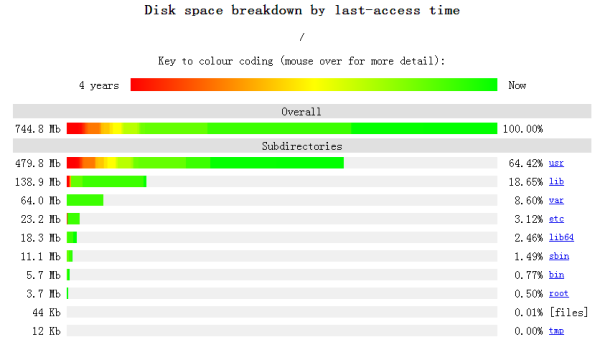
11、页面显示磁盘空间使用情况-Agedu
下载:http://www.chiark.greenend.org.uk/~sgtatham/agedu/
- [root@localhost ~]# tar zxvf agedu-r9723.tar.gz
- [root@localhost ~]# cd agedu-r9723
- [root@localhost ~]# ./configure
- [root@localhost ~]# make && make install
- [root@localhost ~]# agedu -s / #-s扫描
- [root@localhost ~]# agedu -w --address 192.168.0.10:80 #-w输入一个网页链接
- [root@localhost ~]# agedu -w --address 192.168.0.108080 --auth none #--auth关闭认证如果不加端口号会生成一个随机的用浏览器访问
12、安全扫描工具-NMap
NMap是Linux下的网络连接扫描和嗅探工具包用来扫描网上电脑开放的网络连接端。
下载:http://nmap.org/download.html
- [root@localhost ~]# tar jxvf nmap-6.40.tar.bz2
- [root@localhost nmap-6.40]# ./configure
- [root@localhost nmap-6.40]# make && make install
- [root@localhost ~]# nmap 192.168.0.10 #获取基本信息
- [root@localhost ~]# nmap -O 192.168.0.10 #获取系统版本信息
- [root@localhost ~]# nmap -A 192.168.0.10 #获取系统综合信息
- [root@localhost ~]# nmap 192.168.0.0/24 #获取一个网段工作设备基本信息
- -sSTCP扫描
- -sV系统版本检测
13、Web压力测试-Httperf
Httperf比ab更强大,能测试出web服务能承载的最大服务量及发现潜在问题;比如:内存使用、稳定性。最大优势:可以指定规律进行压力测试,模拟真实环境。
下载:http://code.google.com/p/httperf/downloads/list
- [root@localhost ~]# tar zxvf httperf-0.9.0.tar.gz
- [root@localhost ~]# cd httperf-0.9.0
- [root@localhost httperf-0.9.0]# ./configure
- [root@localhost httperf-0.9.0]# make && make install
- [root@localhost ~]# httperf --hog --server=192.168.0.202 --uri=/index.html --num-conns=10000 --wsess=10,10,0.1
参数说明:
--hog:让httperf尽可能多产生连接,httperf会根据硬件配置,有规律的产生访问连接
--num-conns:连接数量,总发起10000请求
--wsess: 用户打开网页时间规律模拟,第一个10表示产生10个会话连接,第二个10表示每个会话连接进行10次请求,0.1表示每个会话连接请求之间的间隔时间/s
13款Linux运维比较实用的工具的更多相关文章
- Linux运维之系统性能---vmstat工具分析内存的瓶颈
为了提高磁盘存取效率, Linux做了一些精心的设计, 除了对dentry进行缓存(用于VFS,加速文件路径名到inode的转换), 还采取了两种主要Cache方式:Buffer Cache和Page ...
- Linux运维之系统性能瓶颈工具vmstat分析
vmstat是一个很好用的检测系统性能工具,没有过多的参数,直接一个vmstat命令即可,不过我们一般加上-w表示宽格式输出.然后再附加上侦测时间即可 例如: vmstat 表示每3秒检测一次并输出系 ...
- 【Linux 运维】 安装PHP工具Composer
一.安装PHP 由于Composer是 PHP 用来管理依赖(dependency)关系的工具.你可以在自己的项目中声明所依赖的外部工具库(libraries),Composer 会帮你安装这些依赖的 ...
- linux运维自动化shell脚本小工具
linux运维shell 脚本小工具,如要分享此文章,请注明文章出处,以下脚本仅供参考,若放置在服务器上出错,后果请自负 1.检测cpu剩余百分比 #!/bin/bash #Inspect CPU # ...
- 【Linux 运维】Linux 目录
目录 [Linux 运维]Centos7初始化网络配置 [Linux 运维]linux系统修改主机名 [Linux 运维]linux系统关机.重启.注销命令 [Linux 运维]linux系统查看版本 ...
- Linux运维工程师入门的10大实用工具
说到工具,在行外可以说是技能,在行内我们一般称为工具,就是运维必须要掌握的工具. 我就大概列出这几方面,这样入门就基本没问题了. 工具如下: 1.Linux系统基础 这个不用说了,是基础中的基础,连这 ...
- 最新linux运维高级架构课13期 架构师课程
有会员购买的,分享给大家.完整一套,可以学习一下. ├─L001-2017linux运维高级架构师13期-运维与自动化运维发展-10节 │ 1-1运维职业发展.avi │ ...
- linux运维中的命令梳理(一)
在linux日常运维中,我们平时会用到很多常规的操作命令. 下面对常用命令进行梳理: 命令行日常系快捷键(不分大小写)CTRL + A 移动光标到行首CTRL + E 移动光标到行末CTRL + U ...
- Linux运维笔记-日常操作命令总结(1)
在linux日常运维中,我们平时会用到很多常规的操作命令. 查看服务器的外网ip [root@redis-new01 ~]# curl ifconfig.me [root@redis-new01 ~] ...
随机推荐
- ignite服务中的bean注入为空
在写ignite服务的时候,通常服务配置在启动文件中: <bean class="org.apache.ignite.services.ServiceConfiguration&quo ...
- 50条规则提高PHP开发提高效率技巧
0.用单引号代替双引号来包含字符串,这样做会更快一些.因为PHP会在双引号包围的字符串中搜寻变量,单引号则不会,注意:只有echo能这么做,它是一种可以把多个字符串当作 参数的“函数”(译注:PHP手 ...
- selenium和pythond的区别
selenium和pythond的区别 天宇6169 | 浏览 137 次 2016-03-18 10:25 2016-03-18 12:24 最佳答案 selenium ide是用来录制的!大概 ...
- 2015年4月27日---C语言:输出特殊图案,请在c环境中运行,看一看,Very Beautiful!
---恢复内容开始--- 题目:输出特殊图案,请在c环境中运行,看一看,Very Beautiful! 1.程序分析:字符共有256个.不同字符,图形不一样. 2.程序源代码: [code=c] #i ...
- iframe2016/4/12
js操作iframe contentWindow 在服务器环境下测试contentDocument二种方法的区别子级iframe修改父级元素内容window.parentwindow.top与w ...
- PAT1016
A long-distance telephone company charges its customers by the following rules: 一个长途电话公司费用告诉它的顾客需要遵循 ...
- json optString getString
optString 和 getString 区别. optString 当接收到的为空时候 不会报错
- CALayer 进阶
转载自:http://www.cofcool.net/development/2015/06/19/ios-study-note-eight-CALayer-info/ The CALayer cla ...
- UIView你知道多少
转载自:http://www.cnblogs.com/likwo/archive/2011/06/18/2084192.html 曾经有人这么说过,在iphone里你看到的,摸到的,都是UIVie ...
- php各项下载地址
Apache2.4下载地址 http://www.apachehaus.com/cgi-bin/download.plx PHP5.6下载地址 http://php.net/downloads.p ...