Distributed traceability with Spring Cloud: Sleuth and Zipkin
I. Sleuth
0. Concept
- Trace
- A set of spans that form a call tree structure, forms the trace of the request.
- Span
- It is the basic unit of work, for example a call to a service. They are identified with a span ID and a trace ID to which span is owned. They have start and end, and with it you get track the response time between requests.
- Tag
- Key/value pair that identifies certain information in the span. It doesn't contain timestamps, it just identifies.
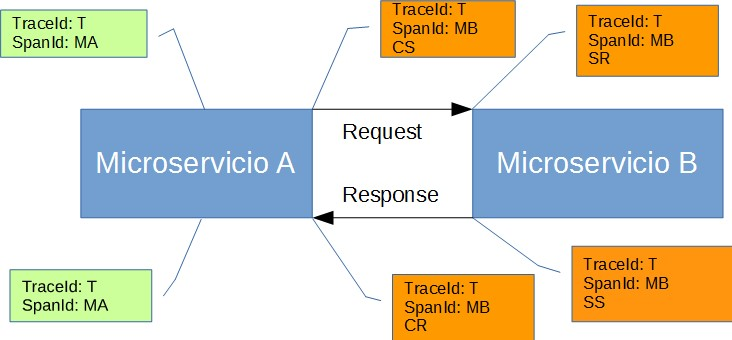
Annotation: Used to record the existence of an event in time. With Brave instrumentation, we no longer need to set special events for Zipkin to understand who the client and server are, where the request started, and where it ended. For learning purposes, however, we mark these events to highlight what kind of an action took place.
- cs: Client Sent. The client has made a request. This annotation indicates the start of the span.
- sr: Server Received: The server side got the request and started processing it. Subtracting the
cstimestamp from this timestamp reveals the network latency. - ss: Server Sent. Annotated upon completion of request processing (when the response got sent back to the client). Subtracting the
srtimestamp from this timestamp reveals the time needed by the server side to process the request. - cr: Client Received. Signifies the end of the span. The client has successfully received the response from the server side. Subtracting the
cstimestamp from this timestamp reveals the whole time needed by the client to receive the response from the server.
1. pom
        <dependency>
            <groupId>org.springframework.cloud</groupId>
            <artifactId>spring-cloud-starter-sleuth</artifactId>
        </dependency>
2. config
1) sampler
---
spring:
  sleuth:
    sampler:
      probability: 1.0
II. zipkin
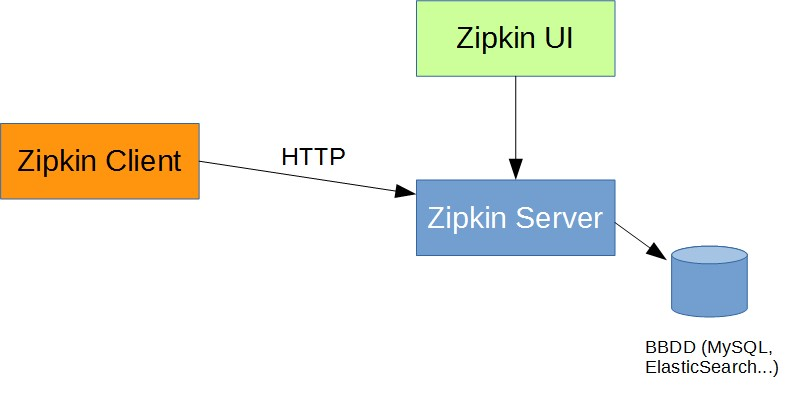
0. way
1) http
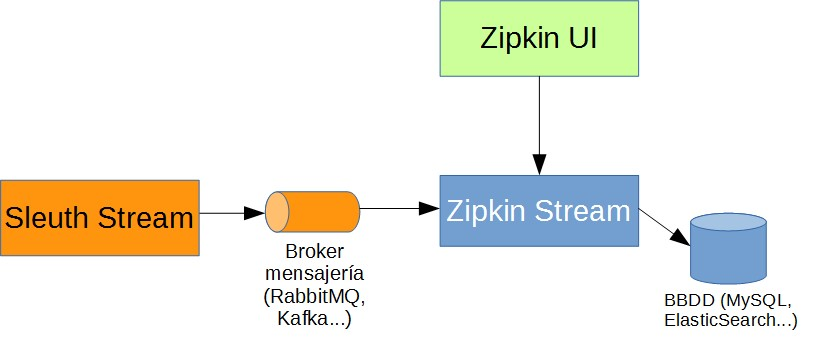
2) Messaging Brokers
0. zipkin client
1) pom
        <dependency>
            <groupId>org.springframework.cloud</groupId>
            <artifactId>spring-cloud-starter-zipkin</artifactId>
        </dependency>
2) config
(1) base url
---
spring:
  zipkin:
    base-url: http://localhost:9411
(2) sender
A. RabbitMQ
---
spring:
  zipkin:
    sender:
      type: RABBIT
B. Kafka
---
spring:
  zipkin:
    sender:
      type: KAFKA
C. Web
default
1. zipkin server
upgrade to Spring Boot 2.0 NoClassDefFoundError UndertowEmbeddedServletContainerFactory
1) down
https://mvnrepository.com/artifact/io.zipkin.java/zipkin-server
2) run
es2.4.x安装在WSL中。详细 see 《Elasticsearch 2.4 安装》
(1) for Rabbit
version: RabbitMQ3.7.13(erlang 21.3)
java -jar zipkin-server--exec.jar --RABBIT_URI=amqp://admin:admin@192.168.42.124:5672/sleuth --STORAGE_TYPE=elasticsearch --ES_HOSTS=http://localhost:9200 --ES_HTTP_LOGGING=BASIC
(2) for kafka
version: Kafka1.0.2(Scale 2.11)
java -jar zipkin-server--exec.jar --KAFKA_BOOTSTRAP_SERVERS=,, --STORAGE_TYPE=elasticsearch --ES_HOSTS=http://localhost:9200 --ES_HTTP_LOGGING=BASIC
III. MQ
1. RabbitMQ
0) pom
        <dependency>
            <groupId>org.springframework.cloud</groupId>
            <artifactId>spring-cloud-stream</artifactId>
        </dependency>
        <dependency>
            <groupId>org.springframework.cloud</groupId>
            <artifactId>spring-cloud-stream-binder-rabbit</artifactId>
        </dependency>
1) config
---
spring:
  rabbitmq:
    addresses: 192.168.42.124
    port: 5672
    username: admin
    password: admin
    virtual-host: sleuth
2) virtual hosts
切换到Admin选项卡,点击右侧的virtual hosts

2. Kafka
0) pom
        <dependency>
            <groupId>org.springframework.cloud</groupId>
            <artifactId>spring-cloud-stream</artifactId>
        </dependency>
        <dependency>
            <groupId>org.springframework.cloud</groupId>
            <artifactId>spring-cloud-stream-binder-kafka</artifactId>
        </dependency>
1) config
spring:
  kafka:
    bootstrap-servers:
      - 192.168.42.186:9092
      - 192.168.42.187:9092
      - 192.168.42.188:9092
IV. Effect Diagram
0. gateway
http://localhost:8311/user/listPage

1. zipkin server
http://localhost:9411

2. RabbitMQ
连接了4个服务:zipkin server
gateway->user-service->userDetails
http://192.168.42.124:15672/#/connections

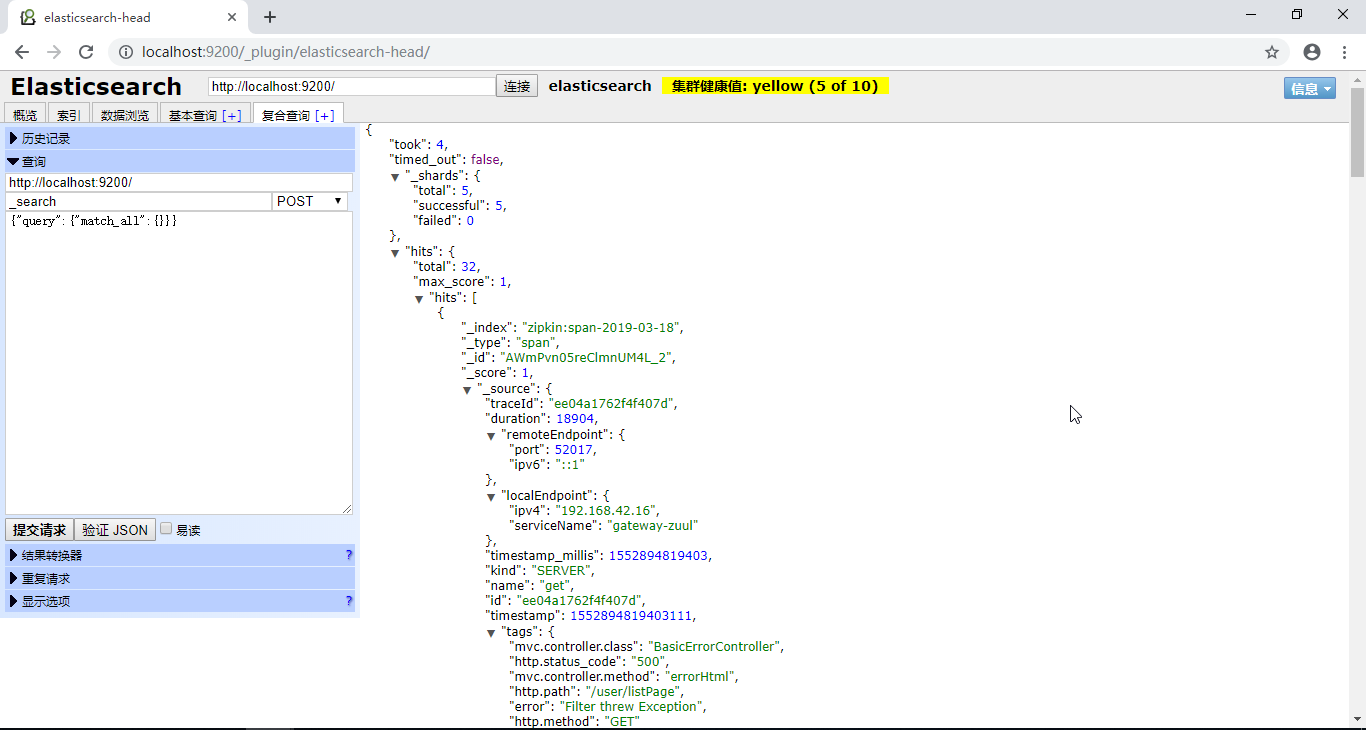
3. ES2.4.x
http://localhost:9200/_plugin/elasticsearch-head
Reference:
1. Trazabilidad Distribuida con Spring Cloud: Sleuth y Zipkin
Distributed traceability with Spring Cloud: Sleuth and Zipkin的更多相关文章
- 跟我学SpringCloud | 第十一篇:使用Spring Cloud Sleuth和Zipkin进行分布式链路跟踪
SpringCloud系列教程 | 第十一篇:使用Spring Cloud Sleuth和Zipkin进行分布式链路跟踪 Springboot: 2.1.6.RELEASE SpringCloud: ...
- Spring Cloud sleuth with zipkin over RabbitMQ教程
文章目录 Spring Cloud sleuth with zipkin over RabbitMQ demo zipkin server的搭建(基于mysql和rabbitMQ) 客户端环境的依赖 ...
- spring cloud 入门系列八:使用spring cloud sleuth整合zipkin进行服务链路追踪
好久没有写博客了,主要是最近有些忙,今天忙里偷闲来一篇. =======我是华丽的分割线========== 微服务架构是一种分布式架构,微服务系统按照业务划分服务单元,一个微服务往往会有很多个服务单 ...
- Spring Cloud Sleuth 和 Zipkin 进行分布式跟踪使用指南
分布式跟踪允许您跟踪分布式系统中的请求.本文通过了解如何使用 Spring Cloud Sleuth 和 Zipkin 来做到这一点. 对于一个做所有事情的大型应用程序(我们通常将其称为单体应用程序) ...
- springcloud(十二):使用Spring Cloud Sleuth和Zipkin进行分布式链路跟踪
随着业务发展,系统拆分导致系统调用链路愈发复杂一个前端请求可能最终需要调用很多次后端服务才能完成,当整个请求变慢或不可用时,我们是无法得知该请求是由某个或某些后端服务引起的,这时就需要解决如何快读定位 ...
- 使用Spring Cloud Sleuth和Zipkin进行分布式链路跟踪
原文:http://www.cnblogs.com/ityouknow/p/8403388.html 随着业务发展,系统拆分导致系统调用链路愈发复杂一个前端请求可能最终需要调用很多次后端服务才能完成, ...
- spring cloud深入学习(十三)-----使用Spring Cloud Sleuth和Zipkin进行分布式链路跟踪
随着业务发展,系统拆分导致系统调用链路愈发复杂一个前端请求可能最终需要调用很多次后端服务才能完成,当整个请求变慢或不可用时,我们是无法得知该请求是由某个或某些后端服务引起的,这时就需要解决如何快读定位 ...
- 【spring cloud】spring cloud Sleuth 和Zipkin 进行分布式链路跟踪
spring cloud 分布式微服务架构下,所有请求都去找网关,对外返回也是统一的结果,或者成功,或者失败. 但是如果失败,那分布式系统之间的服务调用可能非常复杂,那么要定位到发生错误的具体位置,就 ...
- springcloud --- spring cloud sleuth和zipkin日志管理(spring boot 2.18)
前言 在spring cloud分布式架构中,系统被拆分成了许多个服务单元,业务复杂性提高.如果出现了异常情况,很难定位到错误位置,所以需要实现分布式链路追踪,跟进一个请求有哪些服务参与,参与的顺序如 ...
随机推荐
- C# Monitor的Wait和Pulse方法使用详解
[转载]http://blog.csdn.net/qqsttt/article/details/24777553 Monitor的Wait和Pulse方法在线程的同步锁使用中是比较复杂的,理解稍微困难 ...
- 使用cmake编译luabind
编写了一下cmakelists.txt文件 根目录 cmake_minimum_required(VERSION 2.8)project (Test) add_definitions( "/ ...
- supervisord 知识点
官方英文: Supervisor: A Process Control System Supervisor: 一个进程管理系统. Supervisor is a client/server syste ...
- bzoj 2351 [BeiJing2011]Matrix——二维哈希
题目:https://www.lydsy.com/JudgeOnline/problem.php?id=2351 就是先把每行单独从左到右扫着乘一个 b1 哈希起来,然后再按列从上往下乘一个 b2 哈 ...
- 安装plsql developer
需求:要连接oracle数据库,不想在本地安装oracle,太大,又占内存,所以用plsql developer.. 在网上看了很多博客,妈呀,被毒的不清,一直提示初始化失败,就是那个oci,dll ...
- Eclipse各个版本及其对应代号、下载地址列表
版本号 代码 日期 下载地址 Eclipse 3.1 IO[木卫一,伊奥] 2005 http://archive.eclipse.org/eclipse/downloads/drops/R-3.1- ...
- pyqt环境安装
pyqt环境配置 pip install pyqt5 windows下 pip install pyqt5-tools linux安装designer sudo apt install qttools ...
- AM软件中reconfig的方法
1.先进入admin 2.选数据库名: 比如这个HULLBLOCK/AFTBLOCKS 3. 选好数据库后在命令栏依次输入以下命令,输入每一行后回车一下: FROM DB HULLBLOCK/AF ...
- CentOS7切换到root用户和退回普通用户
切换成root用户: sudo su - 退出root用户并切换回普通用户: exit
- QT 5 初学1 多窗口切分-续
转载:omydocument 主窗口本身就带着菜单,工具栏,和状态栏,作为一个基本应用,这些都不用操心. 一个工具,需要把窗口切分成三部分,左边,右上,右下.左边显示选择的功能,右上是主窗口.右下作为 ...