
MongoDB with D3.js
MongoDB with D3.js
I consider interactive data visualization to be the critical tool for exploration of high-dimensional data.
That’s led me to spend a good amount of time in the last few years learning some new skills (D3 and CoffeeScript) and developing some new tools, particularly the R package R/qtlcharts, which provides interactive versions of the many data visualizations in R/qtl, my long-in-development R package for mapping genetic loci (called quantitative trait loci, QTL) that underlie complex trait variation in experimental organisms.
R/qtlcharts is rough in spots, and while it works well for moderate-sized data sets, it can’t well handle truly large-scale data, as it just dumps all of the data into the file viewed by a web browser.
For large-scale data, one needs to dynamically load slices of the data based on user interactions. It seems best to have a formal database behind the scenes. But I think I’m not unusual, among statisticians, in having almost no experience working with databases. My collaborators tend to keep things in Excel. Even for quite large problems, I keep things in flat files.
So, I’ve been trying to come to understand the whole database business, and how I might use one for larger-scale data visualizations. I think I’ve finally made that last little conceptual step, where I can see what I need to do. I made a small illustration in my d3examplesrepository on GitHub.
Learning MongoDB
I thought mongoDB seemed like a good database to try:
- storage of general documents seems a good match for the sort of data I work with
- use of JSON/BSON seems a good match for D3.js
So I’ve been taking an online-course though MongoDB University — the one for Node.js developers. I should have done the more general one, using Python, but I was thinking it’d be interesting to learn Node, which is basically command-line scripting in javascript. I guess the advantage of node is that you can just write javascript. But personally I prefer to switch to the language appropriate to the task, so I’m not too hot on node. But maybe I just haven’t come to understand how best to make use of the whole callback function business.
MongoDB is not all that hard. It’s just kind of boring. The MongoDB Uni class is quite well done, though a few of the lectures were frustratingly out-of-date. I have the MongoDB book, but it’s been rough going; the class has been good for that. (The weekly deadlines have been good for motivating me to get through the dull — for me — material.)
The obvious bits with a database: how to get stuff into it and then back out of it. And then I guess deleting or changing stuff. So that’s all fine. I also learned about making indexes, so that you can more quickly get stuff out later. I don’t think my needs for these things are all that complicated. And so I think I understand those bits.
Getting the data for the data vis
The last key step that I was pondering last night: how do I, based on some user interaction with a data visualization (clicking on a point, or some such), fire off a request to the database and get the data back?
I guessed some sort of RESTful API type thing. But while I can write that down, I don’t really understand what the hell it means.
But then I thought, what I need is to use some sort of HTTP GET request. I kind of know what that means, but I don’t really understand what happens on the back end.
I’d been poking around in pymongo, the python-based mongoDB driver. (I like it much better than the ruby or node drivers.) And as part of the Mongo University class, we used express with Node to do some HTTP GET and PUSH. If I want to grab some bit of data, I could have a python script running on the back end, looking for an http request, and then based on some key that was passed, grabbing data from the database and sending it back as JSON.
So I looked around for how to do this with mongoDB, found sleepy mongoose, but that seemed like more than I wanted, and then came to bottle, which seemed like what I needed to handle the http bit. The example on the front page is just what I want: take a name from a URL and use it as input to some function, and give results back.
MongoDB/D3 illustration
The goal of all this: as part of some data visualization, the user will hover over or click a point, and this will lead to a request to the database, and then a plot of the data that comes back.
It seemed like a simple test case would be to use the data for Anscombe’s quartet. Put the four series into a MongoDB database, and then have four buttons that, when clicked, cause a request to the database to grab the corresponding series, which is then plotted.
So first I wrote an R script to grab the data from the table on the wikipedia page and write it to a JSON file. I’m sure there was an easier way to get the data in a suitable form, but I was really procrastinating from writing a paper at this point, so I thought I’d test my web scraping skill in a simple case.
I then wrote a python script that reads in the JSON file and inserts the data into a mongoDB database. You make a database connection with pymongo.MongoClient() and insert the documents with the insert_one() method to a collection. I later added an index with create_index(); pretty silly here, but for large problems it would be useful.
So, the data’s in the database. How to get it back out? I wrote a second python script (just 8 lines, really), that uses bottle to create a server that connects a URL to a function call. The function then uses pymongo to find the corresponding document and send it back as JSON. One tricky bit that needed some extra googling was getting the browser to allow the request.
The D3 code (in coffeescript) is pretty standard. On clicking a button, I call d3.json with the appropriate URL that corresponds to a request from the python script; the data come back as JSON, and are then passed to a callback function to make the actual plot.
This MongoDB/D3 illustration is a toy example, but it represents an important step for me, personally. I’m rather proud of it.
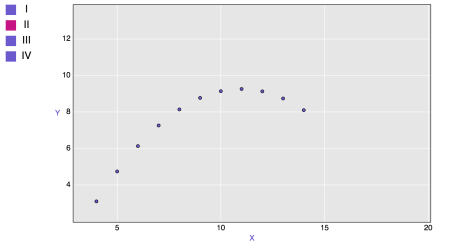
I don’t actually have a live example of this. That’s the next thing: how to have this running on a proper web server, rather than just locally.
MongoDB with D3.js的更多相关文章
- D3.js学习(七)
上一节中我们学会了如何旋转x轴标签以及自定义标签内容,在这一节中,我们将接触动画(transition) 首先,我们要在页面上添加一个按钮,当我们点击这个按钮时,调用我们的动画.所以,我们还需要在原来 ...
- D3.js学习(一)
从今天开始我将和大家一起学习D3.js(Data-Driven Documents),由于国内关于D3的学习资料少之又少,所以我觉得很有必要把自己学习过程记录下来,供同学们参考,如果文章有有哪些表达有 ...
- D3.js学习记录
<!DOCTYPE html PUBLIC "-//W3C//DTD XHTML 1.0 Transitional//EN" "http://www.w3.org/ ...
- D3.js部署node环境开发
总结一段D3.js部署node环境的安装过程 准备阶段: 首先电脑上要安装node环境,这个阶段过滤掉,如果node环境都不会装,那就别玩基于node环境搞的其他东西了. 搭建环境: 我在自己的F:系 ...
- d3.js读书笔记-1
d3.js入门 d3入门 D3是一个强大的数据可视化工具,它是基于Javascript库的,用于创建数据可视化图形.在生成可视化图形的过程中,需要以下几步: 把数据加载到浏览器的内存空间: 把数据绑定 ...
- 【 D3.js 进阶系列 — 6.1 】 缩放的应用(Zoom)
缩放(Zoom)是另一种重要的可视化操作,主要是使用鼠标的滚轮进行. 1. zoom 的定义 缩放是由 d3.behavior.zoom() 定义的. var zoom = d3.behavior.z ...
- [资料搜集狂]D3.js数据可视化开发库
偶然看到一个强大的D3.js,存档之. D3.js 是近年来十分流行的一个数据可视化开发库. 采用BSD协议 源码:https://github.com/mbostock/d3 官网:http://d ...
- D3.js 用层画条形图
<!DOCTYPE html> <html> <head> <meta charset="utf-8"> <title> ...
- 【 D3.js 入门系列 --- 3 】 做一个简单的图表!
前面说了几节,都是对文字进行处理,这一节中将用 D3.js 做一个简单的柱形图. 做柱形图有很多种方法,比如用 HTML 的 div 标签,或用 svg . 推荐用 SVG 来做各种图形.SVG 意为 ...
随机推荐
- 域 搭建OU 组织单元
以这个界面开始操作: 在 baidu.com 右键---新建----组织单位----北京分公司 在 baidu.com 右键---新建----组织单位----北京分公司 在北京分公司 和南京分公司下面 ...
- ccf 201503-5 最小花费 这题交上去只有10分嗨!求大佬的题解啊
问题描述 C国共有n个城市.有n-1条双向道路,每条道路连接两个城市,任意两个城市之间能互相到达.小R来到C国旅行,他共规划了m条旅行的路线,第i条旅行路线的起点是si,终点是ti.在旅行过程中,小R ...
- .Net 之 RPC 框架之Hprose(远程调用对象)
实现远程调用对象,跨进程访问对象,可实现分布式 首先给服务端和客户端 nuget Hprose 可使用tcp和http两种调用方式 服务端 using Hprose.Server; using Sys ...
- BLSTM的训练算法、解码算法以及模型的改进
摘要 BLSTM解码时,解码器需要等待整个音频到达后才开始解码,因为时间反方向的前向传播需要末尾的历史信息.BLSTM这一延时问题使其不适用与实时语音识别.context-sensitive-chun ...
- 【vue】组件使用Deferred特性
延迟加载组件 defer的意思是"延迟",所以deferred对象的含义就是"延迟"到未来某个点再执行. <template> <div> ...
- 第十三节,OPenCV学习(二)图像的简单几何变换
图像的简单几何变换 几何变换不改变图像的像素值,只是在图像平面上进行像素的重新安排 适当的几何变换可以最大程度地消除由于成像角度.透视关系乃至镜头自身原因所造成的几何失真所产生的的负面影响. 一.图像 ...
- 20175204 张湲祯 2018-2019-2《Java程序设计》2
20175204 张湲祯 2018-2019-2<Java程序设计>2 必做课下作业MyCP 要求 编写MyCP.java 实现类似Linux下cp XXX1 XXX2的功能,要求MyCP ...
- LNMP安装目录及配置文件位置
LNMP相关软件安装目录 Nginx 目录: /usr/local/nginx/ MySQL 目录 : /usr/local/mysql/MySQL数据库所在目录:/usr/local/mysql/v ...
- NOIP2018Day1T2 货币系统
题目描述 在网友的国度中共有 \(n\) 种不同面额的货币,第 \(i\) 种货币的面额为 \(a[i]\),你可以假设每一种货币都有无穷多张.为了方便,我们把货币种数为 \(n\).面额数组为 \( ...
- 【转载】django 过滤器 、日期格式化参数
过滤器相关: 一.形式:小写{{ name | lower }} 二.串联:先转义文本到HTML,再转换每行到 标签{{ my_text|escape|linebreaks }} 三.过滤器的参数显示 ...