Prometheus之Exporter开发
Prometheus开发Exporter简介
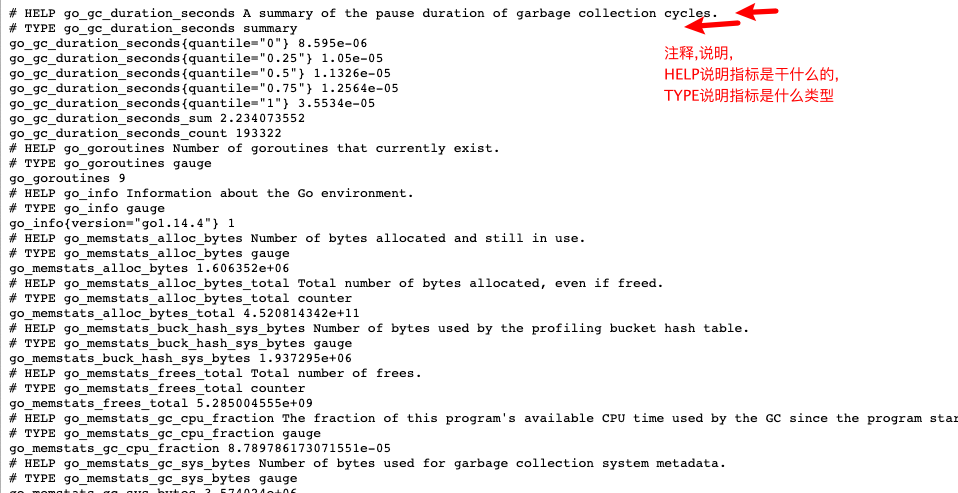
Exporter 本身是一个http 服务,其指标结果只要符合 Prometheus 规范就可以被 Prometheus 使用。
Prometheus中metric的类型
Prometheus的Client Library提供度量的四种基本类型包括
// Counter 计数器

// Gauge  仪表盘

// Histogram 直方图

// Summary 概要

// Prometheus中metric的格式

// 格式:<metric name>{<label name>=<label value>, ...}

// 例如:api_http_requests_total{method="POST", handler="/messages"}

// metric name:  唯一标识,命名遵循[a-zA-Z_:][a-zA-Z0-9_:]*.
Counter
Counter类型好比计数器,用于统计类似于: cpu时间,api访问总次数,异常发生次数等等场景,这些指标的特点就是增加不减少.
因此当我们需要统计cpu的使用率时,我们需要使用rate{}函数计算该counter在过去一段时间每个时间序列上的每秒的平均增长率.
一个Counter标识一个累计度量,只增不减,重启后恢复为0,适用于访问次数统计,异常次数统计等场景.
Gauge
Gauge类型,英文直译的话叫"计量器",但是和Counter的翻译太类似了,因此我个人更喜欢使用"仪表盘"这个称呼,仪表盘的特点就是可以增加或者减少的,因此Gauge适合用于如: 当前内存使用率,当前cpu使用率,当前温度,当前速度等等一系列的监控指标
Gauge表示可变化的度量值,适用于CPU,内存使用率等
Histogram
Histogram柱状图这个比较直接,更多的是用于统计一些数据分布的情况,用于计算在一定范围的分布情况,同时还提供了度量指标值的总和.
Histogram对指标的范围性(区间)统计,比如内存在0%-30%, 30%-70%之间的采样次数
Histogram包含三个指标
<basename>:  度量值名称

<basename>_count:  样本反正总次数

<basename>_sum:  样本发生次数中值的总和

<basename>_bucket{le="+Inf"}: 每个区间的样本数
Summary
Summary摘要和Histogram柱状图比较类似,主要用于计算在一定时间窗口范围内度量指标对象的总数以及所有对量指标的总和.
和histogram类似,提供次数和总和,同时提供每个滑动窗口中的分位数.
Histogram和Summary的对比
| 序号 | histogram | Summary |
|---|---|---|
| 配置 | 区间配置 | 分位数和滑动窗口 |
| 客户端性能 | 只需增加counters代价小 | 需要流式计算代价高 |
| 服务端性能 | 计算分位数消耗大,可能会耗时 | 无需计算,代价小 |
| 时序数量 | _sum、_count、bucket | _sum、_count、quantile |
| 分位数误差 | bucket的大小有关 | φ的配置有关 |
| φ和滑动窗口 | Prometheus 表达式设置 | 客户端设置 |
| 聚合 | 根据表达式聚合 | 一般不可聚合 |
Prometheus中的Jobs和INSTANCES
Instances
// 仅采集的API endpoint
Jobs
// 相同目的的Instances

// 例如: 四个节点上的api-server

job: api-server

instance 1: 1.2.3.4:5670

instance 2: 1.2.3.4:5671

instance 3: 5.6.7.8:5670

instance 4: 5.6.7.8:5671
Prometheus拉去目标数据时, 会自动给目标的时序上增加一些标签,用于唯一标识,如果时序中本省已经包含,那么取决于honor_labels
// Job: 会增加Job名称

// instance: 增加host: port
开发一个简单Exporter
Prometheus为开发提供了客户端工具,用于为自己的中间件开发Exporter,对接Prometheus, 目前支持go,java,python,ruby
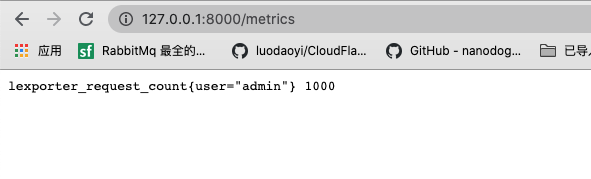
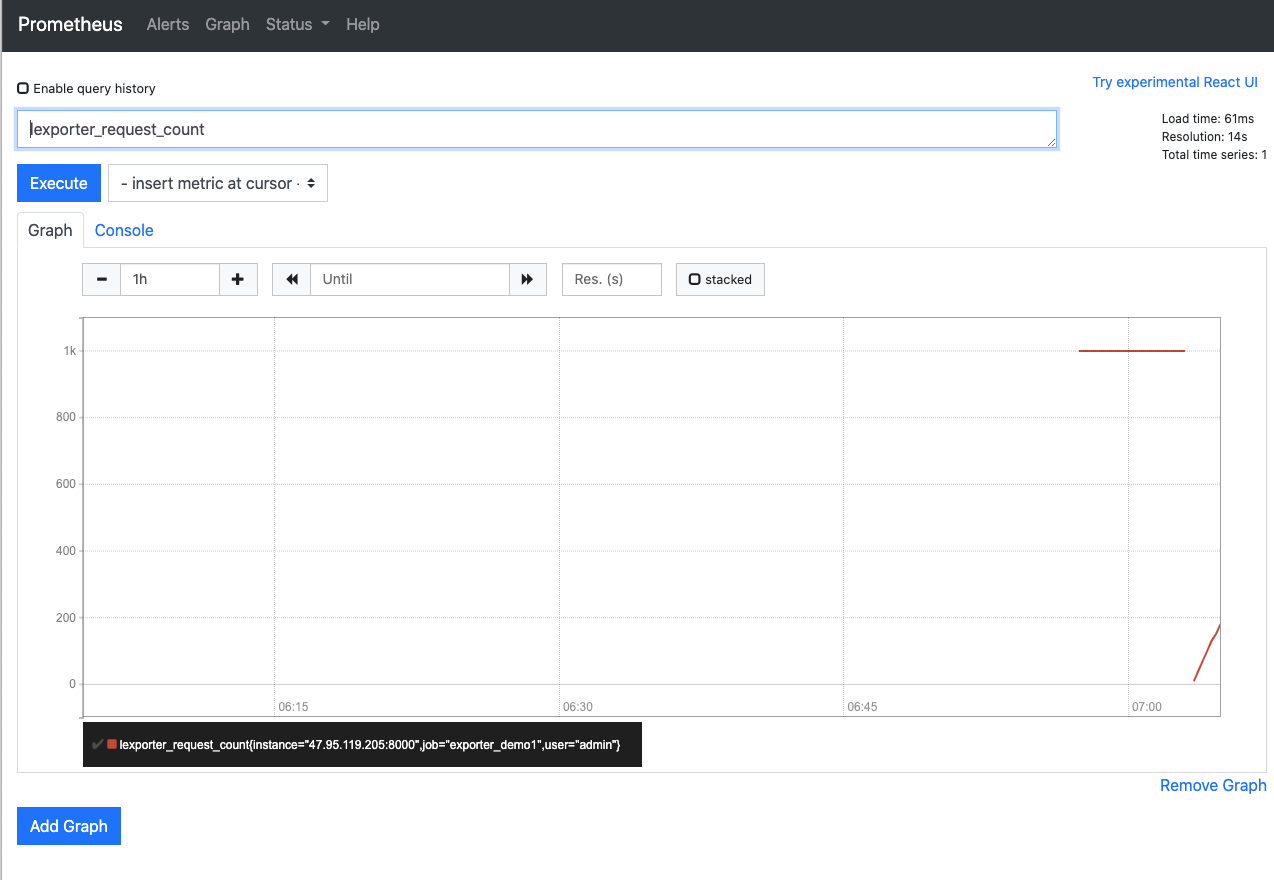
监听HTTP请求返回一行字符串
lexporter_request_count{user="admin"} 1000
package main

import (

	"fmt"

	"net/http"

)

func HelloHandler(w http.ResponseWriter, r *http.Request) {

	fmt.Fprintf(w, "lexporter_request_count{user=\"admin\"} 1000" )

}

func main () {

	http.HandleFunc("/metrics", HelloHandler)

	http.ListenAndServe(":8000", nil)

}
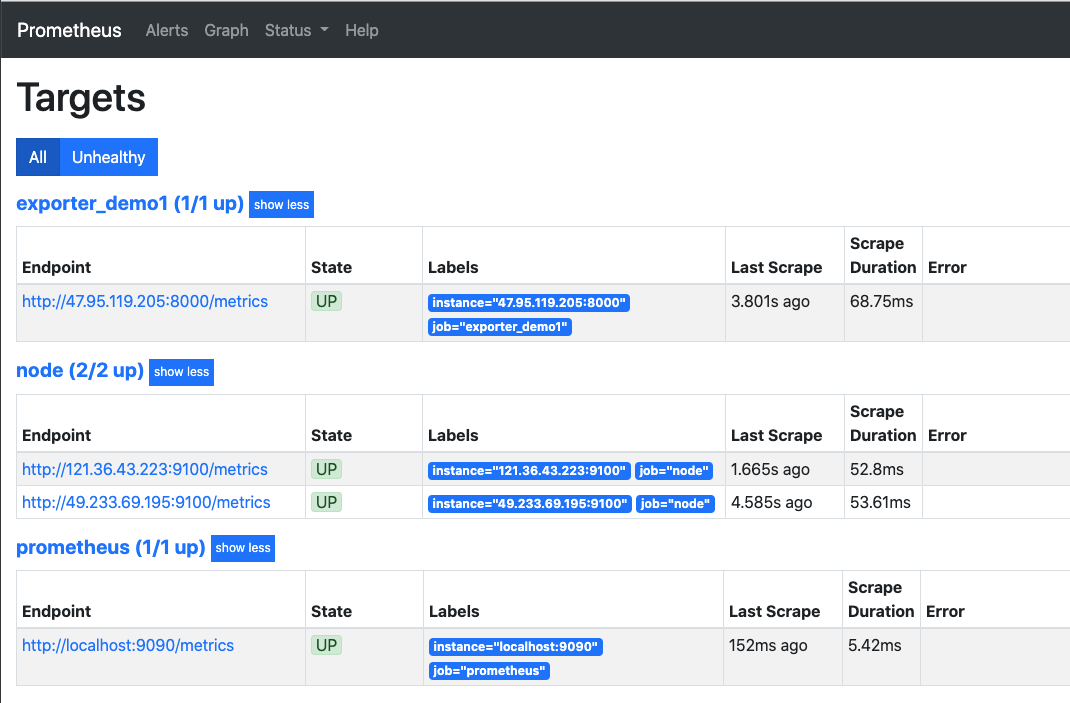
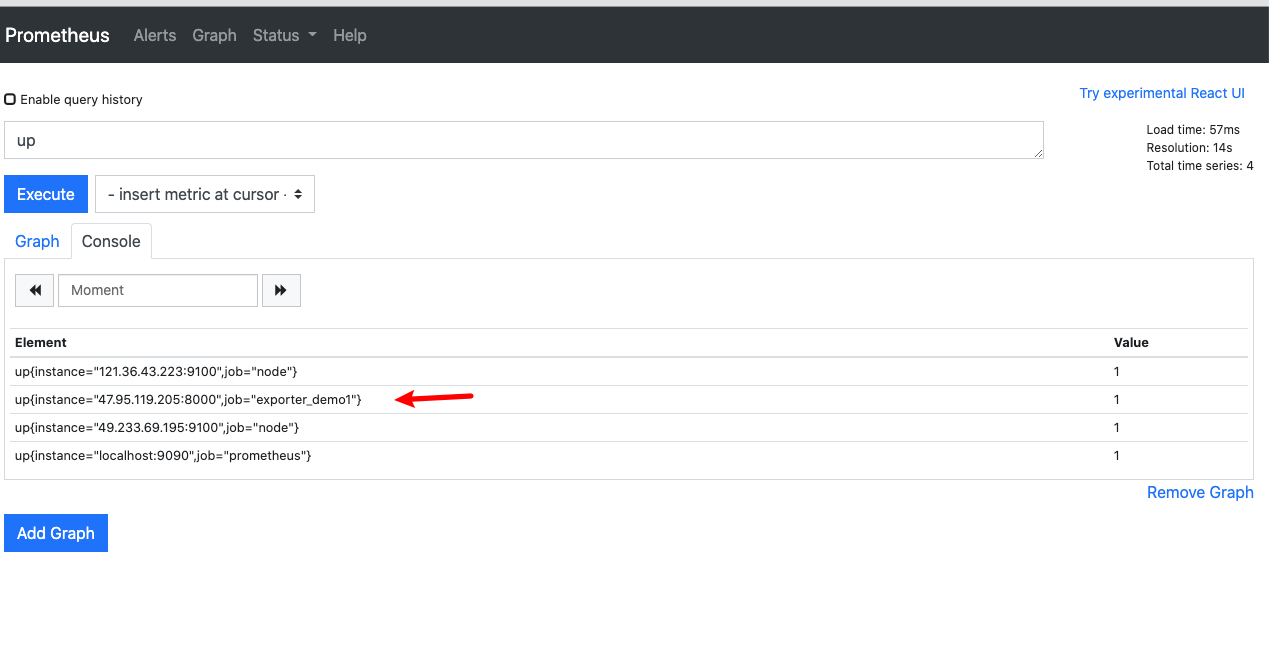
配置Prometheus,将exporter到Prometheus中
计数器
Counter 类型代表一种样本数据单调递增的指标,即只增不减,除非监控系统发生了重置。例如,你可以使用 counter 类型的指标来表示服务的请求数、已完成的任务数、错误发生的次数等。
我们对程序进行改造,累计计算count的数量
example1
package main

import (

	"fmt"

	"net/http"

)

type Counter struct {

	count int64

}

func (c *Counter) Add(count int64) int64  {

	c.count += count

	return c.count

}

var counter = new(Counter)

func HelloHandler(w http.ResponseWriter, r *http.Request) {

	fmt.Fprintf(w, "lexporter_request_count{user=\"admin\"} %d",counter.Add(10) )

}

func main () {

	http.HandleFunc("/metrics", HelloHandler)

	http.ListenAndServe(":8000", nil)

}
example2
package main

import (

	"github.com/prometheus/client_golang/prometheus"

	"github.com/prometheus/client_golang/prometheus/promhttp"

	"net/http"

)

func main() {

	// counter

	requestTotal := prometheus.NewCounter(prometheus.CounterOpts{

		Name: "request_total",

		Help: "request total",

	})

	codeStatus := prometheus.NewCounterVec(prometheus.CounterOpts{

		Name: "status_code_total",

		Help: "status_code total",

	},[]string{"code"})

	requestTotal.Add(10)

	codeStatus.WithLabelValues("200").Add(10)

	codeStatus.WithLabelValues("500").Add(20)

	codeStatus.WithLabelValues("404").Add(30)

	prometheus.MustRegister(requestTotal)

	prometheus.MustRegister(codeStatus)

	// 暴露

	http.Handle("/metrics", promhttp.Handler())

	http.ListenAndServe(":8888", nil)

}
Gauge(固定label和非固定label)
package main

import (

	"github.com/prometheus/client_golang/prometheus"

	"github.com/prometheus/client_golang/prometheus/promhttp"

	"net/http"

)

func main()  {

	// counter

	// guage

	// historgram

	// summary

	// metrics name(label=label_value) metrics_valu

	// 有lable

	// label/label_value  固定

	// 无label(固定lable)

	// lable/label_value  变化的

	cpu := prometheus.NewGauge(prometheus.GaugeOpts{

		Name: "cpu",

		Help: "cpu total",

		// 没有lable和固定lable一样的

		ConstLabels: prometheus.Labels{"a":"xxx"},

	})

	// 非固定label

	disk := prometheus.NewGaugeVec(prometheus.GaugeOpts{

		Name: "disk",

		Help: "disk total",

	},[]string{"mount"})

	cpu.Set(2222)

	disk.WithLabelValues("/mnt/sda1:").Set(100)

	disk.WithLabelValues("/mnt/sda2:").Set(200)

	disk.WithLabelValues("/mnt/sda3:").Set(200)

	disk.WithLabelValues("/mnt/sda4:").Set(200)

	// 注册指标信息

	prometheus.MustRegister(cpu)

	prometheus.MustRegister(disk)

	// 暴露

	http.Handle("/metrics",promhttp.Handler())

	http.ListenAndServe(":8888",nil)

}
historgram
example1
package main

import (

	"github.com/prometheus/client_golang/prometheus"

	"github.com/prometheus/client_golang/prometheus/promhttp"

	"net/http"

)

func main() {

	// historgram

	request_time := prometheus.NewHistogramVec(prometheus.HistogramOpts{

		Name: "request_time",

		Help: "request time",

	},[]string{"url"})

	prometheus.MustRegister(request_time)

	request_time.WithLabelValues("/aaa").Observe(6)

	// 暴露

	http.Handle("/metrics", promhttp.Handler())

	http.ListenAndServe(":8888", nil)

}
summary
package main

import (

	"github.com/prometheus/client_golang/prometheus"

	"github.com/prometheus/client_golang/prometheus/promhttp"

	"net/http"

)

func main() {

	// summary

	requestsummary := prometheus.NewSummaryVec(prometheus.SummaryOpts{

		Name: "request_time_summary",

		Help: "request time summary",

		Objectives: map[float64]float64{0.5: 0.05,0.9:0.09},

	},[]string{"url"})

	prometheus.MustRegister(requestsummary)

	requestsummary.WithLabelValues("/aaa").Observe(6)

	requestsummary.WithLabelValues("/aaa").Observe(2)

	// 暴露

	http.Handle("/metrics", promhttp.Handler())

	http.ListenAndServe(":8888", nil)

}
值的修改(事件触发或者时间触发)
package main

import (

	"fmt"

	"github.com/prometheus/client_golang/prometheus"

	"github.com/prometheus/client_golang/prometheus/promhttp"

	"math/rand"

	"net/http"

	"strconv"

	"time"

)

func main()  {

	// 无label(固定lable)

	// lable/label_value  变化的

	cpu := prometheus.NewGauge(prometheus.GaugeOpts{

		Name: "cpu",

		Help: "cpu total",

		// 没有lable和固定lable一样的

		ConstLabels: prometheus.Labels{"a":"xxx"},

	})

	// 非固定label

	disk := prometheus.NewGaugeVec(prometheus.GaugeOpts{

		Name: "disk",

		Help: "disk total",

	},[]string{"mount"})

	cpu.Set(2222)

	disk.WithLabelValues("/mnt/sda1:").Set(100)

	disk.WithLabelValues("/mnt/sda2:").Set(200)

	disk.WithLabelValues("/mnt/sda3:").Set(200)

	disk.WithLabelValues("/mnt/sda4:").Set(200)

	codeStatus := prometheus.NewCounterVec(prometheus.CounterOpts{

		Name: "status_code_total",

		Help: "status_code total",

	},[]string{"code"})

	codeStatus.WithLabelValues("200").Add(10)

	codeStatus.WithLabelValues("500").Add(20)

	codeStatus.WithLabelValues("404").Add(30)

	// counter

	requestTotal := prometheus.NewCounter(prometheus.CounterOpts{

		Name: "request_total",

		Help: "request total",

	})

	requestTotal.Add(10)

	// 值的修改

	// 修改的时间 => 触发

	// 时间触发

	// 磁盘使用, cpu使用,内存使用

	go func() {

		for range time.Tick(time.Second) {

			disk.WithLabelValues("/mnt/sda1").Set(float64(rand.Int()))

		}

	}()

	// 事件触发,业务请求

	http.HandleFunc("/",func(w http.ResponseWriter,r *http.Request){

		requestTotal.Inc()

		codeStatus.WithLabelValues(strconv.Itoa(rand.Intn(5) * 100)).Add(1)

		fmt.Fprintf(w,"hi")

	})

	// 注册指标信息

	prometheus.MustRegister(cpu)

	prometheus.MustRegister(disk)

	prometheus.MustRegister(requestTotal)

	// 暴露

	http.Handle("/metrics",promhttp.Handler())

	http.ListenAndServe(":8888",nil)

}
Prometheus之Exporter开发的更多相关文章
- [转帖]prometheus数据采集exporter全家桶
prometheus数据采集exporter全家桶 Rainbowhhy1人评论2731人阅读2019-04-06 15:38:32 https://blog.51cto.com/13053917/2 ...
- 【开源监控】Prometheus+Node Exporter+Grafana监控linux服务器
Prometheus Prometheus介绍 Prometheus新一代开源监控解决方案.github地址 Prometheus主要功能 多维 数据模型(时序由 metric 名字和 k/v 的 l ...
- Prometheus + Node Exporter + Grafana 监控主机运行信息
上一篇文章中讲了如何利用Prometheus和Grafana监控SpringBoot应用的JVM信息,这次就来看看如何监控 服务器运行状态,先列出用到的工具: Prometheus node_ex ...
- Prometheus 自定义exporter 监控key
当Prometheus的node_exporter中没有我们需要的一些监控项时,就可以如zabbix一样定制一些key,让其支持我们所需要的监控项. 例如,我要根据 逻辑cpu核数 来确定load的告 ...
- 使用golang编写prometheus metrics exporter
metrcis输出 collector.go package main import ( "github.com/prometheus/client_golang/prometheus&qu ...
- 编写一个简单的基于jmespath 的prometheus exporter
目的很简单,因为系统好多监控指标是通过json 暴露的,并不是标准的prometheus metrics 格式,处理方法 实际上很简单,我们可以基于jsonpath 解析json数据,转换为prome ...
- 使用grok exporter 做为log 与prometheus 的桥
grok 是一个工具,可以用来解析非结构化的日志文件,可以使其结构化,同时方便查询,grok 被logstash 大量依赖 同时社区也提供了一个prometheus 的exporter 可以方便的进行 ...
- prometheus的agent 二次开发代码参考
import com.codahale.metrics.MetricRegistry;import io.prometheus.client.CollectorRegistry;import io.p ...
- Prometheus Operator 架构 - 每天5分钟玩转 Docker 容器技术(178)
本节讨论 Prometheus Operator 的架构.因为 Prometheus Operator 是基于 Prometheus 的,我们需要先了解一下 Prometheus. Prometheu ...
随机推荐
- 2w字 + 40张图带你参透并发编程!
并发历史 在计算机最早期的时候,没有操作系统,执行程序只需要一种方式,那就是从头到尾依次执行.任何资源都会为这个程序服务,在计算机使用某些资源时,其他资源就会空闲,就会存在 浪费资源 的情况. 这里说 ...
- Windows server 2008R2 中sql server的搭建
一.安装sql server Step1:下载sql server 2008 r2 standard,解压到Windows的C:\下. Step2:打开安装程序,进行sql server的安装 Ste ...
- java文件的写入和读取(按行)
https://blog.csdn.net/Alexwym/article/details/81078417 https://blog.csdn.net/nickwong_/article/detai ...
- HTTP基本原理-Network各列标签的含义
第一列 Name:请求的名称,一般会将URL的最后一部分内容当作名称 第二列 Status:响应的状态码,显示为 200,则代表相应是正常的.通过状态码,我们可以判断发送了请求之后是否得到了正常的相应 ...
- python 递归删除空文件夹
Python如何递归删除空文件夹 1.Python如何递归删除空文件夹,这个问题很常见.但大多数人的解决办法都是自己实现递归函数解决这个问题,其实根本不用那么麻烦.Python中的os.walk提供了 ...
- promise和async await的区别
在项目中第一次遇到async await的这种异步写法,来搞懂它 项目场景 :点击登录按钮后执行的事件,先进行表单校验 this.$refs.loginFormRef.validate(element ...
- jmeter参数化之 【CSV Data Set Config/CSV数据配置文件】
这里以登录功能为例: 1.新建.txt文件,将参数值写入到txt文件中(多个参数值如:用户名,密码 之间以逗号隔开),将文件放置在想要放置的目录下 2.添加csv数据文件设置 右键线程组->添加 ...
- 腾讯大牛教你简单的自动化测试模型(Python+Selenium)
今天讲解简单的自动化测试模型,对于刚接触自动化测试的同学,由于没有编程语言的基础,是搞不懂代码里面的函数.封装.包以及其他概念,只是了解字符串.数组.元组及字典这种最基本的名词,更不懂自动化测试框架了 ...
- 位运算处理字符大小写转换 - 关联Leetcode 709. 转成小写字母
大写变小写.小写变大写 : 字符 ^= 32; 大写变小写.小写变小写 : 字符 |= 32; 小写变大写.大写变大写 : 字符 &= -33; 题目 实现函数 ToLowerCase(),该 ...
- Excel-Countif函数对重复值的处理之删除、统计和标记
问题场景 删除重复值: 统计重复项出现的次数: 对比两列,找出重复项. 场景一 某列员工编号user_id相当于身份证,可以唯一代表这个人,需要删除重复项. 目标 将user_id重复的人员所在行都删 ...