
Beginners Guide To Learn Dimension Reduction Techniques
Beginners Guide To Learn Dimension Reduction Techniques
Introduction
Brevity is the soul of wit
This powerful quote by William Shakespeare applies well to techniques used in data science & analytics as well. Intrigued ? Allow me to prove it using a short story.
In May ‘ 2015, we conducted a Data Hackathon ( a data science competition) in Delhi-NCR, India.

Register for Data Hackathon 3.0 – The Battle of Survival
We gave participants the challenge to identify Human Activity Recognition Using Smartphones Data Set. The data set had 561 variables for training model used for the identification of Human activity in test data set.

The participants in hackathon had varied experience and expertise level. As expected, the experts did a commendable job at identifying the human activity. However, beginners & intermediates struggled with sheer number of variables in the dataset (561 variables). Under the pressure of time, these people tried using variables really without understanding the significance level of variable(s). They lacked the skill to filter information from seemingly high dimensional problems and reduce them to a few relevant dimensions – the skill of dimension reduction.
Further, this lack of skill came across in several forms in way of questions asked by various participants:
- There are too many variables – do I need to explore each and every variable?
- Are all variables important?
- All variables are numeric and what if they have multi-collinearity? How can I identify these variables?
- I want to use decision tree. It can automatically select the right variables. Is this a right technique?
- I am using random forest but it is taking a high execution time because of high number of features
- Is there any machine learning algorithm that can identify the most significant variables automatically?
- As this is a classification problem, can I use SVM with all variables?
- Which is the best tool to deal with high number of variable, R or Python?
If you have faced similar questions, you are reading the right article. In this article, we will look at various methods to identify the significant variables using the most common dimension reduction techniques and methods.
Table of Contents
- Why Dimension Reduction is Important in machine learning and predictive modeling?
- What are Dimension Reduction techniques?
- What are the benefits of using Dimension Reduction techniques?
- What are the common methods to reduce number of Dimensions?
- Is Dimensionality Reduction good or bad?
Why Dimension Reduction is important in machine learning & predictive modeling?
The problem of unwanted increase in dimension is closely related to fixation of measuring / recording data at a far granular level then it was done in past. This is no way suggesting that this is a recent problem. It has started gaining more importance lately due to surge in data.
Lately, there has been a tremendous increase in the way sensors are being used in the industry. These sensors continuously record data and store it for analysis at a later point. In the way data gets captured, there can be a lot of redundancy. For example, let us take case of a motorbike rider in racing competitions. Today, his position and movement gets measured by GPS sensor on bike, gyro meters, multiple video feeds and his smart watch. Because of respective errors in recording, the data would not be exactly same. However, there is very little incremental information on position gained from putting these additional sources. Now assume that an analyst sits with all this data to analyze the racing strategy of the biker – he/ she would have a lot of variables / dimensions which are similar and of little (or no) incremental value. This is the problem of high unwanted dimensions and needs a treatment of dimension reduction.
Let’s look at other examples of new ways of data collection:
- Casinos are capturing data using cameras and tracking each and every move of their customers.
- Political parties are capturing data by expanding their reach on field
- Your smart phone apps collects a lot of personal details about you
- Your set top box collects data about which programs preferences and timings
- Organizations are evaluating their brand value by social media engagements (comments, likes), followers, positive and negative sentiments
With more variables, comes more trouble! And to avoid this trouble, dimension reduction techniques comes to the rescue.

What are Dimension Reduction techniques?
Dimension Reduction refers to the process of converting a set of data having vast dimensions into data with lesser dimensions ensuring that it conveys similar information concisely. These techniques are typically used while solving machine learning problems to obtain better features for a classification or regression task.
Let’s look at the image shown below. It shows 2 dimensions x1 and x2, which are let us say measurements of several object in cm (x1) and inches (x2). Now, if you were to use both these dimensions in machine learning, they will convey similar information and introduce a lot of noise in system, so you are better of just using one dimension. Here we have converted the dimension of data from 2D (from x1 and x2) to 1D (z1), which has made the data relatively easier to explain.
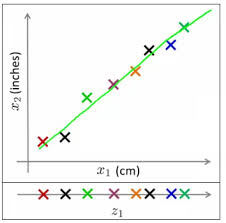
In similar ways, we can reduce n dimensions of data set to k dimensions (k < n) . These k dimensions can be directly identified (filtered) or can be a combination of dimensions (weighted averages of dimensions) or new dimension(s) that represent existing multiple dimensions well.
One of the most common application of this technique is Image processing. You might have come across this Facebook application – “Which Celebrity Do You Look Like?“. But, have you ever thought about the algorithm used behind this?
Here’s the answer: To identify the matched celebrity image, we use pixel data and each pixel is equivalent to one dimension. In every image, there are high number of pixels i.e. high number of dimensions. And every dimension is important here. You can’t omit dimensions randomly to make better sense of your overall data set. In such cases, dimension reduction techniques help you to find the significant dimension(s) using various method(s). We’ll discuss these methods shortly.
What are the benefits of Dimension Reduction?
Let’s look at the benefits of applying Dimension Reduction process:
- It helps in data compressing and reducing the storage space required
- It fastens the time required for performing same computations. Less dimensions leads to less computing, also less dimensions can allow usage of algorithms unfit for a large number of dimensions
- It takes care of multi-collinearity that improves the model performance. It removes redundant features. For example: there is no point in storing a value in two different units (meters and inches).
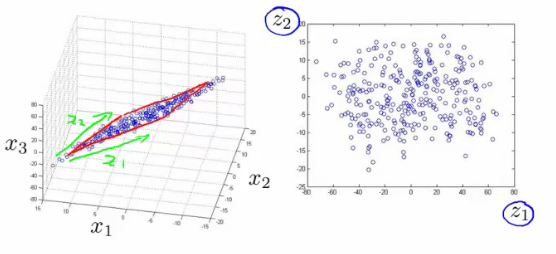
- Reducing the dimensions of data to 2D or 3D may allow us to plot and visualize it precisely. You can then observe patterns more clearly. Below you can see that, how a 3D data is converted into 2D. First it has identified the 2D plane then represented the points on these two new axis z1 and z2.
- It is helpful in noise removal also and as result of that we can improve the performance of models.
What are the common methods to perform Dimension Reduction?
There are many methods to perform Dimension reduction. I have listed the most common methods below:
1. Missing Values: While exploring data, if we encounter missing values, what we do? Our first step should be to identify the reason then impute missing values/ drop variables using appropriate methods. But, what if we have too many missing values? Should we impute missing values or drop the variables?
I would prefer the latter, because it would not have lot more details about data set. Also, it would not help in improving the power of model. Next question, is there any threshold of missing values for dropping a variable? It varies from case to case. If the information contained in the variable is not that much, you can drop the variable if it has more than ~40-50% missing values.
2. Low Variance: Let’s think of a scenario where we have a constant variable (all observations have same value, 5) in our data set. Do you think, it can improve the power of model? Ofcourse NOT, because it has zero variance. In case of high number of dimensions, we should drop variables having low variance compared to others because these variables will not explain the variation in target variables.
3. Decision Trees: It is one of my favorite techniques. It can be used as a ultimate solution to tackle multiple challenges like missing values, outliers and identifying significant variables. It worked well in our Data Hackathon also. Several data scientists used decision tree and it worked well for them.
4. Random Forest: Similar to decision tree is Random Forest. I would also recommend using the in-built feature importance provided by random forests to select a smaller subset of input features. Just be careful that random forests have a tendency to bias towards variables that have more no. of distinct values i.e. favor numeric variables over binary/categorical values.
5. High Correlation: Dimensions exhibiting higher correlation can lower down the performance of model. Moreover, it is not good to have multiple variables of similar information or variation also known as “Multicollinearity”. You can use Pearson (continuous variables) or Polychoric (discrete variables) correlation matrix to identify the variables with high correlation and select one of them using VIF (Variance Inflation Factor). Variables having higher value ( VIF > 5 ) can be dropped.
6. Backward Feature Elimination: In this method, we start with all n dimensions. Compute the sum of square of error (SSR) after eliminating each variable (n times). Then, identifying variables whose removal has produced the smallest increase in the SSR and removing it finally, leaving us with n-1 input features.
Repeat this process until no other variables can be dropped. Recently in Online Hackathon organised by Analytics Vidhya (11-12 Jun’15), Data scientist who held second position used Backward Feature Elimination in linear regression to train his model.
Reverse to this, we can use “Forward Feature Selection” method. In this method, we select one variable and analyse the performance of model by adding another variable. Here, selection of variable is based on higher improvement in model performance.
7. Factor Analysis: Let’s say some variables are highly correlated. These variables can be grouped by their correlations i.e. all variables in a particular group can be highly correlated among themselves but have low correlation with variables of other group(s). Here each group represents a single underlying construct or factor. These factors are small in number as compared to large number of dimensions. However, these factors are difficult to observe. There are basically two methods of performing factor analysis:
- EFA (Exploratory Factor Analysis)
- CFA (Confirmatory Factor Analysis)
8. Principal Component Analysis (PCA): In this technique, variables are transformed into a new set of variables, which are linear combination of original variables. These new set of variables are known as principle components. They are obtained in such a way that first principle component accounts for most of the possible variation of original data after which each succeeding component has the highest possible variance.
The second principal component must be orthogonal to the first principal component. In other words, it does its best to capture the variance in the data that is not captured by the first principal component. For two-dimensional dataset, there can be only two principal components. Below is a snapshot of the data and its first and second principal components. You can notice that second principle component is orthogonal to first principle component.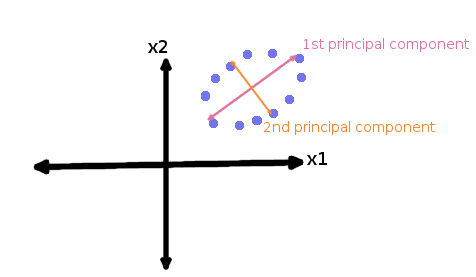 The principal components are sensitive to the scale of measurement, now to fix this issue we should always standardize variables before applying PCA. Applying PCA to your data set loses its meaning. If interpretability of the results is important for your analysis, PCA is not the right technique for your project.
Is Dimension Reduction Good or Bad?
Recently, we received this question on our data science forum. Here’s the complete answer.
End Note
In this article, we looked at the simplified version of Dimension Reduction covering its importance, benefits, the commonly methods and the discretion as to when to choose a particular technique. In future post, I would write about the PCA and Factor analysis in more detail.
Did you find the article useful? Do let us know your thoughts about this article in the comment box below. I would also want to know which dimension reduction technique you use most and why?
If you like what you just read & want to continue your analytics learning, subscribe to our emails, follow us on twitter or like our facebook page.
Beginners Guide To Learn Dimension Reduction Techniques的更多相关文章
- SystemTap Beginners Guide
SystemTap 3.0 SystemTap Beginners Guide Introduction to SystemTap Edition 3.0 Red Hat, Inc. Don Do ...
- 机器学习,数据挖掘,统计学,云计算,众包(crowdsourcing),人工智能,降维(Dimension reduction)
机器学习 Machine Learning:提供数据分析的能力,机器学习是大数据时代必不可少的核心技术,道理很简单:收集.存储.传输.管理大数据的目的,是为了“利用”大数据,而如果没有机器学习技术分析 ...
- 无监督学习:Linear Dimension Reduction(线性降维)
一 Unsupervised Learning 把Unsupervised Learning分为两大类: 化繁为简:有很多种input,进行抽象化处理,只有input没有output 无中生有:随机给 ...
- Cache memory power reduction techniques
Methods and apparatus to provide for power consumption reduction in memories (such as cache memories ...
- PP: UMAP: uniform manifold approximation and projection for dimension reduction
From Tutte institute for mathematics and computing Problem: dimension reduction Theoretical foundati ...
- Dimension reduction
materials: 1. Dimension Reduction - IsoMap
- 14-1-Unsupervised Learning ---dimension reduction
无监督学习(Unsupervised Learning)可以分为两种: 化繁为简 聚类(Clustering) 降维(Dimension Reduction) 无中生有(Generation) 所谓的 ...
- Dimension reduction in principal component analysis for trees
目录 问题 重要的定义 距离 支撑树 交树 序 tree-line path 重要的性质 其它 Alfaro C A, Aydin B, Valencia C E, et al. Dimension ...
- Portrait Photography Beginners Guide
Please visit photoandtips稻糠亩 for more information. 六级/考研单词: vogue, derive, gorgeous, thereby, strict ...
随机推荐
- B-树
定义: B-树是一种平衡的多路查找树,在文件系统中有所应用.主要用作文件的索引. 特性:(M为层数) 1.定义任意非叶子结点最多只有M个儿子:且M>2: 2.根结点的儿子数为[2, M]: 3. ...
- delphi XE7 中的消息
在delphi XE7的程序开发中,消息机制保证进程间的通信. 在程序中,消息来自: 1)系统: 通知你的程序用户输入,涂画以及其他的系统范围的事件: 2)你的程序:不同的程序部分之间的通信信息. ...
- 在一般处理程序中,把Form Post过来的表单集合转换成对象 ,仿 MVC post,反射原理
using System; using System.Collections.Generic; using System.Collections.Specialized; using System.L ...
- 第一节:CLR寄宿
本系列文章来自 CLR VIA C# .NET FrameWork在Microsoft Windows平台的顶部运行.这意味着.NET必须用Windows可以理解的技术来构建.首先,所有的托管模块和 ...
- java clone简单学习
最近在帮忙写单侧的时候,经常会和这几个对象类打交道,因为对java也不是很熟悉,刚好学习一下,都是很浅的学习,并没有深入的去学习哈,因为感觉也用不上. protected Object clone() ...
- JQuery识别键盘操作 & 键盘快捷键
前几天写的那个项目登陆页是直接点击but登陆的,后来做完了之后不断的测试的时候就发现蛋疼之处了 每次在键盘上输入一长串密码之后,还得抬起手拿鼠标点一下确认登陆 直接就搜了一下,看了一下书 = = 其实 ...
- 从数组->ArrayList->List 为了方便与安全在不断变化着
在C#中,当我们想要存储一组对象的时候,就会想到用数组,ArrayList,List这三个对象了. 数组 优点优点之一:数组在内存中是连续存储的,所以它的索引速度是非常的快,而且赋值与修改元素也很简单 ...
- linux安装R语言
系统:centos 6.4 64bit 安装可以使用rpm包安装,也可以用源码安装. 但是rpm安装,各种依赖比较麻烦.所以我采用源码安装. 下载:http://www.r-project.org/ ...
- git的初步使用
1.在GitHub上建立项目登录GitHub后,你可以在右边靠中那里找到一个按钮“New Repository”,点击过后,填入项目名称.说明和网址过后就可以创建了,然后会出现一个提示页面,记下类似g ...
- [转]分布式文件系统FastDFS架构剖析
[转]分布式文件系统FastDFS架构剖析 http://www.programmer.com.cn/4380/ 文/余庆 FastDFS是一款类Google FS的开源分布式文件系统,它用纯C语言实 ...