Azure经典虚拟机(Windows)如何监测单个磁盘的使用空间
Azure云平台创建经典虚拟机(Windows)后,发现仪表板的监测项下默认是没有针对磁盘空间进行检测的指标的
本地机器安装Windows Azure Powershell模块,并通过如下命令登陆并查看到默认的诊断扩展是没有Disk Free Space参数的
Add-AzureAccount -Environment AzureChinaCloud

$vm = Get-AzureVM -ServiceName hlmcloudsn1-*** -Name hlmwin12n1-***

$PublicConfiguration = (Get-AzureVMDiagnosticsExtension -VM $vm).PublicConfiguration

$encodedconfig = (ConvertFrom-Json -InputObject $PublicConfiguration).xmlCfg

$xmlconfig = [System.Text.Encoding]::UTF8.GetString([System.Convert]::FromBase64String($encodedconfig))

Write-Host $xmlconfig
参考Azure官网(https://docs.microsoft.com/zh-cn/azure/virtual-machines/extensions/diagnostics-windows#sample-diagnostics-configuration)说明,了解到可以对诊断扩展的参数进行自定义,因此在原有的配置文件中加入针对单块盘的指控指标即可对单块磁盘的使用量进行检测,编辑后的配置文件见下(标黄内容为新添加的内容,需要根据实际环境进行替换)
<?xml version="1.0" encoding="utf-8"?>

<PublicConfig xmlns="http://schemas.microsoft.com/ServiceHosting/2010/10/DiagnosticsConfiguration">

    <WadCfg>

      <DiagnosticMonitorConfiguration overallQuotaInMB="">

        <DiagnosticInfrastructureLogs scheduledTransferLogLevelFilter="Error"/>

        <PerformanceCounters scheduledTransferPeriod="PT1M">

      <PerformanceCounterConfiguration counterSpecifier="\Processor(_Total)\% Processor Time" sampleRate="PT15S" unit="Percent">

        <annotation displayName="CPU utilization" locale="en-us"/>

      </PerformanceCounterConfiguration>

      <PerformanceCounterConfiguration counterSpecifier="\Processor(_Total)\% Privileged Time" sampleRate="PT15S" unit="Percent">

        <annotation displayName="CPU privileged time" locale="en-us"/>

      </PerformanceCounterConfiguration>

      <PerformanceCounterConfiguration counterSpecifier="\Processor(_Total)\% User Time" sampleRate="PT15S" unit="Percent">

        <annotation displayName="CPU user time" locale="en-us"/>

      </PerformanceCounterConfiguration>

      <PerformanceCounterConfiguration counterSpecifier="\Processor Information(_Total)\Processor Frequency" sampleRate="PT15S" unit="Count">

        <annotation displayName="CPU frequency" locale="en-us"/>

      </PerformanceCounterConfiguration>

      <PerformanceCounterConfiguration counterSpecifier="\System\Processes" sampleRate="PT15S" unit="Count">

        <annotation displayName="Processes" locale="en-us"/>

      </PerformanceCounterConfiguration>

      <PerformanceCounterConfiguration counterSpecifier="\Process(_Total)\Thread Count" sampleRate="PT15S" unit="Count">

        <annotation displayName="Threads" locale="en-us"/>

      </PerformanceCounterConfiguration>

      <PerformanceCounterConfiguration counterSpecifier="\Process(_Total)\Handle Count" sampleRate="PT15S" unit="Count">

        <annotation displayName="Handles" locale="en-us"/>

      </PerformanceCounterConfiguration>

      <PerformanceCounterConfiguration counterSpecifier="\Memory\% Committed Bytes In Use" sampleRate="PT15S" unit="Percent">

        <annotation displayName="Memory usage" locale="en-us"/>

      </PerformanceCounterConfiguration>

      <PerformanceCounterConfiguration counterSpecifier="\Memory\Available Bytes" sampleRate="PT15S" unit="Bytes">

        <annotation displayName="Memory available" locale="en-us"/>

      </PerformanceCounterConfiguration>

      <PerformanceCounterConfiguration counterSpecifier="\Memory\Committed Bytes" sampleRate="PT15S" unit="Bytes">

        <annotation displayName="Memory committed" locale="en-us"/>

      </PerformanceCounterConfiguration>

      <PerformanceCounterConfiguration counterSpecifier="\Memory\Commit Limit" sampleRate="PT15S" unit="Bytes">

        <annotation displayName="Memory commit limit" locale="en-us"/>

      </PerformanceCounterConfiguration>

      <PerformanceCounterConfiguration counterSpecifier="\Memory\Pool Paged Bytes" sampleRate="PT15S" unit="Bytes">

        <annotation displayName="Memory paged pool" locale="en-us"/>

      </PerformanceCounterConfiguration>

      <PerformanceCounterConfiguration counterSpecifier="\Memory\Pool Nonpaged Bytes" sampleRate="PT15S" unit="Bytes">

        <annotation displayName="Memory non-paged pool" locale="en-us"/>

      </PerformanceCounterConfiguration>

      <PerformanceCounterConfiguration counterSpecifier="\PhysicalDisk(_Total)\% Disk Time" sampleRate="PT15S" unit="Percent">

        <annotation displayName="Disk active time" locale="en-us"/>

      </PerformanceCounterConfiguration>

      <PerformanceCounterConfiguration counterSpecifier="\PhysicalDisk(_Total)\% Disk Read Time" sampleRate="PT15S" unit="Percent">

        <annotation displayName="Disk active read time" locale="en-us"/>

      </PerformanceCounterConfiguration>

      <PerformanceCounterConfiguration counterSpecifier="\PhysicalDisk(_Total)\% Disk Write Time" sampleRate="PT15S" unit="Percent">

        <annotation displayName="Disk active write time" locale="en-us"/>

      </PerformanceCounterConfiguration>

      <PerformanceCounterConfiguration counterSpecifier="\PhysicalDisk(_Total)\Disk Transfers/sec" sampleRate="PT15S" unit="CountPerSecond">

        <annotation displayName="Disk operations" locale="en-us"/>

      </PerformanceCounterConfiguration>

      <PerformanceCounterConfiguration counterSpecifier="\PhysicalDisk(_Total)\Disk Reads/sec" sampleRate="PT15S" unit="CountPerSecond">

        <annotation displayName="Disk read operations" locale="en-us"/>

      </PerformanceCounterConfiguration>

      <PerformanceCounterConfiguration counterSpecifier="\PhysicalDisk(_Total)\Disk Writes/sec" sampleRate="PT15S" unit="CountPerSecond">

        <annotation displayName="Disk write operations" locale="en-us"/>

      </PerformanceCounterConfiguration>

      <PerformanceCounterConfiguration counterSpecifier="\PhysicalDisk(_Total)\Disk Bytes/sec" sampleRate="PT15S" unit="BytesPerSecond">

        <annotation displayName="Disk speed" locale="en-us"/>

      </PerformanceCounterConfiguration>

      <PerformanceCounterConfiguration counterSpecifier="\PhysicalDisk(_Total)\Disk Read Bytes/sec" sampleRate="PT15S" unit="BytesPerSecond">

        <annotation displayName="Disk read speed" locale="en-us"/>

      </PerformanceCounterConfiguration>

      <PerformanceCounterConfiguration counterSpecifier="\PhysicalDisk(_Total)\Disk Write Bytes/sec" sampleRate="PT15S" unit="BytesPerSecond">

        <annotation displayName="Disk write speed" locale="en-us"/>

      </PerformanceCounterConfiguration>

      <PerformanceCounterConfiguration counterSpecifier="\PhysicalDisk(_Total)\Avg. Disk Queue Length" sampleRate="PT15S" unit="Count">

        <annotation displayName="Disk average queue length" locale="en-us"/>

      </PerformanceCounterConfiguration>

      <PerformanceCounterConfiguration counterSpecifier="\PhysicalDisk(_Total)\Avg. Disk Read Queue Length" sampleRate="PT15S" unit="Count">

        <annotation displayName="Disk average read queue length" locale="en-us"/>

      </PerformanceCounterConfiguration>

      <PerformanceCounterConfiguration counterSpecifier="\PhysicalDisk(_Total)\Avg. Disk Write Queue Length" sampleRate="PT15S" unit="Count">

        <annotation displayName="Disk average write queue length" locale="en-us"/>

      </PerformanceCounterConfiguration>

      <PerformanceCounterConfiguration counterSpecifier="\LogicalDisk(_Total)\% Free Space" sampleRate="PT15S" unit="Percent">

        <annotation displayName="Disk free space (percentage)" locale="en-us"/>

      </PerformanceCounterConfiguration>

      <PerformanceCounterConfiguration counterSpecifier="\LogicalDisk(_Total)\Free Megabytes" sampleRate="PT15S" unit="Count">

        <annotation displayName="Disk free space (MB)" locale="en-us"/>

      </PerformanceCounterConfiguration>

      <PerformanceCounterConfiguration counterSpecifier="\LogicalDisk(C:)\Free Megabytes" sampleRate="PT15S" unit="Count">

        <annotation displayName="C: free space (MB)" locale="en-us"/>

      </PerformanceCounterConfiguration>

      <PerformanceCounterConfiguration counterSpecifier="\LogicalDisk(D:)\Free Megabytes" sampleRate="PT15S" unit="Count">

        <annotation displayName="D: free space (MB)" locale="en-us"/>

      </PerformanceCounterConfiguration>

      <PerformanceCounterConfiguration counterSpecifier="\LogicalDisk(F:)\Free Megabytes" sampleRate="PT15S" unit="Count">

        <annotation displayName="F: free space (MB)" locale="en-us"/>

      </PerformanceCounterConfiguration>

    </PerformanceCounters>

    <Metrics resourceId="/subscriptions/0b4b20c5-29b3-4dd9-bfdc-40b75f1dc4c9/resourceGroups/hlmrgn1/providers/Microsoft.ClassicCompute/virtualMachines/hlmwin12n1-cla1" >

        <MetricAggregation scheduledTransferPeriod="PT1H"/>

        <MetricAggregation scheduledTransferPeriod="PT1M"/>

    </Metrics>

    <WindowsEventLog scheduledTransferPeriod="PT1M">

      <DataSource name="Application!*[System[(Level = 1 or Level = 2)]]"/>

      <DataSource name="Security!*[System[(Level = 1 or Level = 2)]"/>

      <DataSource name="System!*[System[(Level = 1 or Level = 2)]]"/>

    </WindowsEventLog>

      </DiagnosticMonitorConfiguration>

    </WadCfg>

    <StorageAccount>hlmston1t2cla</StorageAccount>

</PublicConfig>
使用如下命令,跟新诊断扩展(将如上文件保存为DiagnosticsPubConfig.xml文件)
$vm = Get-AzureVM -ServiceName hlmcloudsn1-*** -Name hlmwin12n1-***$Config_Path = "C:\Users\he.liming\Desktop\DiagnosticsPubConfig.xml"

$Storage_Context = New-AzureStorageContext -StorageAccountName "hlmston1t2***" -StorageAccountKey "qlIs3Oc9vPqpkCQsf9Lk6oqKfbHbrPUNz3xNqm9VgcUPug8U7XfX***"

$vm_Update = Set-AzureVMDiagnosticsExtension -DiagnosticsConfigurationPath $Config_Path -VM $vm -StorageContext $Storage_Context

Update-AzureVM -ServiceName hlmcloudsn1-*** -Name hlmwin12n1-*** -VM $vm_Update.VM

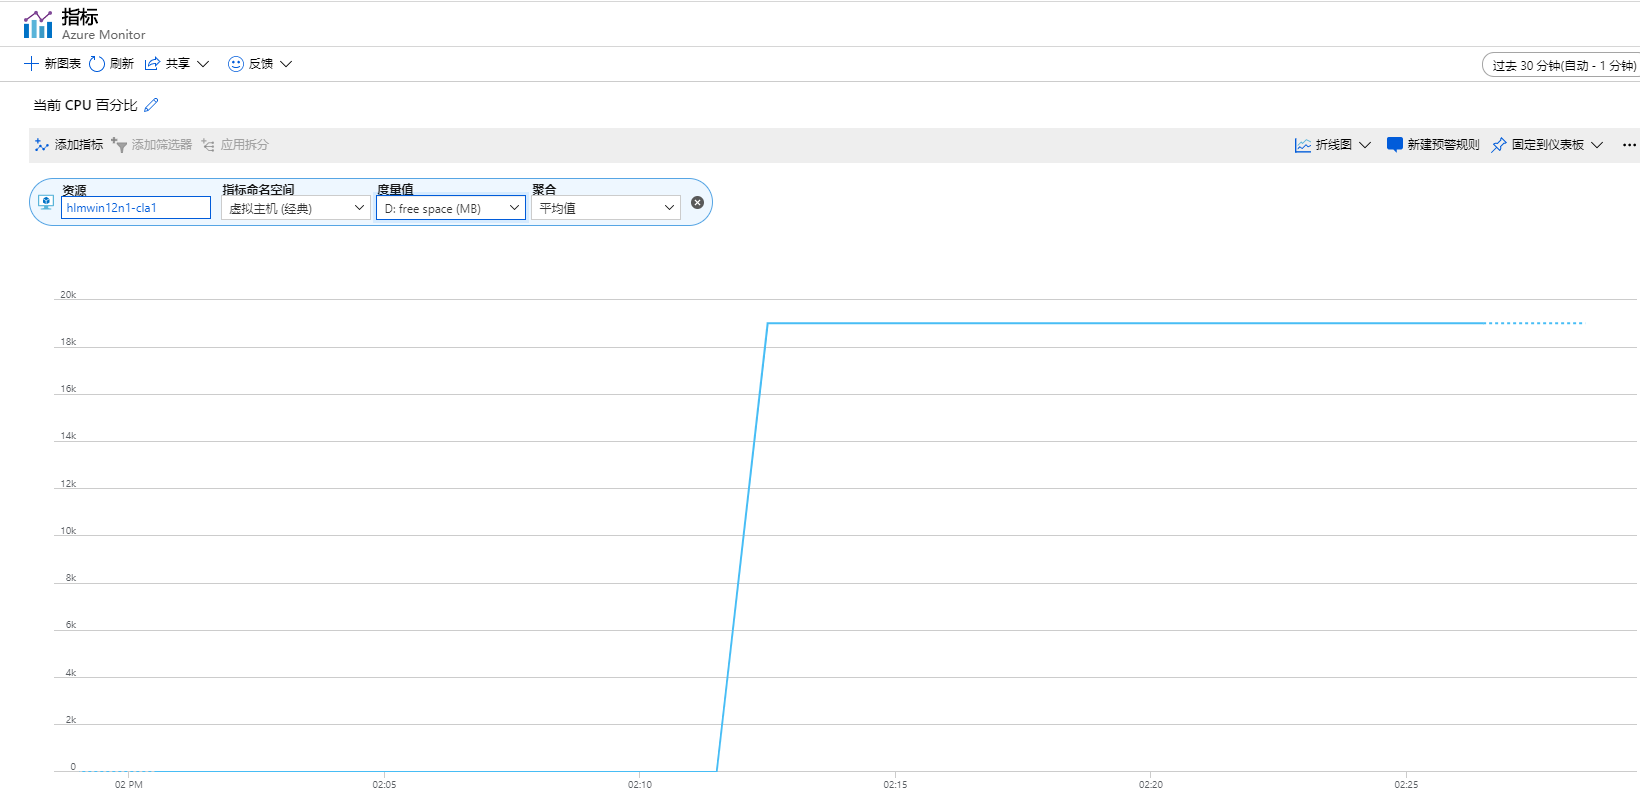
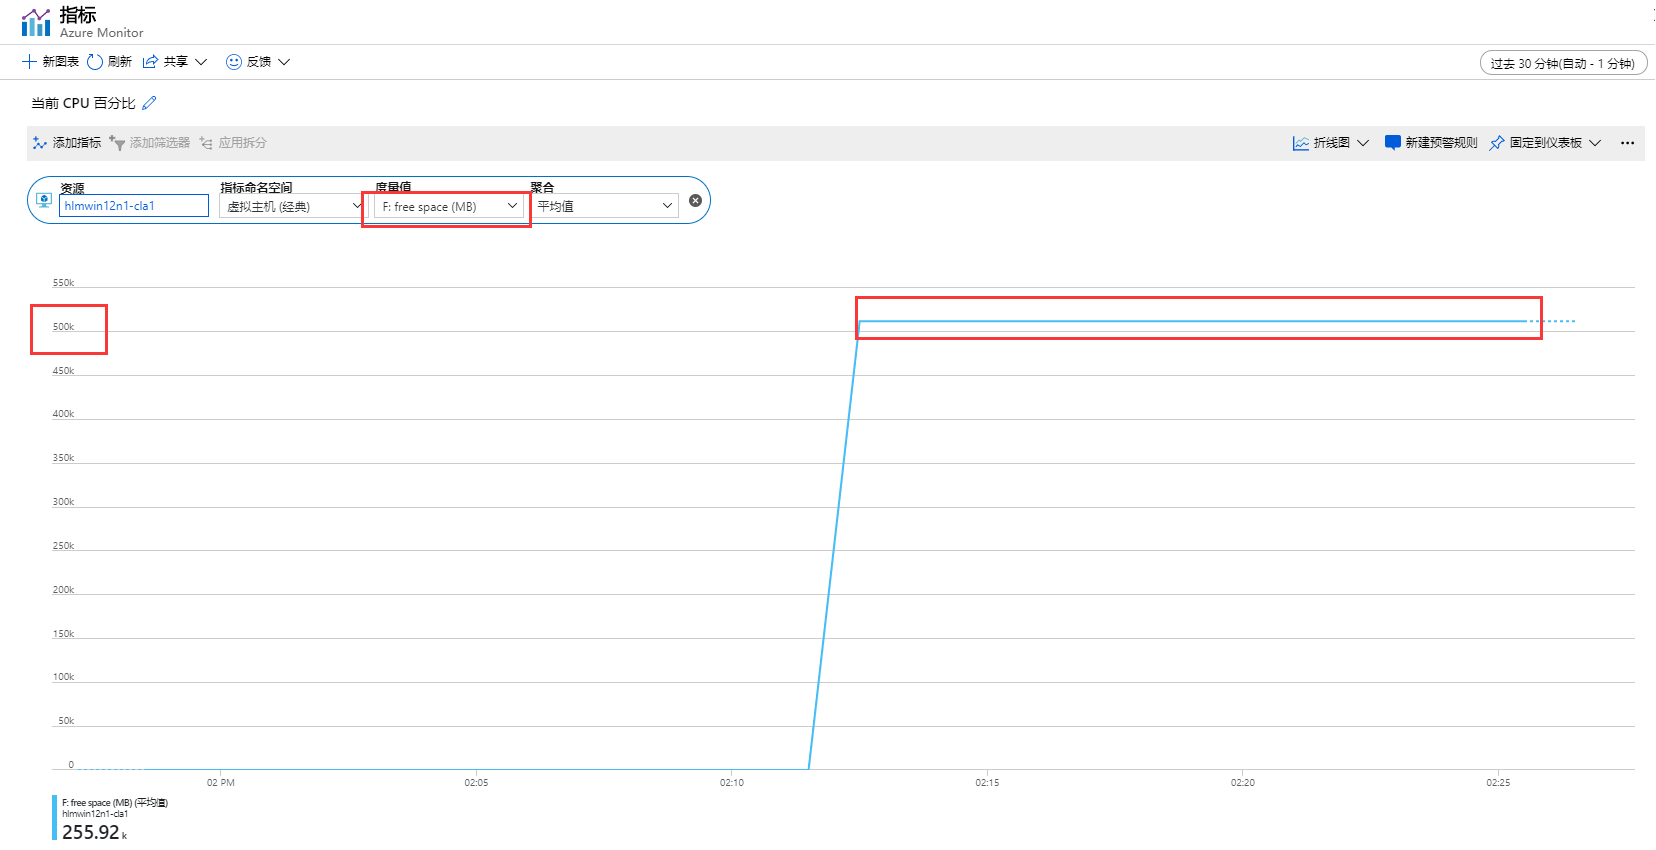
查看虚拟机的仪表板,发现已经可以查看自定义的盘符分区大小了


Azure经典虚拟机(Windows)如何监测单个磁盘的使用空间的更多相关文章
- 排查在 Azure 中新建 Windows 虚拟机时遇到的经典部署问题
尝试创建新的 Azure 虚拟机 (VM) 时,遇到的常见错误是预配失败或分配失败. 当由于准备步骤不当,或者在从门户捕获映像期间选择了错误的设置而导致 OS 映像无法加载时,将发生预配失败. 当群集 ...
- Azure 中的 Windows 虚拟机概述
Azure 虚拟机 (VM) 是 Azure 提供的多种可缩放按需分配计算资源之一. 通常情况下,如果需要以更大的力度(相对于其他控制选项)控制计算环境,则应选择 VM. 本文介绍创建 VM 之前的注 ...
- Windows Azure Virtual Machine (25) 使用SSH登录Azure Linux虚拟机
<Windows Azure Platform 系列文章目录> 本文介绍内容适合于Azure Global和Azure China 为什么使用SSH登录Azure Linux虚拟机? 我们 ...
- 通过xrdp实现远程桌面连接Windows Azure linux虚拟机
本文以Oracle Linux 6.4虚拟机为示例(22及3389端口必须打开,分别用于SSH及RDP连接) 1.在安装xrdp之前,首先需要安装一些必要的包,如: # yum -y install ...
- 【初码干货】【Azure系列】1、再次感受Azure,体验Windows Server 2016并部署BlogEngine.NET
上个月末,在某人的建议下,重新注册了一个1元试用账户(包含1个月期限的1500元订阅),并充值了1000元转为了正式账户,相当于1000元得到了2500的订阅,于是又一次开启了Azure之旅. 在这不 ...
- 超大文件上传到Azure Linux虚拟机最佳实践
客户在实际进行迁移的时候,往往碰到需要将本地数据中心的超大文件,比如单个200GB的文件,或者总共1TB的无数文件上传到Azure上的情况,尤其是传到Azure的Linux虚拟机的场景,这种场景包括: ...
- Azure 中虚拟机的区域和可用性
Azure 在中国的两个数据中心运行. 这些数据中心分组到地理区域,让用户可灵活选择构建应用程序的位置. 请务必了解 Azure 中虚拟机 (VM) 运行的方式和位置,以及最大化性能.可用性和冗余的选 ...
- 从Azure上构建Windows应用程序映像
从Azure上构建windows应用程序映像同构建Linux应用程序映像总体流程比较类似,可以参考上图Linux映像的制作发布等流程,具体细节又有所差别. 具体步骤如下: 从Azure管理平台上申请W ...
- Azure经典门户创建VM,如何设置使用静态IP地址?
使用 Azure 经典管理门户中创建的虚拟机,无法使用静态IP 地址,在管理界面没有该设置.在新的管理门户中虽然有使用静态IP的设置,但是选项是灰色,无法修改,提示错误:This virtual ma ...
随机推荐
- qml 3d 纪念那些曾经爬过的坑
1.使用多position画图时,图形不受控制的问题? 在变量属性设置时Attribute中的attributeBaseType 数据类型一定要和 Buffer中data 数据类型一定要相同. 例如 ...
- springBoot学习(一):初学Thymeleaf
这一部分的代码是基于大神的代码,只是原本的代码是有错的,只自己记录一下自己更改之后的代码和自己的理解. 使用Spring Initzal创建项目,最后代码结构如下,我对Spring及其相关之事还是全然 ...
- 前端武器库之DOM练习
1.模态对话框 <!DOCTYPE html> <html lang="en"> <head> <meta charset="U ...
- css3 perspective与translateZ变换
css3中的坐标系,rotateX就是绕着x轴旋转,rotateY就是绕着Y轴旋转,rotateZ就是绕着z轴旋转(也就是xy平面的旋转). perspective属性用来设置视点,在css3的模型中 ...
- vue的ui组件库
https://www.cnblogs.com/dupd/p/7735450.html
- Oracle虚拟机 与 windows配置
目录 相关资料 安装虚拟机及相关配置 安装PLSQL Developer Navicat Premium登录数据库 踩坑之路 相关资料 oracle虚拟机配置 提取码:s3sg 安装虚拟机及相关配置 ...
- arcgis python 布局中所有元素信息报告
# Author: ESRI # Date: July 5, 2010 # Version: ArcGIS 10.0 # Purpose: This script generates a report ...
- 用了pm2之后,如何让console.log('..')出现在控制台
使用 pm2 log 0 可以查看.当然这个 0 应该是应用的 id
- 自定义ObjectAnimator属性实现
package com.loaderman.customviewdemo; import android.animation.ObjectAnimator; import android.graphi ...
- 23 Flutter官方推荐的状态管理库provider的使用
加群452892873 下载对应21可文件,运行方法,建好项目,直接替换lib目录,在往pubspec.yaml添加上一下扩展. cupertino_icons: ^ flutter_swiper: ...