matplotlib画图总结--多子图布局
1、subplot布局
subplot(nrows, ncols, index, **kwargs)
subplot(pos, **kwargs)
subplot(ax)
x=[1,2,3]

values = [10, 15, 25]

p1=plt.subplot(221)

plt.bar(x, values)

p1.set_ylabel('yy')

p1.set_title('p1')

plt.subplot(222)

plt.scatter(x, values)

plt.subplot(223)

plt.plot(x, values)

plt.suptitle('subplot')

plt.show()
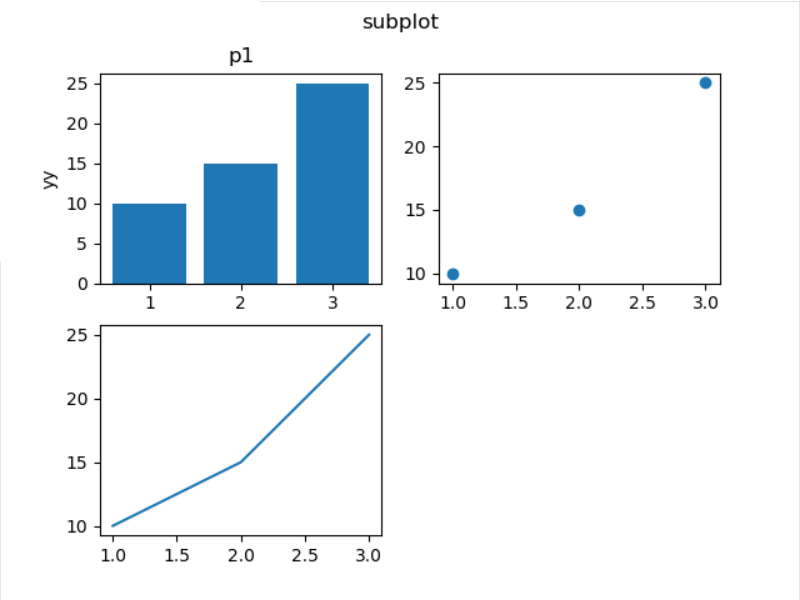
上面的图第三张只占半个图纸长度,不美观。那么使用subplot怎么画非对阵图呢?重新定义子图的分布行列即可。
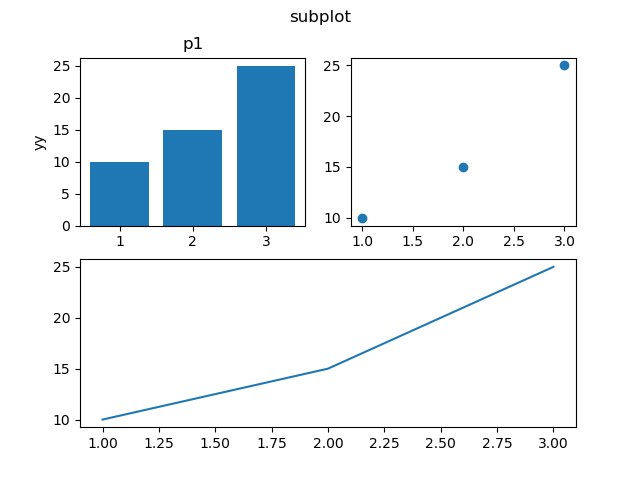
plt.subplot(212) 或plt.subplot(2,1,2)把图纸分为2行1列,当前子图是第二个。
x=[1,2,3]

values = [10, 15, 25]

p1=plt.subplot(221)

plt.bar(x, values)

p1.set_ylabel('yy')

p1.set_title('p1')

plt.subplot(222)

plt.scatter(x, values)

plt.subplot(212)

plt.plot(x, values)

plt.suptitle('subplot')

plt.show()
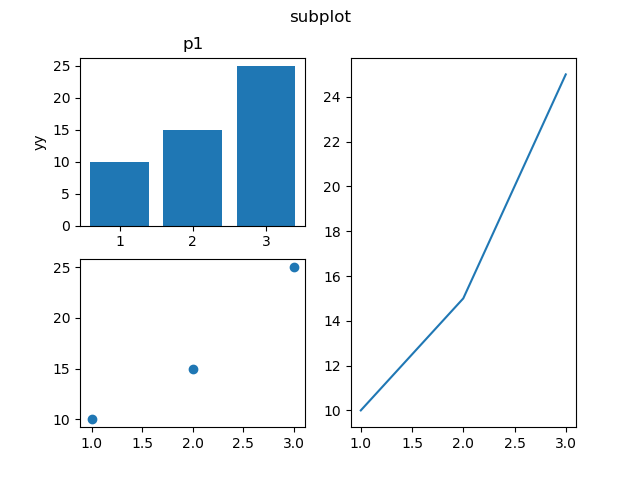
先把图纸分为2行2列,先画图1和图3,然后再把图纸划分为1行2列,对第二列绘图。
x=[1,2,3]

values = [10, 15, 25]

p1=plt.subplot(221)

plt.bar(x, values)

p1.set_ylabel('yy')

p1.set_title('p1')

plt.subplot(223)

plt.scatter(x, values)

plt.subplot(1,2,2)

plt.plot(x, values)

plt.suptitle('subplot')

plt.show()
2、subplots布局
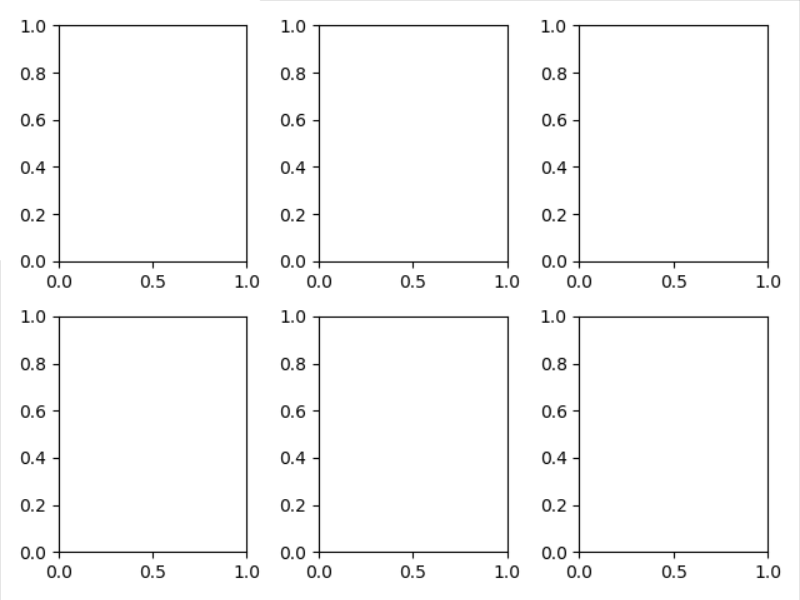
matplotlib.pyplot.subplots(nrows=1, ncols=1, sharex=False, sharey=False, squeeze=True, subplot_kw=None, gridspec_kw=None, **fig_kw) :创建一个图形和一组子图。
fig, ax = plt.subplots(2, 3)

fig.tight_layout()

ax[0].text(0.5,0.5, 'sss')

plt.show()
3、subplot2grid布局
matplotlib.pyplot.subplot2grid(shape, loc, rowspan=1, colspan=1, fig=None, **kwargs)
shape : sequence of 2 ints
loc : sequence of 2 ints
rowspan : int
Number of rows for the axis to span to the right.
colspan : int
Number of columns for the axis to span downwards.
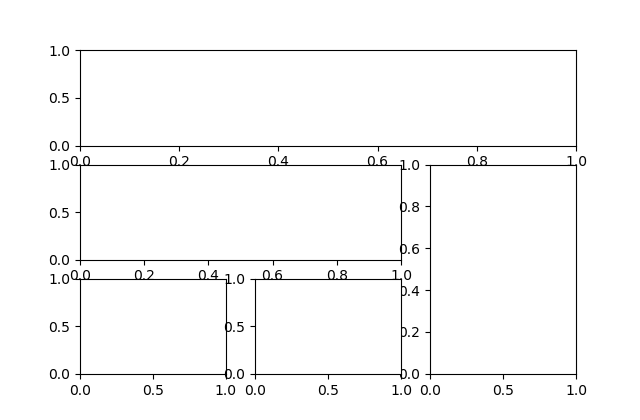
fig = plt.figure()

ax1 = plt.subplot2grid((3, 3), (0, 0), colspan=3)

ax2 = plt.subplot2grid((3, 3), (1, 0), colspan=2)

ax3 = plt.subplot2grid((3, 3), (1, 2), rowspan=2)

ax4 = plt.subplot2grid((3, 3), (2, 0))

ax5 = plt.subplot2grid((3, 3), (2, 1))

plt.show()
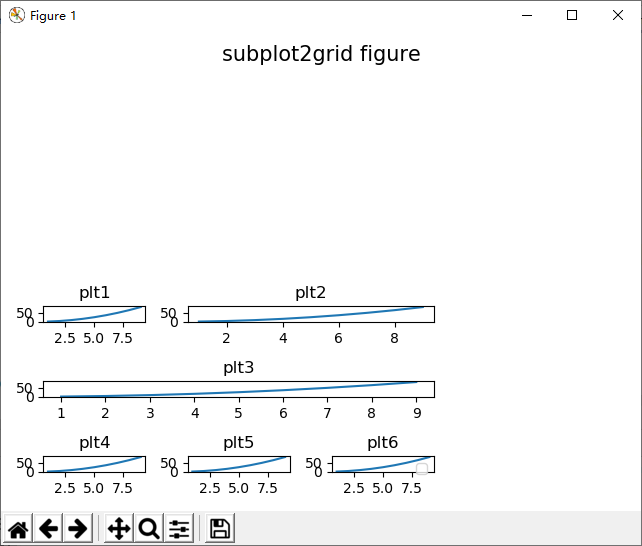
x = np.arange(1,10)

fig = plt.figure()

ax1 = plt.subplot2grid((3, 3), (0, 0), colspan=1, title = 'plt1')

ax1.plot(x,x*x)

ax2 = plt.subplot2grid((3, 3), (0, 1), colspan=2, title = 'plt2')

ax2.plot(x,x*x)

ax3 = plt.subplot2grid((3, 3), (1, 0), colspan=3, title = 'plt3')

ax3.plot(x,x*x)

ax4 = plt.subplot2grid((3, 3), (2, 0), title = 'plt4')

ax4.plot(x,x*x)

ax5 = plt.subplot2grid((3, 3), (2, 1), title = 'plt5')

ax5.plot(x,x*x)

ax6 = plt.subplot2grid((3, 3), (2, 2), title = 'plt6')

ax6.plot(x,x*x)

plt.legend()

plt.suptitle('subplot2grid figure',  x=0.5,y=0.95, ha='center', va='center', fontsize=15)

plt.show()
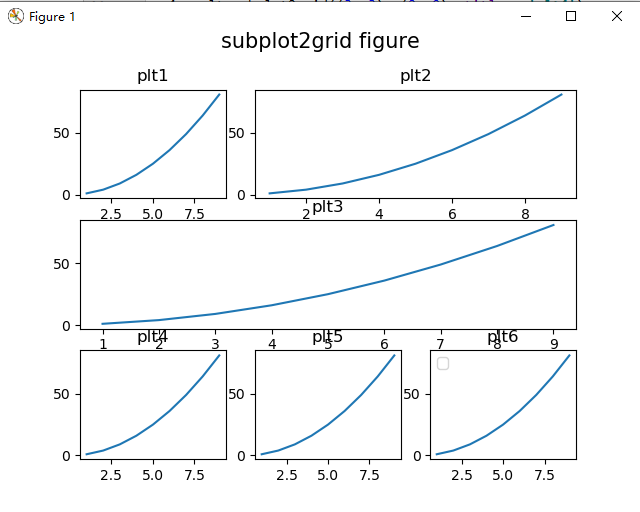
可见上面的图,x周名称和附件的图互相干涉。需要缩小图或者加大间隙。
使用layout函数plt.tight_layout()。但是图的title和第一行干涉。
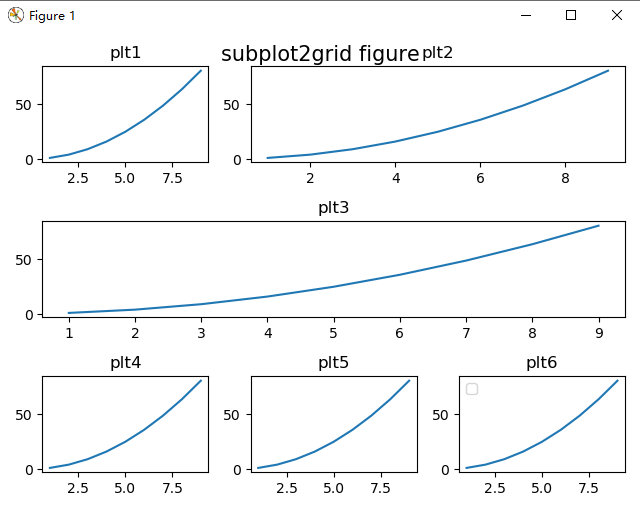
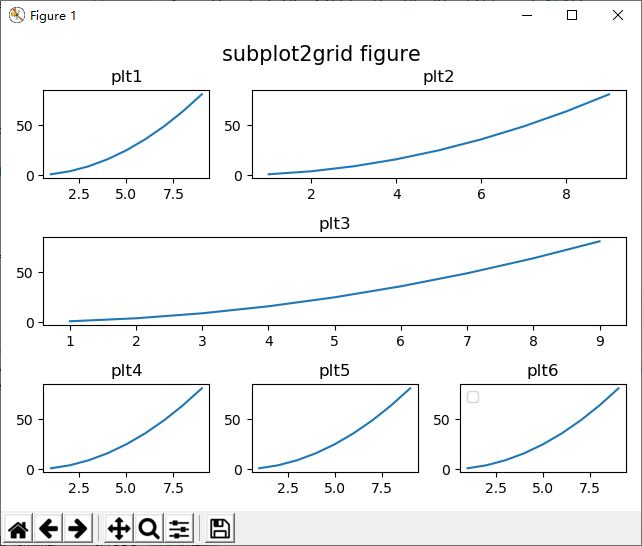
plt.tight_layout(rect=[0, 0, 1, 0.95]) 或者添加一句fig.subplots_adjust(top=0.85)即可。
matplotlib.pyplot.tight_layout(pad=1.08, h_pad=None, w_pad=None, rect=None)
其中rect可以这样定义:[left, bottom, right, top] in normalized (0, 1) figure coordinates,所以可以定义right和top,进行图的缩放。
A rectangle (left, bottom, right, top) in the normalized figure coordinate that the whole subplots area (including labels) will fit into. Default is (0, 0, 1, 1).
图的缩放,做个实验plt.tight_layout(rect=[0, 0, 0.7, 0.5])
matplotlib画图总结--多子图布局的更多相关文章
- matplotlib 画图
matplotlib 画图 1. 画曲线图 Tompson = np.array([0, 0, 0, 0, 0.011, 0.051, 0.15, 0.251, 0.35, 0.44, 0 ...
- matplotlib画图实例:pyplot、pylab模块及作图參数
http://blog.csdn.net/pipisorry/article/details/40005163 Matplotlib.pyplot画图实例 {使用pyplot模块} matplotli ...
- matplotlib画图报错This figure includes Axes that are not compatible with tight_layout, so results might be incorrect.
之前用以下代码将实验结果用matplotlib show出来 plt.plot(np.arange(len(aver_reward_list)), aver_reward_list) plt.ylab ...
- python matplotlib画图产生的Type 3 fonts字体没有嵌入问题
ScholarOne's 对python matplotlib画图产生的Type 3 fonts字体不兼容,更改措施: 在程序中添加如下语句 import matplotlib matplotlib. ...
- 使用python中的matplotlib 画图,show后关闭窗口,继续运行命令
使用python中的matplotlib 画图,show后关闭窗口,继续运行命令 在用python中的matplotlib 画图时,show()函数总是要放在最后,且它阻止命令继续往下运行,直到1.0 ...
- matplotlib画图
matplotlib画图 import numpy as np import matplotlib.pyplot as plt x1=[20,33,51,79,101,121,132,145,162, ...
- python3 使用matplotlib画图出现中文乱码的情况
python3使用matplotlib画图,因python3默认使用中unicode编码,所以在写代码时不再需要写 plt.xlabel(u’人数’),而是直接写plt.xlabel(‘人数’). 注 ...
- python使用matplotlib画图
python使用matplotlib画图 matplotlib库是python最著名的画图库.它提供了一整套和matlab类似的命令API.十分适合交互式地进行制图. 先介绍了怎样使用matplotl ...
- matplotlib画图出现乱码情况
python3使用matplotlib画图,因python3默认使用中unicode编码,所以在写代码时不再需要写 plt.xlabel(u’人数’),而是直接写plt.xlabel(‘人数’). 注 ...
随机推荐
- BZOJ 3672[NOI2014]购票(树链剖分+线段树维护凸包+斜率优化) + BZOJ 2402 陶陶的难题II (树链剖分+线段树维护凸包+分数规划+斜率优化)
前言 刚开始看着两道题感觉头皮发麻,后来看看题解,发现挺好理解,只是代码有点长. BZOJ 3672[NOI2014]购票 中文题面,题意略: BZOJ 3672[NOI2014]购票 设f(i)f( ...
- HDU-3341-Lost's revenge(AC自动机, DP, 压缩)
链接: https://vjudge.net/problem/HDU-3341 题意: Lost and AekdyCoin are friends. They always play "n ...
- 11、Spring Boot 2.x 集成 HBase
1.11 Spring Boot 2.x 集成 HBase 完整源码: Spring-Boot-Demos
- Vue中用props给data赋初始值遇到的问题解决
Vue中用props给data赋初始值遇到的问题解决 更新时间:2018年11月27日 10:09:14 作者:yuyongyu 我要评论 这篇文章主要介绍了Vue中用props给dat ...
- MySQL 源码编译安装脚本
cat mysql_init.shmysql_init.sh mysql_init.sh.20190401 mysql_init.sh.back20171030 ...
- Gradle 如何打包 Spring Boot 可执行 JAR
如何在 Gradle 中配置一个项目可以打包为 Spring Boot 可执行 Jar? 你首先需要添加到 org.springframework.boot 到插件中: 例如下面的代码: plugin ...
- Applications (ZOJ 3705)
题解:就是题目有点小长而已,可能会不想读题,但是题意蛮好理解的,就是根据条件模拟,计算pts.(送给队友zm. qsh,你们不适合训练了.) #include <iostream> #in ...
- codeforces gym #101161F-Dictionary Game(字典树+树上删边游戏)
题目链接: http://codeforces.com/gym/101161/attachments 题意: 给一个可以变化的字典树 在字典树上删边 如果某条边和根节点不连通那么这条边也删除 谁没得删 ...
- JS的十大排序算法
名词解释: n: 数据规模k:“桶”的个数In-place: 占用常数内存,不占用额外内存Out-place: 占用额外内存稳定性:排序后2个相等键值的顺序和排序之前它们的顺序相同 冒泡排序(Bub ...
- 一、Linux的基础使用--登录、开关机与在线、命令的查询帮助
目录 一.Linux的基础使用 1.1 X Window 与命令行模式的切换 1.2 命令行模式下命令的执行 1.3 修改支持语系 1.4 基础命令的操作 1.5 几个重要的热键[Tab].[Ctrl ...