matplotlib画图总结--多子图布局
1、subplot布局
subplot(nrows, ncols, index, **kwargs)
subplot(pos, **kwargs)
subplot(ax)
x=[1,2,3]

values = [10, 15, 25]

p1=plt.subplot(221)

plt.bar(x, values)

p1.set_ylabel('yy')

p1.set_title('p1')

plt.subplot(222)

plt.scatter(x, values)

plt.subplot(223)

plt.plot(x, values)

plt.suptitle('subplot')

plt.show()
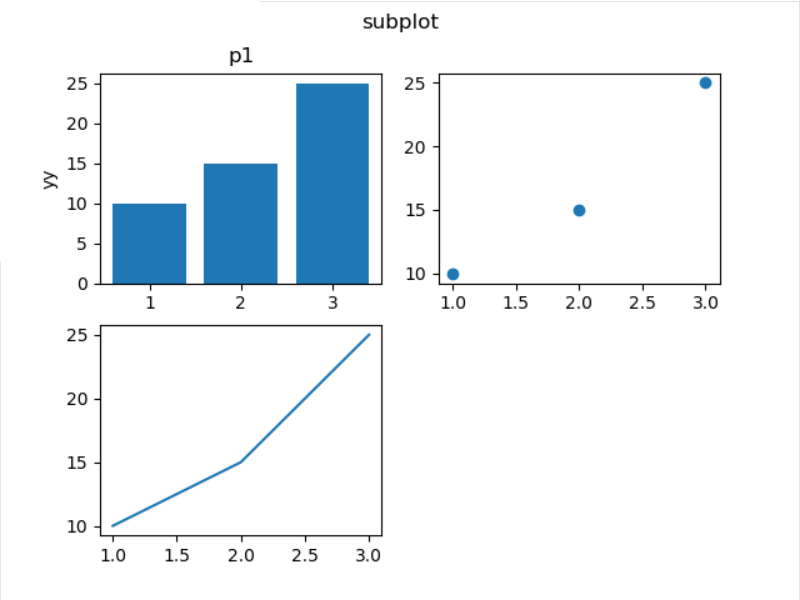
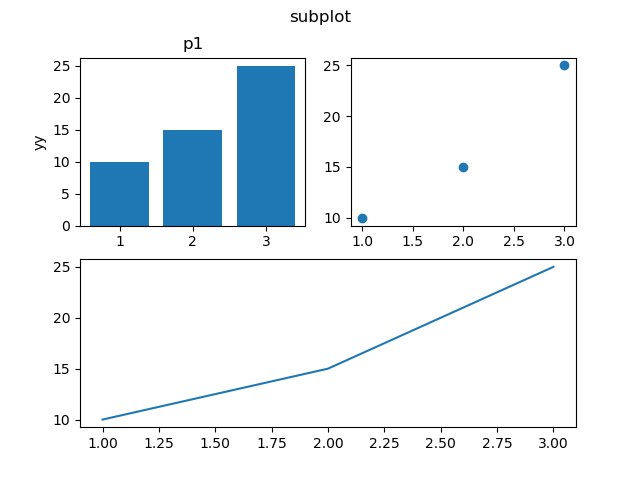
上面的图第三张只占半个图纸长度,不美观。那么使用subplot怎么画非对阵图呢?重新定义子图的分布行列即可。
plt.subplot(212) 或plt.subplot(2,1,2)把图纸分为2行1列,当前子图是第二个。
x=[1,2,3]

values = [10, 15, 25]

p1=plt.subplot(221)

plt.bar(x, values)

p1.set_ylabel('yy')

p1.set_title('p1')

plt.subplot(222)

plt.scatter(x, values)

plt.subplot(212)

plt.plot(x, values)

plt.suptitle('subplot')

plt.show()
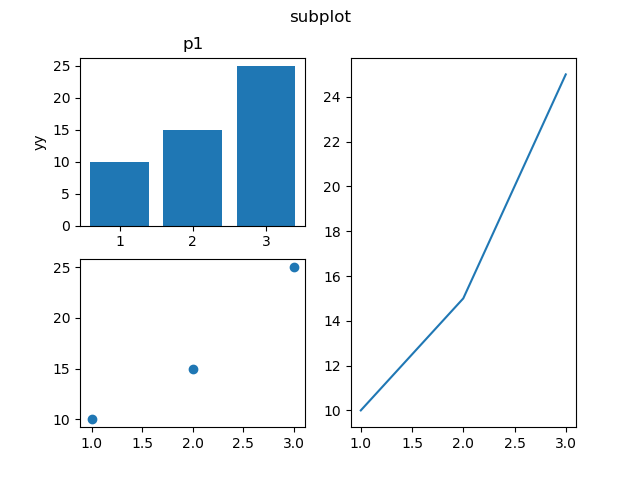
先把图纸分为2行2列,先画图1和图3,然后再把图纸划分为1行2列,对第二列绘图。
x=[1,2,3]

values = [10, 15, 25]

p1=plt.subplot(221)

plt.bar(x, values)

p1.set_ylabel('yy')

p1.set_title('p1')

plt.subplot(223)

plt.scatter(x, values)

plt.subplot(1,2,2)

plt.plot(x, values)

plt.suptitle('subplot')

plt.show()
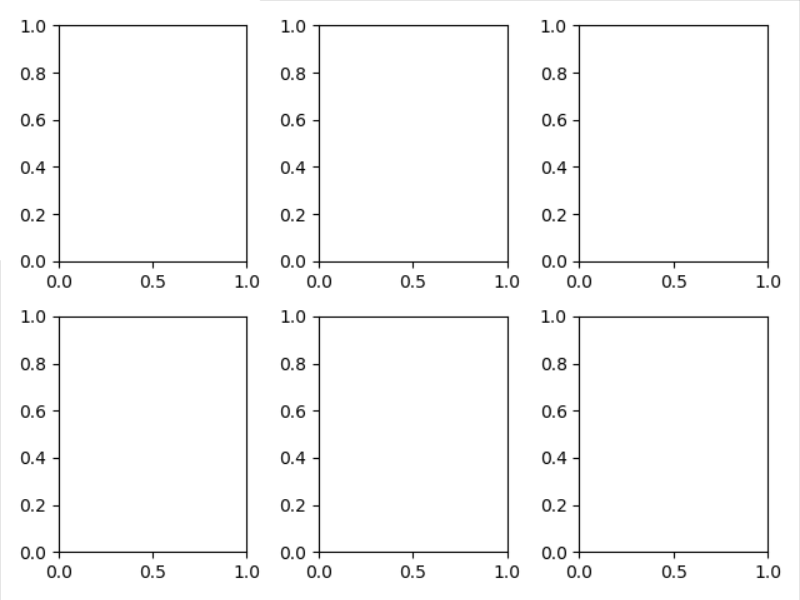
2、subplots布局
matplotlib.pyplot.subplots(nrows=1, ncols=1, sharex=False, sharey=False, squeeze=True, subplot_kw=None, gridspec_kw=None, **fig_kw) :创建一个图形和一组子图。
fig, ax = plt.subplots(2, 3)

fig.tight_layout()

ax[0].text(0.5,0.5, 'sss')

plt.show()
3、subplot2grid布局
matplotlib.pyplot.subplot2grid(shape, loc, rowspan=1, colspan=1, fig=None, **kwargs)
shape : sequence of 2 ints
loc : sequence of 2 ints
rowspan : int
Number of rows for the axis to span to the right.
colspan : int
Number of columns for the axis to span downwards.
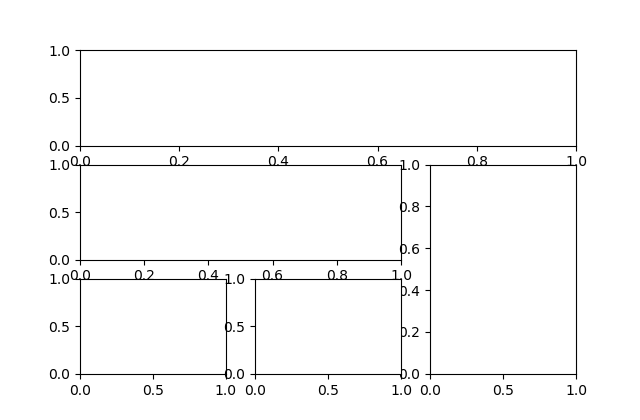
fig = plt.figure()

ax1 = plt.subplot2grid((3, 3), (0, 0), colspan=3)

ax2 = plt.subplot2grid((3, 3), (1, 0), colspan=2)

ax3 = plt.subplot2grid((3, 3), (1, 2), rowspan=2)

ax4 = plt.subplot2grid((3, 3), (2, 0))

ax5 = plt.subplot2grid((3, 3), (2, 1))

plt.show()
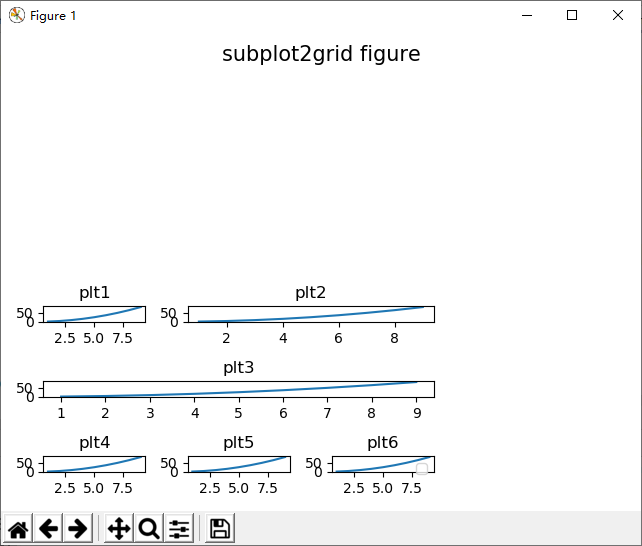
x = np.arange(1,10)

fig = plt.figure()

ax1 = plt.subplot2grid((3, 3), (0, 0), colspan=1, title = 'plt1')

ax1.plot(x,x*x)

ax2 = plt.subplot2grid((3, 3), (0, 1), colspan=2, title = 'plt2')

ax2.plot(x,x*x)

ax3 = plt.subplot2grid((3, 3), (1, 0), colspan=3, title = 'plt3')

ax3.plot(x,x*x)

ax4 = plt.subplot2grid((3, 3), (2, 0), title = 'plt4')

ax4.plot(x,x*x)

ax5 = plt.subplot2grid((3, 3), (2, 1), title = 'plt5')

ax5.plot(x,x*x)

ax6 = plt.subplot2grid((3, 3), (2, 2), title = 'plt6')

ax6.plot(x,x*x)

plt.legend()

plt.suptitle('subplot2grid figure',  x=0.5,y=0.95, ha='center', va='center', fontsize=15)

plt.show()
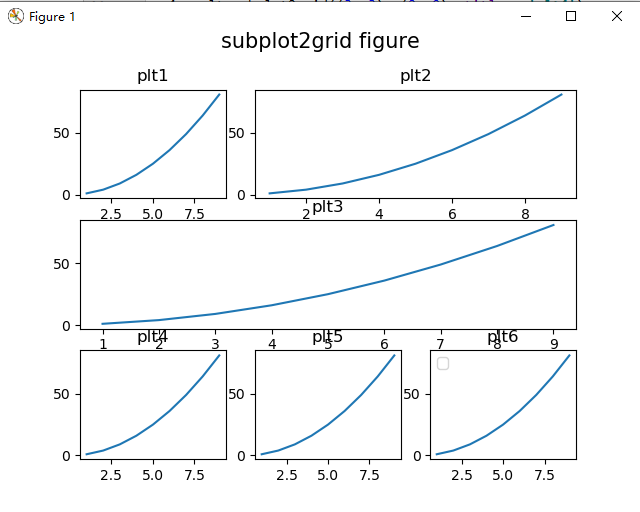
可见上面的图,x周名称和附件的图互相干涉。需要缩小图或者加大间隙。
使用layout函数plt.tight_layout()。但是图的title和第一行干涉。
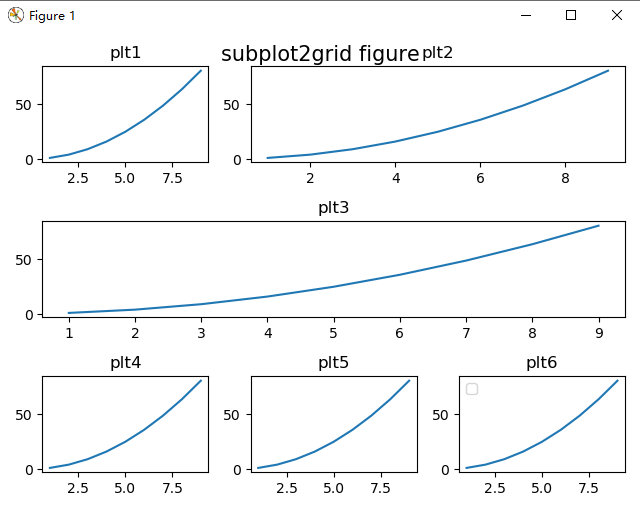
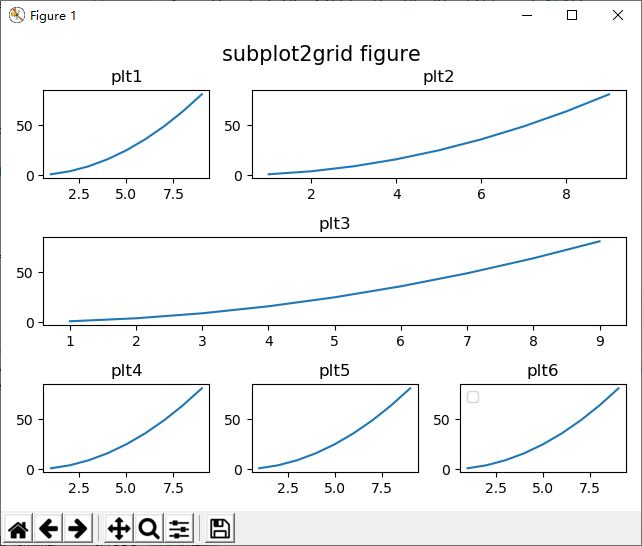
plt.tight_layout(rect=[0, 0, 1, 0.95]) 或者添加一句fig.subplots_adjust(top=0.85)即可。
matplotlib.pyplot.tight_layout(pad=1.08, h_pad=None, w_pad=None, rect=None)
其中rect可以这样定义:[left, bottom, right, top] in normalized (0, 1) figure coordinates,所以可以定义right和top,进行图的缩放。
A rectangle (left, bottom, right, top) in the normalized figure coordinate that the whole subplots area (including labels) will fit into. Default is (0, 0, 1, 1).
图的缩放,做个实验plt.tight_layout(rect=[0, 0, 0.7, 0.5])
matplotlib画图总结--多子图布局的更多相关文章
- matplotlib 画图
matplotlib 画图 1. 画曲线图 Tompson = np.array([0, 0, 0, 0, 0.011, 0.051, 0.15, 0.251, 0.35, 0.44, 0 ...
- matplotlib画图实例:pyplot、pylab模块及作图參数
http://blog.csdn.net/pipisorry/article/details/40005163 Matplotlib.pyplot画图实例 {使用pyplot模块} matplotli ...
- matplotlib画图报错This figure includes Axes that are not compatible with tight_layout, so results might be incorrect.
之前用以下代码将实验结果用matplotlib show出来 plt.plot(np.arange(len(aver_reward_list)), aver_reward_list) plt.ylab ...
- python matplotlib画图产生的Type 3 fonts字体没有嵌入问题
ScholarOne's 对python matplotlib画图产生的Type 3 fonts字体不兼容,更改措施: 在程序中添加如下语句 import matplotlib matplotlib. ...
- 使用python中的matplotlib 画图,show后关闭窗口,继续运行命令
使用python中的matplotlib 画图,show后关闭窗口,继续运行命令 在用python中的matplotlib 画图时,show()函数总是要放在最后,且它阻止命令继续往下运行,直到1.0 ...
- matplotlib画图
matplotlib画图 import numpy as np import matplotlib.pyplot as plt x1=[20,33,51,79,101,121,132,145,162, ...
- python3 使用matplotlib画图出现中文乱码的情况
python3使用matplotlib画图,因python3默认使用中unicode编码,所以在写代码时不再需要写 plt.xlabel(u’人数’),而是直接写plt.xlabel(‘人数’). 注 ...
- python使用matplotlib画图
python使用matplotlib画图 matplotlib库是python最著名的画图库.它提供了一整套和matlab类似的命令API.十分适合交互式地进行制图. 先介绍了怎样使用matplotl ...
- matplotlib画图出现乱码情况
python3使用matplotlib画图,因python3默认使用中unicode编码,所以在写代码时不再需要写 plt.xlabel(u’人数’),而是直接写plt.xlabel(‘人数’). 注 ...
随机推荐
- Js实现table单双行交替色
依稀记得,当初我刚学编程的时候还学过怎么实现表格单双行交替色,现如今早已记不清当时的实现思路,这两天突然想起,没事就自己写了一小段代码,也不知道是否是当年的思路,不过不用纠结这个问题.:) 代码很简单 ...
- linux笔试题
1. cron 后台常驻程序 (daemon) 用于: A. 负责文件在网络中的共享 B. 管理打印子系统 C. 跟踪管理系统信息和错误 D. 管理系统日常任务的调度 2. 在大多数Linux发行版本 ...
- Educational Codeforces Round 72 (Rated for Div. 2) C题
C. The Number Of Good Substrings Problem Description: You are given a binary string s (recall that a ...
- devstack cinder-volume服务状态为down
cinder-manage service list 查看到有一个 xxx状态 Binary Host Zone Status State Updated At RPC Version Object ...
- css 计算值函数
css有一些强大的函数: 1. calc 可以混合多种单位来计算 div { font-size: calc(100vw/5 + 1rem - 100px) } 2. max.min.clamp ma ...
- fluent中统计颗粒信息【转载】
转载自:http://mp.weixin.qq.com/s?__biz=MjM5MDkyMjA1Nw==&mid=502657725&idx=1&sn=120703a69e56 ...
- Django中常用的基本命令
django-admin startproject 项目的名称 创建一个项目 python manage.py startapp 应用的名称 创建一个应用 python manage.py ru ...
- javascript中稀疏数组和密集数组
密集数组 数组是一片连续的存储空间,有着固定的长度.加入数组其实位置是address,长度为n,那么占用的存储空间是address[0],address[1],address[2].......add ...
- 【面试题总结】1、统计字符串中某个字符出现的次数(2-Python实现)
1.可以使用Python的字典实现,对于一个特定的字符串,使用for循环遍历其中的字符,并保存成字典形式.字典的key为字符,value为字符在整个字符串中出现的次数. 2.拓展:如果题目为比较两个字 ...
- netframework webapi IogAttribute记录request参数和错误信息
参考博客 https://www.cnblogs.com/hnsongbiao/p/7039666.html 书写LogFilterAttribute public class LogFilterAt ...