使用bootchart 对 高通Android 进行性能分析
使用bootchart 对 高通Android 进行性能分析
Android版本:7.0
适用平台:高通和MTK
参考:
- https://blog.csdn.net/qq_19923217/article/details/81043736
- https://www.zybuluo.com/guhuizaifeiyang/note/886803
bootchart 简介
bootchart 是一个用于 linux 启动过程性能分析的开源工具软件,在系统启动过程中自动收集 CPU 占用率、磁盘吞吐率、进程等信息,并以图形方式显示分析结果,可用作指导优化系统启动过程。
bootchart 让用户可以很直观的查看系统启动的过程和各个过程耗费的时间,以便让用户能够分析启动过程,从而进行优化以提高启动时间。
它由 bootchartd 服务和 bootchart-render 两部分组成,后者主要负责生成启动流程的分析结果图。
Android 系统源码中有 bootchart 的实现,路径在 system/core/init/bootchart.cpp 中, bootchart 通过内嵌在 init 进程中实现,在后台执行测量。不过 bootchart 的测量时段是 init 进程启动之后,不包含 uboot 和 kernel 的启动时间。
参考文档:system/core/init/readme.txt中的Bootcharting这一章
Bootcharting

------------

This version of init contains code to perform "bootcharting": generating log

files that can be later processed by the tools provided by www.bootchart.org.

On the emulator, use the -bootchart <timeout> option to boot with bootcharting

activated for <timeout> seconds.

On a device, create /data/bootchart/start with a command like the following:

  adb shell 'echo $TIMEOUT > /data/bootchart/start'

Where the value of $TIMEOUT corresponds to the desired bootcharted period in

seconds. Bootcharting will stop after that many seconds have elapsed.

You can also stop the bootcharting at any moment by doing the following:

  adb shell 'echo 1 > /data/bootchart/stop'

Note that /data/bootchart/stop is deleted automatically by init at the end of

the bootcharting. This is not the case with /data/bootchart/start, so don't

forget to delete it when you're done collecting data.

The log files are written to /data/bootchart/. A script is provided to

retrieve them and create a bootchart.tgz file that can be used with the

bootchart command-line utility:

  sudo apt-get install pybootchartgui

  # grab-bootchart.sh uses $ANDROID_SERIAL.

  $ANDROID_BUILD_TOP/system/core/init/grab-bootchart.sh

One thing to watch for is that the bootchart will show init as if it started

running at 0s. You'll have to look at dmesg to work out when the kernel

actually started init.

Comparing two bootcharts

------------------------

A handy script named compare-bootcharts.py can be used to compare the

start/end time of selected processes. The aforementioned grab-bootchart.sh

will leave a bootchart tarball named bootchart.tgz at /tmp/android-bootchart.

If two such barballs are preserved on the host machine under different

directories, the script can list the timestamps differences. For example:

Usage: system/core/init/compare-bootcharts.py base_bootchart_dir

       exp_bootchart_dir

process: baseline experiment (delta)

 - Unit is ms (a jiffy is 10 ms on the system)

------------------------------------

/init: 50 40 (-10)

/system/bin/surfaceflinger: 4320 4470 (+150)

/system/bin/bootanimation: 6980 6990 (+10)

zygote64: 10410 10640 (+230)

zygote: 10410 10640 (+230)

system_server: 15350 15150 (-200)

bootanimation ends at: 33790 31230 (-2560)
bootchart 在 android 平台的使用步骤
编译 bootchart
在 Android 5.1 之前 bootchart 是没有编译进系统的,需要使用下面的宏手动打开编译,在 Android 6.0 以上系统默认已经编译了 bootchart,
可以 adb shell 命令进入文件系统,可以看到 /data/bootchart 目录存在。
打开 bootchart 收集开机数据
0、修改高通代码:system/core/init/Android.mk,删掉下列这一行,重新编译烧录boot.img 、system.img
如果没有此步骤,将导致手机不断重启,无法开机。
LOCAL_SANITIZE := integer
安卓7.1的代码。一直不断重启:system/core/init/bootchart.cpp 这个文件有bug
stat.replace(open + 1, close - open - 1, full_name);这个函数注释不跑就不会一直重启了,但是这样对你bootchart造成多大影响你看看,是否还能分析。
1、首先使能 bootchart,bootchart 操作的前提是存在 enable 标记
所以 在你不需要收集数据的时候别忘了删除这个标记。
adb shell 'touch /data/bootchart/enabled'
2、抓取
adb shell 'echo $TIME_OUT > /data/bootchart/start' # 添加 bootchart timeout 时间

adb shell reboot # 重启后生效
其中$TIMEOUT是期望采样的时间,单位为秒,例如要采样两分钟,则执行:
adb shell 'echo 120 > /data/bootchart-start'
3、提取
可以看到 bootchart 生成的数据文件和 log 都被保存在 /data/bootchart 路径下,打包以后使用 adb pull 命令将文件拷贝出来
下列的命令也可以使用:
system/core/init/grab-bootchart.sh代替
adb shell 'cd /data/bootchart ;tar -zcf boochart.tgz *'
在 HOST 机上分析 bootchart 图表
PC 机安装 bootchart 工具
sudo apt-get install -y pybootchartgui
生成 bootchar 图表
拷贝 bootchart.tgz 到 PC 中,并执行下面的命令生成图表
bootchart bootchart.tgz
bootchart 图形分析小技巧
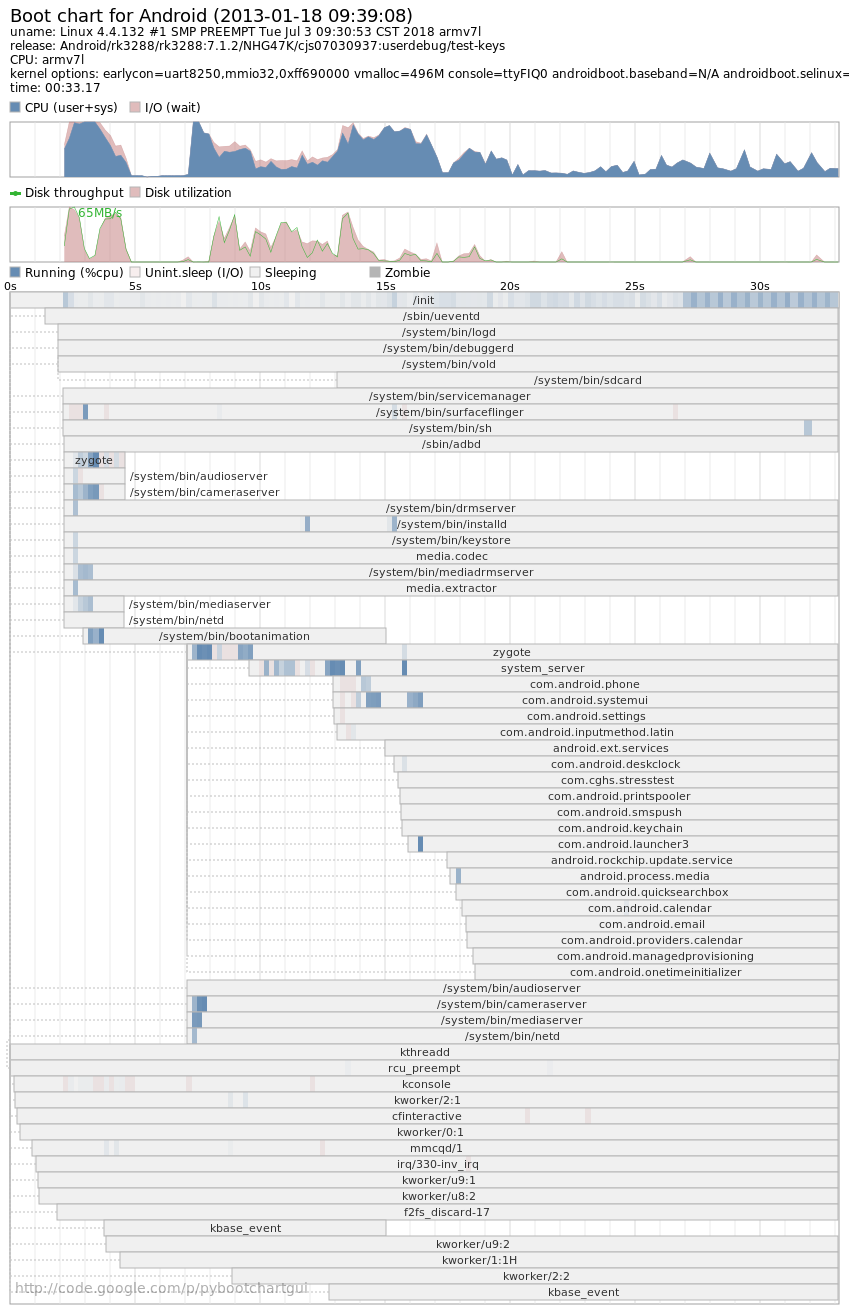
整个图表以时间线为横轴,图标上方为 CPU 和 磁盘的利用情况,下方是各进程的运行状态条,显示各个进程的开始时间与结束时间以及对 CPU、I/O 的利用情况,我们关心的各个进程的运行时间以及 CPU 的使用情况,进而优化系统。
可以通过 Laucher 的启动时间判断开机完成完成时间
通过进程的时间长短判断是否存在异常,如图表上的 第一个 Zygote 进程启动时间很短,显示存在异常,后又成功重新启动了一遍。
使用bootchart 对 高通Android 进行性能分析的更多相关文章
- 高通Android平台硬件调试之Camera篇
之前一段时间有幸在高通android平台上调试2款camera sensor,一款是OV的5M YUV sensor,支持jpeg out,同时也支持AF,调试比较比较简单,因为别的项目已经在使用了, ...
- 高通Android display架构分析
目录(?)[-] Kernel Space Display架构介绍 函数和数据结构介绍 函数和数据结构介绍 函数和数据结构介绍 数据流分析 初始化过程分析 User Space display接口 K ...
- 高通Android display分析【转】
本文转载自:http://blog.csdn.net/zhangchiytu/article/details/6777039 高通7系列硬件架构分析 如上图,高通7系列 Display的硬件部分主要由 ...
- JVM 利用 VisualVM 对高并发项目进行性能分析(转)
出处: 深入理解 Java 虚拟机-如何利用 VisualVM 对高并发项目进行性能分析 前面在学习JVM的知识的时候,一般都需要利用相关参数进行分析,而分析一般都需要用到一些分析的工具,因为一般使 ...
- 深入理解Java虚拟机-如何利用VisualVM对高并发项目进行性能分析
前面在学习JVM的知识的时候,一般都需要利用相关参数进行分析,而分析一般都需要用到一些分析的工具,因为一般使用IDEA,而VisualVM对于IDEA也不错,所以就选择VisualVM来分析JVM性能 ...
- 高通android开发摘要
一部分是开源的,可以从codeaurora.org上下载,还有一部分是高通产权的,需要从高通的网站上下载. 将高通产权的代码放到:vendor/qcom/proprietary 1. 设置bms一些参 ...
- 高通Android camera运行流程【转】
本文转载自:http://blog.csdn.net/unicornkylin/article/details/13293295 1.总体架构 Android Camera 框架从整体上看是一个 cl ...
- 高通android开发缩写
1.TLMM MSM TLMM pinmux controller,Qualcomm MSM integrates a GPIO and Pin mux/config hardware, (TOP L ...
- 高通 android平台LCD驱动分析
目前手机芯片厂家提供的源码里包含整个LCD驱动框架,一般厂家会定义一个xxx_fb.c的源文件,注册一个平台设备和平台驱动,在驱动的probe函数中来调用register_framebuffer(), ...
- 【转】高通平台android 环境配置编译及开发经验总结
原文网址:http://blog.csdn.net/dongwuming/article/details/12784535 1.高通平台android开发总结 1.1 搭建高通平台环境开发环境 在高通 ...
随机推荐
- 【2023微博签到爬虫】用python爬上千条m端微博签到数据
一.爬取目标 大家好,我是 @马哥python说,一枚10年程序猿. 今天分享一期python爬虫案例,爬取目标是新浪微博的微博签到数据,字段包含: 页码,微博id,微博bid,微博作者,发布时间,微 ...
- ansible(3)--ansible的相关命令行工具
目录 1 ansible命令详解 2 ansible-doc显示模块帮助信息 3 ansible-playbook 4 ansible-galaxy 5 ansible-console 1 ansib ...
- 1.简单的C语言程序
简单的C语言程序 什么是计算机程序? 什么是计算机语言? 所谓程序,就是一组计算机能识别和执行的指令. 什么是计算机语言? 机器语言(0,1 '低级语言'),汇编语言(符号化 '低级语言'),高级语言 ...
- Wordpress小技巧(一)
★★★ Wordpress发表Post文章时,页面会出现评论框,如何禁止出现评论框.步骤如下: 一.使用wordpress的后台功能关闭文章评论依次进入"后台"-"设置 ...
- leaflet 河流颜色渐变效果
1.Leaflet-polycolor github地址:https://github.com/Oliv/leaflet-polycolor 插件缺陷:需要把每个折点的颜色都指定才行,一般做不到 2. ...
- [popover, select] el-popover内有select的时候在选择后会自动关闭
Steps to reproduce 选择某个选项后会自动关闭 What is Expected? 选择后不自动关闭,等点击按钮后再去触发组件内的关闭方法. What is actually happ ...
- C 语言编程 — 头文件
目录 文章目录 目录 前文列表 头文件 只引用一次头文件 有条件引用 global.h 前文列表 <程序编译流程与 GCC 编译器> <C 语言编程 - 基本语法> <C ...
- 【漏洞通报】WEB VIDEO PLATFORM疑似存在未授权访问漏洞
漏洞描述 WEB VIDEO PLATFORM是一个基于GB28181-2016标准实现的开箱即用的网络视频平台,负责实现核心信令与设备管理后台部分,支持NAT穿透,支持海康.大华.宇视等品牌的IPC ...
- keycloak~正确让api接口支持跨域
相关参考 https://leejjon.medium.com/how-to-allow-cross-origin-requests-in-a-jax-rs-microservice-d2a6aa2d ...
- 关于MySQL数据库大字符串存取 类型选择
摘自:https://blog.csdn.net/weixin_40485506/article/details/83588169 关于MySQL数据库存储大字符串类型长度 根据所要存取字符长度及My ...