gcview使用
1.下载适用的版本
https://github.com/chewiebug/GCViewer
Supported verbose:gc formats are:
- Oracle JDK 1.8 -Xloggc: [-XX:+PrintGCDetails] [-XX:+PrintGCDateStamps]
- Sun / Oracle JDK 1.7 with option -Xloggc: [-XX:+PrintGCDetails] [-XX:+PrintGCDateStamps]
- Sun / Oracle JDK 1.6 with option -Xloggc: [-XX:+PrintGCDetails] [-XX:+PrintGCDateStamps]
- Sun JDK 1.4/1.5 with the option -Xloggc: [-XX:+PrintGCDetails]
- Sun JDK 1.2.2/1.3.1/1.4 with the option -verbose:gc
- IBM JDK 1.3.1/1.3.0/1.2.2 with the option -verbose:gc
- IBM iSeries Classic JVM 1.4.2 with option -verbose:gc
- HP-UX JDK 1.2/1.3/1.4.x with the option -Xverbosegc
- BEA JRockit 1.4.2/1.5/1.6 with the option -verbose:memory [-Xverbose:gcpause,gcreport] [-Xverbosetimestamp]
我使用的jdk8,点击tab的wiki
点击
- Downloads / Changelog: Download links and change description of the changes for each release
下载当前最新版本1.3.5的jar文件
2. 执行在windows环境
从cmd进入jar目录,执行jar -jar xxx.jar
出现图形界面,加载gc.log文件后如下图所示:

我们先了解一下各个颜色代表的含义:
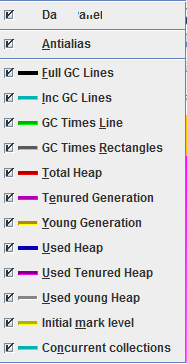
GCViewer shows a number of lines etc. in a chart (first tab). These are:
- Full GC Lines:
- Black vertical line at every Full GC
- Inc GC Lines:
- Cyan vertical line at every Incremental GC
- GC Times Line:
- Green line that shows the length of all GCs
- GC Times Rectangles:
- black rectangle at every Full GC
- blue rectangle at every inital mark event
- orange rectangle at every remark event
- red rectangle at every vm operation event ("application stopped...")
- Grey rectangle at every 'normal' GC
- Light grey rectangle at every Incremental GC
- Total Heap:
- Red line that shows heap size
- Tenured Generation:
- Magenta area that shows the size of the tenured generation (not available without PrintGCDetails)
- Young Generation:
- Orange area that shows the size of the young generation (not available without PrintGCDetails)
- Used Heap:
- Blue line that shows used heap size
- Initial mark level:
- Yellow line that shows the heap usage at "initial-mark" event (only available when the gc algorithm uses concurrent collections, which is the case for CMS and G1)
- Concurrent collections
- Cyan vertical line for every begin (concurrent-mark-start) and pink vertical line for every end (CMS-concurrent-reset / G1: concurrent-cleanup-end) of a concurrent collection cycle
In the second tab ("Event details") it shows details about the events it parsed: E.g. events like the following
24.187: [GC 24.188: [ParNew: 93184K->5464K(104832K), 0.0442895 secs] \ 93184K->5464K(1036928K), 0.0447149 secs] \ [Times: user=0.39 sys=0.07, real=0.05 secs]
are shown in one line as GC ParNew: , , ...
Events like these
4183.962: [Full GC 4183.962: [CMS: 32957K->40326K(932096K), 2.3313389 secs] \ 76067K->40326K(1036928K), [CMS Perm : 43837K->43453K(43880K)], 2.3339606 secs] \ [Times: user=2.33 sys=0.01, real=2.33 secs]
are shown as Full GC; CMS; CMS Perm ...
So for every line the text is extracted (not always every part of it). This allows a user which is familiar with the text log files to find out more details about the events that occurred.
3. 各个参数的意义:
Summary
- Footprint:
- Maximal amount of memory allocated
- Max heap after conc GC:
- Max used heap after concurrent gc.
- Max tenured after conc GC:
- Max used tenured heap after concurrent gc (followed by % of max tenured / % of max total heap).
- Max heap after full GC:
- Max used heap after full gc. Indicates max live object size and can help to determine heap size.
- Freed Memory:
- Total amount of memory that has been freed
- Freed Mem/Min:
- Amount of memory that has been freed per minute
- Total Time:
- Time data was collected for (only if timestamp was present in log)
- Acc Pauses:
- Sum of all pauses due to GC
- Throughput:
- Time percentage the application was NOT busy with GC
- Full GC Performance:
- Performance of full collections. Note that all collections that include a collection of the tenured generation or are marked with "Full GC" are considered Full GC.
- GC Performance:
- Performance of minor collections. These are collections that are not full according to the definition above.
Memory
- Total heap (usage / alloc max):
- Max memory usage / allocation in total heap (the last is the same as "footprint" in Summary)
- Tenured heap (usage / alloc max):
- Max memory usage / allocation in tenured space
- Young heap (usage / alloc max):
- Max memory usage / allocation in young space
- Perm heap (usage / alloc max):
- Max memory usage / allocation in perm space
- Max tenured after conc GC:
- see in "summary" section
- Avg tenured after conc GC:
- average size of tenured heap after concurrent collection
- Max heap after conc GC:
- see in "summary" section
- Avg heap after conc GC:
- average size of concurrent heap after concurrent collection
- Max heap after full GC:
- see in "summary" section
- Avg after full GC:
- The average heap memory consumption after a full collection
- Avg after GC:
- The average heap memory consumption after a minor collection
- Freed Memory:
- Total amount of memory that has been freed
- Freed by full GC:
- Amount of memory that has been freed by full collections
- Freed by GC:
- Amount of memory that has been freed by minor collections
- Avg freed full GC:
- Average amount of memory that has been freed by full collections
- Avg freed GC:
- Average amount of memory that has been freed by minor collections
- Avg rel inc after FGC:
- Average relative increase in memory consumption between full collections. This is the average difference between the memory consumption after a full collection to the memory consumption after the next full collection.
- Avg rel inc after GC:
- Average relative increase in memory consumption between minor collections. This is the average difference between the memory consumption after a minor collection to the memory consumption after the next minor collection. This can be used as an indicator for the amount of memory that survives minor collections and has to be moved to the survivor spaces or the tenured generation. This value added to "Avg freed GC" gives you an idea about the size of the young generation in case you don't have PrintGCDetails turned on.
- Slope full GC:
- Slope of the regression line for the memory consumption after full collections. This can be used as an indicator for the increase in indispensable memory consumption (base footprint) of an application over time.
- Slope GC:
- Average of the slope of the regression lines for the memory consumption after minor collections in between full collections. That is, if you have two full collections and many minor collections in between, GCViewer will calculate the slope for the minor collections up to the first full collection, then the slope of the minor collections between the first and the second full collection. Then it will compute a weighted average (each slope wil be weighted with the number of measuring points it was computed with).
- initiatingOccFraction (avg / max)
- CMS GC kicks in before tenured generation is filled. InitiatingOccupancyFraction tells you the avg / max usage in % of the tenured generation, when CMS GC started (initial mark). This value can be set manually using -XX:CMSInitiatingOccupancyFraction=.
- avg promotion
- Promotion means the size of objects that are promoted from young to tenured generation during a young generation collection. Avg promotion shows the average amount of memory that is promoted from young to tenured with each young collection (only available with PrintGCDetails)
- total promotion
- Total promotion shows the total amount of memory that is promoted from young to tenured with all young collections in a file (only available with PrintGCDetails)
Pause
- Acc Pauses:
- Sum of all pauses due to any kind of GC
- Number of Pauses:
- Count of all pauses due to any kind of GC
- Avg Pause:
- Average length of a GC pause of any kind
- Min / max Pause:
- Shortest /longest pause of any kind
- Avg pause interval:
- avg interval between two pauses of any kind
- Min / max pause interval:
- Min / max interval between two pauses of any kind
- Acc full GC:
- Sum of all pauses due to full collections
- Number of full GC pauses:
- Count of all pauses due to full collections
- Acc GC:
- Sum of all full GC pauses
- Avg full GC:
- Average length of a full GC pause
- Min / max full GC pause:
- Shortest / longest full GC pause
- Acc GC:
- Sum of all pauses due to minor collections
- Number of GC pauses:
- Count of all pauses due to minor collections
- Avg GC:
- Average length of a minor collection pause
- Min / max GC pause:
- Shortest / longest minor GC pause
gcview使用的更多相关文章
- JVM问题定位工具
JDB JDB是基于文本和命令行的调试工具,Jikes在JDB的基础上提供了GUI.熟悉JDB还是有价值的,很多情况下需要我们在命令行下完成简单的debug问题定位. 1 2 3 jdb -class ...
随机推荐
- (谷歌浏览器等)解决css中点击input输入框时出现外边框方法【outline:medium;】
问题:在使用谷歌浏览器,360浏览器时,点击input输入框会出现带颜色的外边框,如下图所示:
- mysql忘记密码重置(mac)
setp1: 苹果->系统偏好设置->最下边点mysql 在弹出页面中 关闭mysql服务(点击stop mysql server) step2:进入终端输入:cd /usr/local/ ...
- 解决ScrollView嵌套ListView,ListView填充容器后,界面自动滚动回顶部的问题
1.scrollView.scrollTo(0,0),有时可以,有时不行: 2.listView.post(new Runnable() { ...
- Quartz 2.2.x CronTrigger Tutorial
http://www.quartz-scheduler.org/documentation/quartz-2.2.x/tutorials/crontrigger.html Introduction c ...
- hdu - 4608 - I-number
题意:给出一个正整数x,求最小的整数y,满足y > x且y的所有位的数字和是10的倍数.(x <= 100000) 题目链接:http://acm.hdu.edu.cn/showprobl ...
- pip 安装psycopg的错误
psycopg包安装有点问题,特别是在windows下,pip从requirements.txt批量安装总是出错,发现是这个包的问题. 这里需要用easy_install来装,因为gfw的问题,最好下 ...
- 清除mac os svn密码命令行缓存
删除认证缓存设置即可,如下:rm -rf ~/.subversion/auth by yytong
- ORA-12571: TNS:packet writer failure
ORA-12571:TNS:包复写器失效 2007-05-28 22:04 ORA-12571:TNS:包复写器失效 近日一直在做Oracle数据库的搭建(入门),在搭建过程中遇到“ORA-12571 ...
- FMDB 版本迁移
FMDB 版本迁移 安装 1. 通过CocoaPods 在项目根目录创建并编辑 Podfile 内容如下 $ cd /path/to/MyProject $ touch Podfile $ edit ...
- Swift 3 新特性
原文:What's New in Swift 3? ,作者:Ben Morrow,译者:kmyhy Swift 3将于今年下半年推出,为Swift开发者们带来了很多核心代码的改变.如果你没有关注过 S ...