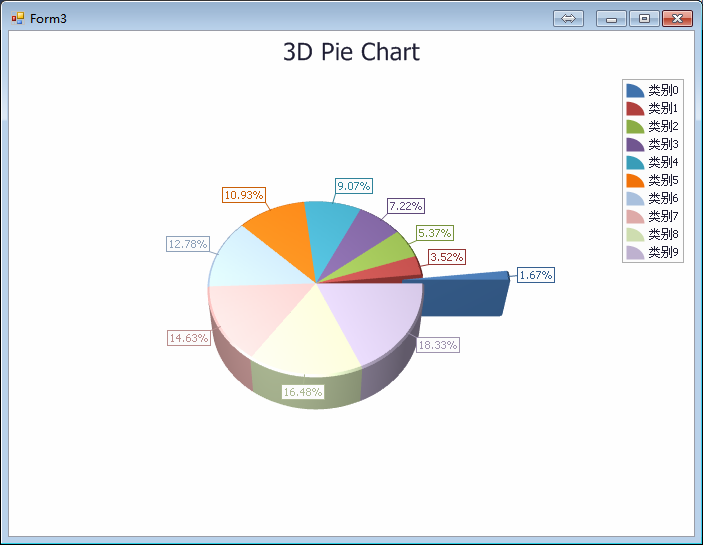
ChartControl ViewType.Pie3D 用法测试
效果图一、
    public partial class Form3 : Form

    {

        public Form3()

        {

            InitializeComponent();

        }

        private void Form3_Load(object sender, EventArgs e)

        {

            // Create an empty chart.

            ChartControl PieChart3D = new ChartControl();

            // Create a pie series.

            Series series1 = new Series("Pie Series 1", ViewType.Pie3D);

            //// Populate the series with points.

            //series1.Points.Add(new SeriesPoint("Russia", 17.0752));

            //series1.Points.Add(new SeriesPoint("Canada", 9.98467));

            //series1.Points.Add(new SeriesPoint("USA", 9.63142));

            //series1.Points.Add(new SeriesPoint("China", 9.59696));

            //series1.Points.Add(new SeriesPoint("Brazil", 8.511965));

            //series1.Points.Add(new SeriesPoint("Australia", 7.68685));

            //series1.Points.Add(new SeriesPoint("India", 3.28759));

            //series1.Points.Add(new SeriesPoint("Others", 81.2));

            DataTable dt = new DataTable();

            dt.Columns.Add("X轴", Type.GetType("System.String"));

            dt.Columns.Add("线①", Type.GetType("System.Int32"));

            dt.Columns.Add("线②", Type.GetType("System.Int32"));

            dt.Columns.Add("线③", Type.GetType("System.Int32"));

            dt.Columns.Add("线④", Type.GetType("System.Int32"));

            for (int i = ; i < ; i++)

            {

                Random rd = new Random();

                DataRow dr = dt.NewRow();

                dr["X轴"] = ("类别" + i.ToString());

                dr["线①"] = rd.Next(i * , (i + ) * ); ;

                dr["线②"] = rd.Next(i * , (i + ) * );

                dr["线③"] = rd.Next(i * , (i + ) * );

                dr["线④"] = rd.Next(i * , (i + ) * );

                dt.Rows.Add(dr);

            }

            series1.DataSource = dt;

            series1.ArgumentDataMember = "X轴"; //设置公共的X轴值(刻度)

            series1.ValueScaleType = ScaleType.Numerical;

            //设置 单个Series2 Y轴的(值)

            series1.ValueDataMembers.AddRange(new string[] { "线①" });

            // Add the series to the chart.

            PieChart3D.Series.Add(series1);

            //series1.LegendPointOptions.PointView = PointView.ArgumentAndValues;//格式:【类别:百分比】

            series1.LegendPointOptions.PointView = PointView.Argument;//格式:【类别】

            //series1.LegendPointOptions.PointView = PointView.Values;//格式:【百分比】

            //series1.LegendPointOptions.PointView = PointView.SeriesName;//显示series1的Name

            //series1.LegendPointOptions.PointView = PointView.Undefined;//显示效果:【百分比】

            // Adjust the value numeric options of the series.

            //series1.Label.TextPattern = "{VP:P0}";

            PieChart3D.Legend.Visible = true; //设置 右边 标注框是否显示

            PieChart3D.Legend.TextVisible = true; //设置标注框是否显示 每项目的数值

            // Adjust the view-type-specific options of the series.

            ((Pie3DSeriesView)series1.View).Depth = ;//设置饼的厚度

            ((Pie3DSeriesView)series1.View).ExplodedPoints.Add(series1.Points[]); //选中一个需要突出的项目

            ((Pie3DSeriesView)series1.View).ExplodedDistancePercentage = ;//将其中一个项目(SeriesPoint)推出来的距离

            // Access the diagram's options.

            ((SimpleDiagram3D)PieChart3D.Diagram).RotationType = RotationType.UseAngles;

            ((SimpleDiagram3D)PieChart3D.Diagram).RotationAngleX = -;//设置平面的倾斜度

            // Add a title to the chart and hide the legend.

            ChartTitle chartTitle1 = new ChartTitle();

            chartTitle1.Text = "3D Pie Chart";//设置标题

            PieChart3D.Titles.Add(chartTitle1);//添加标题

            //PieChart3D.Legend.Visibility = DevExpress.Utils.DefaultBoolean.False;

            // Add the chart to the form.

            PieChart3D.Dock = DockStyle.Fill;

            this.Controls.Add(PieChart3D);

        }

    }
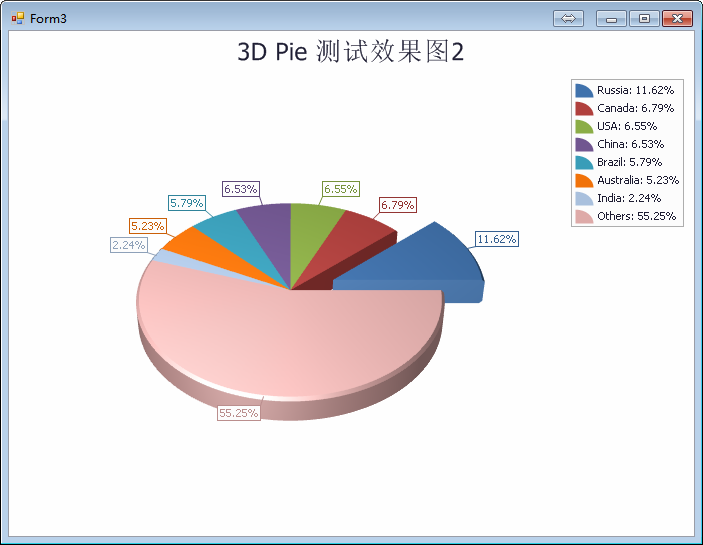
效果图二、
    public partial class Form3 : Form

    {

        public Form3()

        {

            InitializeComponent();

        }

        private void Form3_Load(object sender, EventArgs e)

        {

            // Create an empty chart.

            ChartControl PieChart3D = new ChartControl();

            // Create a pie series.

            Series series1 = new Series("Pie Series 1", ViewType.Pie3D);

            // Populate the series with points.

            series1.Points.Add(new SeriesPoint("Russia", 17.0752));

            series1.Points.Add(new SeriesPoint("Canada", 9.98467));

            series1.Points.Add(new SeriesPoint("USA", 9.63142));

            series1.Points.Add(new SeriesPoint("China", 9.59696));

            series1.Points.Add(new SeriesPoint("Brazil", 8.511965));

            series1.Points.Add(new SeriesPoint("Australia", 7.68685));

            series1.Points.Add(new SeriesPoint("India", 3.28759));

            series1.Points.Add(new SeriesPoint("Others", 81.2));

            //DataTable dt = new DataTable();

            //dt.Columns.Add("X轴", Type.GetType("System.String"));

            //dt.Columns.Add("线①", Type.GetType("System.Int32"));

            //dt.Columns.Add("线②", Type.GetType("System.Int32"));

            //dt.Columns.Add("线③", Type.GetType("System.Int32"));

            //dt.Columns.Add("线④", Type.GetType("System.Int32"));

            //for (int i = 0; i < 10; i++)

            //{

            //    Random rd = new Random();

            //    DataRow dr = dt.NewRow();

            //    dr["X轴"] = ("类别" + i.ToString());

            //    dr["线①"] = rd.Next(i * 10, (i + 1) * 10); ;

            //    dr["线②"] = rd.Next(i * 10, (i + 1) * 10);

            //    dr["线③"] = rd.Next(i * 10, (i + 1) * 10);

            //    dr["线④"] = rd.Next(i * 10, (i + 1) * 10);

            //    dt.Rows.Add(dr);

            //}

            //series1.DataSource = dt;

            //series1.ArgumentDataMember = "X轴"; //设置公共的X轴值(刻度)

            //series1.ValueScaleType = ScaleType.Numerical;

            ////设置 单个Series2 Y轴的(值)

            //series1.ValueDataMembers.AddRange(new string[] { "线①" });

            // Add the series to the chart.

            PieChart3D.Series.Add(series1);

            series1.LegendPointOptions.PointView = PointView.ArgumentAndValues;//格式:【类别:百分比】

            //series1.LegendPointOptions.PointView = PointView.Argument;//格式:【类别】

            //series1.LegendPointOptions.PointView = PointView.Values;//格式:【百分比】

            //series1.LegendPointOptions.PointView = PointView.SeriesName;//显示series1的Name

            //series1.LegendPointOptions.PointView = PointView.Undefined;//显示效果:【百分比】

            // Adjust the value numeric options of the series.

            //series1.Label.TextPattern = "{VP:P0}";

            PieChart3D.Legend.Visible = true; //设置 右边 标注框是否显示

            PieChart3D.Legend.TextVisible = true; //设置标注框是否显示 每项目的数值

            // Adjust the view-type-specific options of the series.

            ((Pie3DSeriesView)series1.View).Depth = ;//设置饼的厚度

            ((Pie3DSeriesView)series1.View).ExplodedPoints.Add(series1.Points[]); //选中一个需要突出的项目

            ((Pie3DSeriesView)series1.View).ExplodedDistancePercentage = ;//将其中一个项目(SeriesPoint)推出来的距离

            // Access the diagram's options.

            ((SimpleDiagram3D)PieChart3D.Diagram).RotationType = RotationType.UseAngles;

            ((SimpleDiagram3D)PieChart3D.Diagram).RotationAngleX = -;//设置平面的倾斜度

            // Add a title to the chart and hide the legend.

            ChartTitle chartTitle1 = new ChartTitle();

            chartTitle1.Text = "3D Pie 测试效果图2";//设置标题

            PieChart3D.Titles.Add(chartTitle1);//添加标题

            //PieChart3D.Legend.Visibility = DevExpress.Utils.DefaultBoolean.False;

            // Add the chart to the form.

            PieChart3D.Dock = DockStyle.Fill;

            this.Controls.Add(PieChart3D);

        }

    }
ChartControl ViewType.Pie3D 用法测试的更多相关文章
- chartControl ViewType.Bar 用法测试
使用方法 一. Datatable : chartControl1.Series.Clear(); DataTable dt = new DataTable(); dt.Columns.Add(&qu ...
- php set_time_limit()用法测试详解
在php中set_time_limit函数是用来限制页面执行时间的,如我想把一个php页面的执行时间定义为5秒就可以set_time_limit(5)了. 一个php脚本通过crontab每5分钟 ...
- DevExpress ChartControl ViewType.Line
源码地址:https://files.cnblogs.com/files/lanyubaicl/ChartControl.Line.7z public partial class Form1 : Fo ...
- DevExpress中ChartControl柱状图(Bar)用法
我的数据 代码如下: 1 2 3 4 5 6 7 8 9 10 11 12 13 14 15 16 17 18 19 20 21 22 23 chartControl1.Series.Clear(); ...
- telnet用法 测试端口号
Telnet是进行远程登录的标准协议和主要方式它为用户提供了在本地计算机上完成远程主机工作的能力.可以用telnet命令来测试端口号是否正常打开还是关闭状态. 工具/原料 电脑 cmd命令 方法/步骤 ...
- python 用法测试
Python 3.5.6 1.js风格的回调测试 def b(): ') def a(fn): if callable(fn): fn() a(b) class Sample: def q(self) ...
- chartControl 饼状图小Demo
Short Description The Pie Chart is represented by the Pie3DSeriesView object, which belongs to P ...
- 关于jQuery.when()用法
1.该方法在jQuery1.5开始被引入. 2.用法测试 a. var url1 = "/resource/ar/hometab/index_tab_games.json", ur ...
- Java 枚举(enum) 详解7种常见的用法
Java 枚举(enum) 详解7种常见的用法 来源 https://blog.csdn.net/qq_27093465/article/details/52180865 JDK1.5引入了新的类型— ...
随机推荐
- 第86节:Java中的JQuery基础
第86节:Java中的JQuery 前言复习 定时器: setInterval clearInterval setTimeout clearTimeout 显示: img.style.display ...
- Shell中for循环的几个常用写法
第一类:数字性循环-----------------------------for1-1.sh #!/bin/bash ;i<=;i++)); do echo $(expr $i \* + ); ...
- Scala - 快速学习03 - 基础语法
1- 变量 变量 mutable variable 在程序运行过程中其值可能发生改变的量 关键词var定义变量,定义时直接进行求值 常量 immutable variable 在程序运行过程中其值不会 ...
- compose函数
compose函数 在学习redux源码的时候看到了其中的工具函数compose,compose函数的作用就是组合函数,依次组合传入的函数: 后一个函数作为前一个函数的参数 最后一个函数可以接受多个参 ...
- mysql 开发进阶篇系列 5 SQL 优化(表优化)
一. 使用sql提示 sql 提示(sql hint)是优化数据库的一个重要手段, 是在sql语句中加入一些人为的提示来达到优化操作的目的. 1.1 use index 在查询语句中表名的后面,添加u ...
- [Charles]SSLHandshake: Received fatal alert: certificate_unknown
---------------------- 转载请注明出处 http://www.cnblogs.com/dzblog/p/8119712.html --------------------- 今天 ...
- Android主线程的消息系统(Handler\Looper)
前言: 之前的文章写的都是关于Bitmap和内存的优化技术,这一篇文章给大家谈谈Handler. Handler是Android系统中比较重要的一个知识,在Android多线程面试经常会被问到,在实际 ...
- Java Socket NIO详解(转)
java选择器(Selector)是用来干嘛的? 2009-01-12 22:21jsptdut | 分类:JAVA相关 | 浏览8901次 如题,不要贴api的,上面的写的我看不懂希望大家能给我个通 ...
- Windows2008/2012/2016多用户同时远程连接终端服务授权
win2016多用户登录: 添加角色“远程桌面服务”,子角色“远程桌面会话主机”和“远程桌面授权”,重启 远程桌面授权,激活服务器,企业协议,协议号6565792,授权模式“每用户” 本地策略管理器g ...
- ftp服务器搭建及简单操作
ftp服务器搭建及简单操作 1. 添加一个新用户,使用名useradd testftp,然后使用passwd testftp对新添加的用户设置密码(这里设置为“1234567”). 2. 安装ftp服 ...