
pandas知识点汇总
pandas基础知识汇总
1.时间序列
import pandas as pd

import numpy as np

import matplotlib.pyplot as plt
from datetime import datetime
now=datetime.now()

now
datetime.datetime(2018, 11, 18, 16, 44, 4, 405600)
print(now.strftime('%Y-%m-%d'))

print(datetime.strptime('7/6/2018','%m/%d/%Y'))

print(now.strftime('%X'))
2018-11-18

2018-07-06 00:00:00

16:44:04
dates=pd.date_range('11/1/2018',periods=50,freq='W-WED')

long_df=pd.DataFrame(np.random.randn(50,4),index=dates,columns=list('ABCD'))

long_df.head(10)
.dataframe tbody tr th:only-of-type {
vertical-align: middle;
}
.dataframe tbody tr th {

    vertical-align: top;

}

.dataframe thead th {

    text-align: right;

}
| A | B | C | D | |
|---|---|---|---|---|
| 2018-11-07 | 0.215536 | 0.855986 | 0.737170 | -0.440150 |
| 2018-11-14 | -0.477099 | 0.467430 | -0.107105 | 0.941922 |
| 2018-11-21 | 0.052926 | -0.671084 | 0.219058 | -0.350776 |
| 2018-11-28 | -1.449668 | 0.003958 | 1.065875 | -0.277673 |
| 2018-12-05 | 1.371631 | 0.542839 | 0.071466 | 0.609508 |
| 2018-12-12 | 0.322176 | 1.335534 | -0.423240 | -0.111549 |
| 2018-12-19 | -0.564089 | 0.262918 | 0.477552 | 0.018652 |
| 2018-12-26 | -0.490212 | 0.382492 | -0.858712 | -0.920786 |
| 2019-01-02 | 1.630409 | -0.740542 | 1.296362 | 0.376437 |
| 2019-01-09 | 1.460070 | -0.449293 | -0.783725 | -1.098911 |
resample=long_df.resample('M').mean()

resample
.dataframe tbody tr th:only-of-type {
vertical-align: middle;
}
.dataframe tbody tr th {

    vertical-align: top;

}

.dataframe thead th {

    text-align: right;

}
| A | B | C | D | |
|---|---|---|---|---|
| 2018-11-30 | -0.414576 | 0.164073 | 0.478750 | -0.031669 |
| 2018-12-31 | 0.159876 | 0.630946 | -0.183234 | -0.101044 |
| 2019-01-31 | 0.092189 | -0.225606 | 0.251072 | -0.456075 |
| 2019-02-28 | -0.124615 | -0.467522 | -0.142258 | 0.195602 |
| 2019-03-31 | -0.294693 | -0.014264 | 0.725285 | 1.291576 |
| 2019-04-30 | 0.182648 | 0.231022 | -0.458572 | 0.294329 |
| 2019-05-31 | 0.317648 | 0.060677 | 0.297406 | -0.035691 |
| 2019-06-30 | 0.407404 | -0.198072 | -0.461785 | 1.074969 |
| 2019-07-31 | -0.245908 | 0.150161 | 0.526564 | -0.082258 |
| 2019-08-31 | 0.046819 | -0.227364 | -0.684359 | 0.033979 |
| 2019-09-30 | -0.834454 | 1.186670 | 0.653583 | -0.306585 |
| 2019-10-31 | -0.436990 | -0.460347 | 0.040175 | 0.681903 |
pd.date_range('11/18/2018',periods=10,freq='2h30min')
DatetimeIndex(['2018-11-18 00:00:00', '2018-11-18 02:30:00',

               '2018-11-18 05:00:00', '2018-11-18 07:30:00',

               '2018-11-18 10:00:00', '2018-11-18 12:30:00',

               '2018-11-18 15:00:00', '2018-11-18 17:30:00',

               '2018-11-18 20:00:00', '2018-11-18 22:30:00'],

              dtype='datetime64[ns]', freq='150T')
type(resample)
pandas.core.resample.DatetimeIndexResampler
ts=pd.Series(np.arange(10),index=pd.date_range('11/18/2018',periods=10,freq='T'))

ts
2018-11-18 00:00:00    0

2018-11-18 00:01:00    1

2018-11-18 00:02:00    2

2018-11-18 00:03:00    3

2018-11-18 00:04:00    4

2018-11-18 00:05:00    5

2018-11-18 00:06:00    6

2018-11-18 00:07:00    7

2018-11-18 00:08:00    8

2018-11-18 00:09:00    9

Freq: T, dtype: int32
#pay attention to the parameter 'closed'

ts.resample('3min',closed='left',label='left').sum()
2018-11-18 00:00:00     3

2018-11-18 00:03:00    12

2018-11-18 00:06:00    21

2018-11-18 00:09:00     9

Freq: 3T, dtype: int32
ts.resample('3min').ohlc()
.dataframe tbody tr th:only-of-type {
vertical-align: middle;
}
.dataframe tbody tr th {

    vertical-align: top;

}

.dataframe thead th {

    text-align: right;

}
| open | high | low | close | |
|---|---|---|---|---|
| 2018-11-18 00:00:00 | 0 | 2 | 0 | 2 |
| 2018-11-18 00:03:00 | 3 | 5 | 3 | 5 |
| 2018-11-18 00:06:00 | 6 | 8 | 6 | 8 |
| 2018-11-18 00:09:00 | 9 | 9 | 9 | 9 |
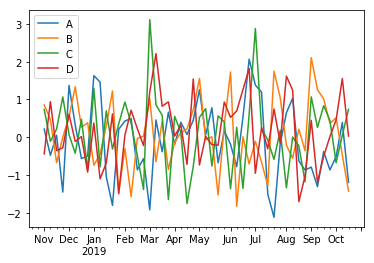
long_df.plot()
## 滑窗函数

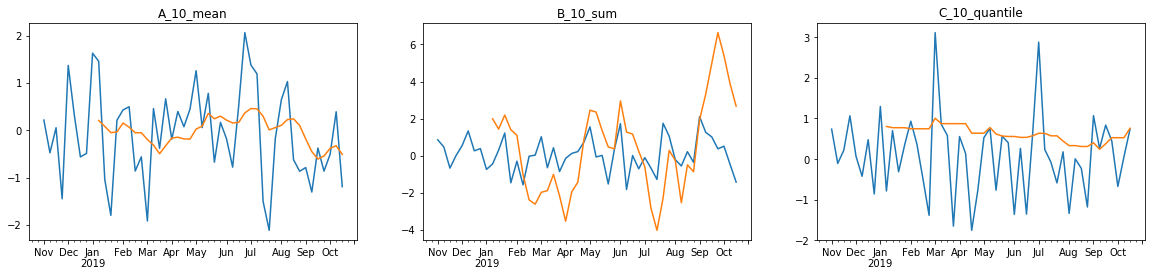
fig,axes=plt.subplots(1,3,figsize=(20,4))

long_df['A'].plot(ax=axes[0])

long_df['A'].rolling(window=10).mean().plot(ax=axes[0],title='A_10_mean')

long_df['B'].plot(ax=axes[1])

long_df['B'].rolling(window=10).sum().plot(ax=axes[1],title='B_10_sum')

long_df['C'].plot(ax=axes[2])

long_df['C'].rolling(window=10).quantile(quantile=0.8).plot(ax=axes[2],title='C_10_quantile')
#corr

from pylab import mpl

mpl.rcParams['font.sans-serif'] = ['SimHei'] # 指定默认字体

mpl.rcParams['axes.unicode_minus'] = False # 解决保存图像是负号'-'显示为方块的问题

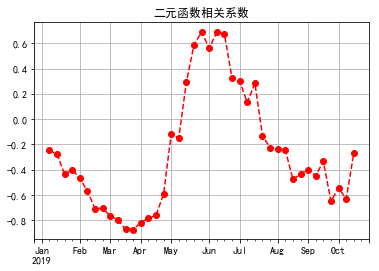
long_df['B'].rolling(window=10).corr(long_df['A']).plot(style='ro--',grid=True,title='二元函数相关系数')
2.matplotlib绘图
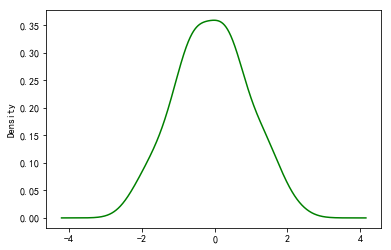
long_df['A'].plot(kind='kde',style='g')
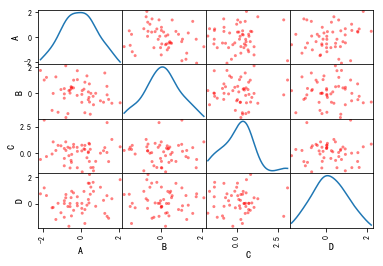
pd.plotting.scatter_matrix(long_df,diagonal='kde',color='r')
df=pd.DataFrame(np.random.randn(6,4),index='one two three four five six'.split(' '),columns=list('ABCD'))

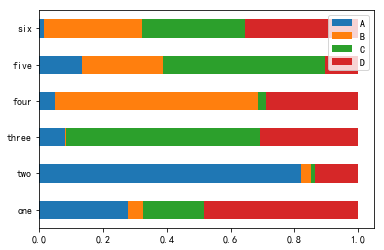
df_normal=abs(df).div(abs(df).sum(1),axis=0)

df_normal.plot(kind='barh',stacked=True)

abs(df).sum(1)
one      3.989060

two      1.160160

three    2.087209

four     2.680116

five     4.452365

six      2.298789

dtype: float64
pandas知识点汇总的更多相关文章
- 机器学习-Pandas 知识点汇总(吐血整理)
Pandas是一款适用很广的数据处理的组件,如果将来从事机械学习或者数据分析方面的工作,咱们估计70%的时间都是在跟这个框架打交道.那大家可能就有疑问了,心想这个破玩意儿值得花70%的时间吗?咱不是还 ...
- pandas知识点脑图汇总
参考文献: [1]Pandas知识点脑图汇总
- Python数据分析--Pandas知识点(三)
本文主要是总结学习pandas过程中用到的函数和方法, 在此记录, 防止遗忘. Python数据分析--Pandas知识点(一) Python数据分析--Pandas知识点(二) 下面将是在知识点一, ...
- nginx几个知识点汇总
WHY? 为什么用Nginx而不用LVS? 7点理由足以说明一切:1 .高并发连接: 官方测试能够支撑 5 万并发连接,在实际生产环境中跑到 2 - 3 万并发连接数.?2 .内存消耗少: 在 3 万 ...
- python全栈开发 * 10知识点汇总 * 180612
10 函数进阶 知识点汇总 一.动态参数 形参的第三种1.动态接收位置传参 表达:*args (在参数位置编写 * 表⽰接收任意内容) (1)动态位置参数def eat(*args): print(a ...
- Python数据分析--Pandas知识点(二)
本文主要是总结学习pandas过程中用到的函数和方法, 在此记录, 防止遗忘. Python数据分析--Pandas知识点(一) 下面将是在知识点一的基础上继续总结. 13. 简单计算 新建一个数据表 ...
- 清华大学OS操作系统实验lab1练习知识点汇总
lab1知识点汇总 还是有很多问题,但是我觉得我需要在查看更多资料后回来再理解,学这个也学了一周了,看了大量的资料...还是它们自己的80386手册和lab的指导手册觉得最准确,现在我就把这部分知识做 ...
- c++ 函数知识点汇总
c++ 函数知识点汇总 swap函数 交换两个数组元素 比如 swap(a[i],a[j]); 就是交换a[i] 和 a[j] 的值 strcpy() 复制一个数组元素的值到另一个数组元素里 strc ...
- 前端开发 JavaScript 干货知识点汇总
很多初学的朋友经常问我,前端JavaScript都需要学习哪些东西呀?哪些是JavaScript的重点知识啊? 其实做前端开发工程师,所有的知识点都是我们学习必备的东西,只有扎实的技术基础才是高薪的关 ...
随机推荐
- 【模拟】【set】hdu 4789 ICPC Ranking
写了一晚上,TLE到死,我选择GG 喵的好像还是前几年我校出的题,这整场都……tm…… 改日在战 /*TLE代码*/ #include<cstdio> #include<vector ...
- (原创)Stanford Machine Learning (by Andrew NG) --- (week 6) Advice for Applying Machine Learning & Machine Learning System Design
(1) Advice for applying machine learning Deciding what to try next 现在我们已学习了线性回归.逻辑回归.神经网络等机器学习算法,接下来 ...
- JDK源码学习笔记——Integer
一.类定义 public final class Integer extends Number implements Comparable<Integer> 二.属性 private fi ...
- Java NIO入门小例(短连接:客户端和服务器一问一答)
例子中有些写法参考自Netty4源码,建议在实际运用中采用Netty,而非原生的Java NIO(小心epoll空转). 1. 服务器端 public class NioServer { static ...
- Word中将图表变为表格
一定要先拷贝了图表,否则第二张图片没那个像是,只有最后一个,这样的做的目的是减少查重. 还有就是把部分文字放入Mathtype,查不出来.
- 使用XML向SQL Server 2005批量写入数据——一次有关XML时间格式的折腾经历
使用XML向SQL Server 2005批量写入数据——一次有关XML时间格式的折腾经历 原文:使用XML向SQL Server 2005批量写入数据——一次有关XML时间格式的折腾经历 常常遇 ...
- SIP消息类型和消息格式
转自:http://blog.chinaunix.net/uid-1797566-id-2840904.html sip消息类型和消息格式 SIP是一个基于文本的协议,使用的是UTF-8字符集. SI ...
- JS isNaN()函数
1.作用 isNaN() 函数用于检查其参数是否是非数字值. 2.JS <script> document.write(isNaN(123)); document.write(isNaN( ...
- third-maximum-number
https://leetcode.com/problems/third-maximum-number/ // 开始我以为相同的也占一位,比如5,3,3,2,得出3,但是答案是需要2 public cl ...
- unity linear work flow
看了下unity linear space的工作流 srgb read tex deferred gbuffer01 srgb rt float rt----pps float rt 最后 blit ...