python 绘制词云图
1. 先下载并安装nltk包,准备一张简单的图片存入代码所在文件目录,搜集英文停用词表
import nltk

nltk.download()
2. 绘制词云图
import re
import numpy as np
import pandas as pd
#import matplotlib
import matplotlib.pyplot as plt
from nltk.tokenize import word_tokenize, sent_tokenize
from nltk.corpus import stopwords
from PIL import Image
from wordcloud import WordCloud
from sklearn.datasets import fetch_20newsgroups
#from sklearn.feature_extraction.text import CountVectorizer
from collections import Counter, defaultdict def word_cut(contents, cut=','):
res = []
for content in contents:
content = content.lower()
words = [word for word in re.split(cut, content) if word]
res.append(words)
return res def word_count(contents):
#words_count = Counter(sum(contents,[])) #慢
word_count_dict = defaultdict(lambda: 0)
for content in contents:
temp_dict = Counter(content)
for key in temp_dict:
word_count_dict[key] += temp_dict[key]
return word_count_dict def stopwords_filter(contents, stopwords):
contents_clean = []
word_count_dict = defaultdict(lambda: 0)
for line in contents:
line_clean = []
for word in line:
if word in stopwords:
continue
line_clean.append(word)
word_count_dict[word] += 1
contents_clean.append(line_clean) words_count = list(word_count_dict.items())
words_count.sort(key=lambda x:-x[1])
words_count = pd.DataFrame(words_count, columns=['word', 'count'])
return contents_clean, words_count # 从外部导入数据
'''
df_news = pd.read_table('val.txt', names=['category','theme','URL','content'], encoding='utf-8')
stopwords = pd.read_csv("stopwords.txt", index_col = False, sep="\t",
quoting=3, names=['stopword'], encoding='utf-8')
contents = df_news.content.values.tolist()
stopwords = stopwords.stopword.values.tolist()''' # 自定义切词
'''
#[ ,.\n\t--\':;?!/+<>@]
#[ ,.\n\t=--\'`_\[\]:;?!^/|+<>{}@~\\]
#contents = word_cut(contents=news.data, cut='[ ,.\n\t-\`_\[\]:;?!\^/|+<>{}@~]')
'''
# 将数据整理为模型入参形式
'''
#vec = CountVectorizer()
#X_train = vec.fit_transform(X_train) #不可直接将vec用在测试集上
#vectorizer_test = CountVectorizer(vocabulary=vec.vocabulary_)
#X_test = vectorizer_test.transform(X_test)
''' # 可从中筛选停用词
'''
word_count_dict = word_count(contents)
temp = list(word_count_dict.items())
temp.sort(key=lambda x:-x[1])
df = pd.DataFrame(temp, columns=['word','count'])
df.to_csv(r'D:\PycharmProjects\zsyb\stop_words.csv')
''' # 调包实现上述功能
news = fetch_20newsgroups(subset='all')
# 自定义的快好几倍,可以加if not in ‘’去标点
contents = [word_tokenize(content.lower()) for content in news.data] #sent_tokenize(content)
punctuations = set(list(',.\n\t-\`_()\[\]:;?!$#%&.*=\^/|+<>{}@~')) #标点
digits = {str(i) for i in range(50)}
others = {'--', "''", '``', "'", '...'}
# 下载网上的停用词表加入 nltk_data\corpora\stopwords,低频词过滤(不要加入停用词)
stopWords = set(stopwords.words('english')) | punctuations | digits | others
contents_clean, words_count = stopwords_filter(contents, stopWords)
#df.groupby(by=['word']).agg({"count": np.size}) # 绘制词云图
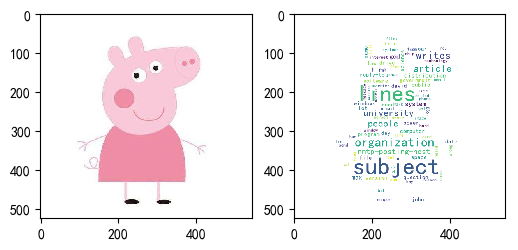
fontpath = 'simhei.ttf'
aimask = np.array(Image.open(r"D:\PycharmProjects\zsyb\pig.png")) wc = WordCloud(font_path = fontpath, #设置字体
background_color = "white", #背景颜色
max_words = 1000, #词云显示的最大词数
max_font_size = 100, #字体最大值
min_font_size = 10, #字体最小值
random_state = 42, #随机数
collocations = False, #避免重复单词
mask = aimask, #造型遮盖
width = 1200, height = 800, #图像宽高,需配合plt.figure(dpi=xx)放缩才有效
margin = 2 #字间距
)
word_frequence = {x[0]:x[1] for x in words_count.head(100).values}
word_cloud=wc.fit_words(word_frequence) plt.figure(dpi=100) #通过这里可以放大或缩小
plt.subplot(121)
plt.imshow(aimask)
#plt.axis("off") #隐藏坐标
plt.subplot(122)
plt.imshow(word_cloud)
#plt.axis("off") #隐藏坐标
python 绘制词云图的更多相关文章
- Python pyecharts绘制词云图
一.pyecharts绘制词云图WordCloud.add()方法简介 WordCloud.add()方法简介 add(name,attr,value, shape="circle" ...
- python爬虫+词云图,爬取网易云音乐评论
又到了清明时节,用python爬取了网易云音乐<清明雨上>的评论,统计词频和绘制词云图,记录过程中遇到一些问题 爬取网易云音乐的评论 一开始是按照常规思路,分析网页ajax的传参情况.看到 ...
- 使用python绘制词云
最近在忙考试的事情,没什么时间敲代码,一个月也没几天看代码,最近看到可视化的词云,看到网上也很多这样的工具, 但是都不怎么完美,有些不支持中文,有的中文词频统计得莫名其妙.有的不支持自定义形状.所有的 ...
- 使用pyecharts绘制词云图-淘宝商品评论展示
一.什么是词云图? 词云图是一种用来展现高频关键词的可视化表达,通过文字.色彩.图形的搭配,产生有冲击力地视觉效果,而且能够传达有价值的信息. 制作词云图的网站有很多,简单方便,适合小批量操作. BI ...
- python 数据分析--词云图,图形可视化美国竞选辩论
这篇博客从用python实现分析数据的一个完整过程.以下着重几个python的moudle的运用"pandas",""wordcloud"," ...
- python 可视化 词云图
文本挖掘及可视化知识链接 我的代码: # -*- coding: utf-8 -*- from pandas import read_csv import numpy as np from sklea ...
- python 做词云图
#导入需要模块 import jieba import numpy as np import matplotlib.pyplot as plt from PIL import Image from w ...
- Python 绘制词云
文本内容:data(包含很多条文本) 1.分词: import jieba data_cut = data.apply(jieba.lcut) 2.去除停用词: stoplist.txt:链接:htt ...
- 吃瓜的正确姿势,Python绘制罗志祥词云图
前言 文的文字及图片来源于网络,仅供学习.交流使用,不具有任何商业用途,版权归原作者所有,如有问题请及时联系我们以作处理. 这篇文章中向大家介绍了Python绘制词云的方法,不难看出绘制词云可以说是一 ...
随机推荐
- s3c2440裸机-时钟编程(二、配置时钟寄存器)
s3c2440裸机编程-时钟编程(二.配置时钟寄存器) 1.2440时钟时序 下图是2440时钟配置时序: 1.上电后,nRESET复位信号拉低,此时cpu还无法取指令工作. 2.nRESET复位信号 ...
- xampp配置二级域名通过不同端口访问不同网站
首先需要在xampp\apache\conf\extra\httpd-vhost.conf中写入配置的二级域名 <VirtualHost *:8081> // 该网站通过监测8081端口 ...
- git 代码管理
- 【2019.8.15 慈溪模拟赛 T2】组合数(binom)(卢卡斯定理+高维前缀和)
卢卡斯定理 题目中说到\(p\)是质数. 而此时要求组合数向质数取模的结果,就可以用卢卡斯定理: \[C_x^y=C_{x\ div\ p}^{y\ div\ p}\cdot C_{x\ mod\ p ...
- git分支合并创建切换
1. 场景描述 介绍下Git最新内容合并到主干.从主干创建最新分支.idea下切换最新分支,能在2分钟内完成git合并.分支创建以及在idea中完成切换,希望能帮到一些朋友. 2. 解决方案 从以下三 ...
- IT兄弟连 HTML5教程 HTML5的曲折发展过程 HTML5的诞生
十年磨一剑,正如我们所看到的一样,HTML5大潮正来势汹汹.但也正如我们所知道的一样,HTML5是一种技术标准,它的语义之美.人性之美.简单之美.实用之美……如同一场革命,它的主要应用场景是浏览器,不 ...
- 洛谷 P2602(数位DP)
### 洛谷 P2602 题目链接 ### 题目大意:给你一个区间,问你区间所有数字中,0.1.2 .... 9 的个数的总和分别为多少. 分析: 枚举 0 ~ 9 进行数位 DP 即可. 注意记忆化 ...
- HTML5新特性——自定义滑动条(input[type="range"])
HTML 4.01 与 HTML5之间的差异 以下 input 的 type属性值是 HTML5 中新增的: color.date.datetime.datetime-local.month.week ...
- Kafka生产消费API JAVA实现
Maven依赖: <dependency> <groupId>org.apache.kafka</groupId> <artifactId>kafka- ...
- Ubuntu桌面版安装小记
之前一直是用Ubuntu的桌面版装docker,桌面版本身用起来比较方便,但开销较大,如果建立多个虚拟机就比较费劲了.今天试了一下server版的Ubuntu,发现还是比较方便的,相比桌面版,有如下好 ...