Prometheus监控Canal
Prometheus监控Canal
一、背景
简单记录下,使用Prometheus对Canal进行监控。
二、实现步骤
1、修改prometheus.yml配置文件
vim /Users/huan/soft/prometheus/prometheus-2.25.0/prometheus.yml
scrape_configs:

  - job_name: 'canal'

    scrape_interval: 30s

    static_configs:

    - targets: ['localhost:11112'] # 端口配置即为canal.properties中的canal.metrics.pull.port

      labels:

        nodename: 'canal'
# 检测刚刚编写的 prometheus.yml 语法是否错误

./promtool check config prometheus.yml
2、启动prometheus
nohup /Users/huan/soft/prometheus/prometheus-2.25.0/prometheus \

--config.file="/Users/huan/soft/prometheus/prometheus-2.25.0/prometheus.yml" \

--web.listen-address="0.0.0.0:9080" \

--web.enable-lifecycle \

--storage.tsdb.retention.time="3d" \

--log.level=debug \

> logs/prometheus.out 2>&1 &
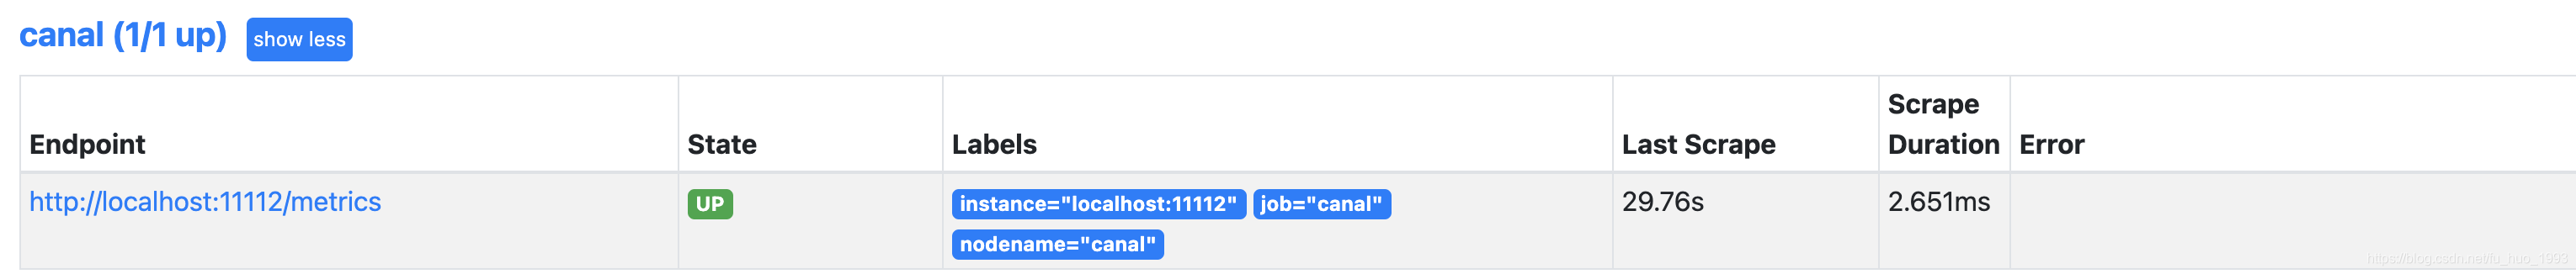
3、查看prometheus是否成功接入canal
4、canal原始指标解释
| 指标 | 说明 | 单位 | 精度 |
|---|---|---|---|
| canal_instance_transactions | instance接收transactions计数 | - | - |
| canal_instance | instance基本信息 | - | - |
| canal_instance_subscriptions | instance订阅数量 | - | - |
| canal_instance_publish_blocking_time | instance dump线程提交到异步解析队列过程中的阻塞时间(仅parallel解析模式) | ms | ns |
| canal_instance_received_binlog_bytes | instance接收binlog字节数 | byte | - |
| canal_instance_parser_mode | instance解析模式(是否开启parallel解析) | - | - |
| canal_instance_client_packets | instance client请求次数的计数 | - | - |
| canal_instance_client_bytes | 向instance client发送数据包字节计数 | byte | - |
| canal_instance_client_empty_batches | 向instance client发送get接口的空结果计数 | - | - |
| canal_instance_client_request_error | instance client请求失败计数 | - | - |
| canal_instance_client_request_latency | instance client请求的响应时间概况 | - | - |
| canal_instance_sink_blocking_time | instance sink线程put数据至store的阻塞时间 | ms | ns |
| canal_instance_store_produce_seq | instance store接收到的events sequence number | - | - |
| canal_instance_store_consume_seq | instance store成功消费的events sequence number | - | - |
| canal_instance_store | instance store基本信息 | - | - |
| canal_instance_store_produce_mem | instance store接收到的所有events占用内存总量 | byte | - |
| canal_instance_store_consume_mem | instance store成功消费的所有events占用内存总量 | byte | - |
| canal_instance_put_rows | store put操作完成的table rows | - | - |
| canal_instance_get_rows | client get请求返回的table rows | - | - |
| canal_instance_ack_rows | client ack操作释放的table rows | - | - |
| canal_instance_traffic_delay | server与MySQL master的延时 | ms | ms |
| canal_instance_put_delay | store put操作events的延时 | ms | ms |
| canal_instance_get_delay | client get请求返回events的延时 | ms | ms |
| canal_instance_ack_delay | client ack操作释放events的延时 | ms | ms |
5、导入fana图表
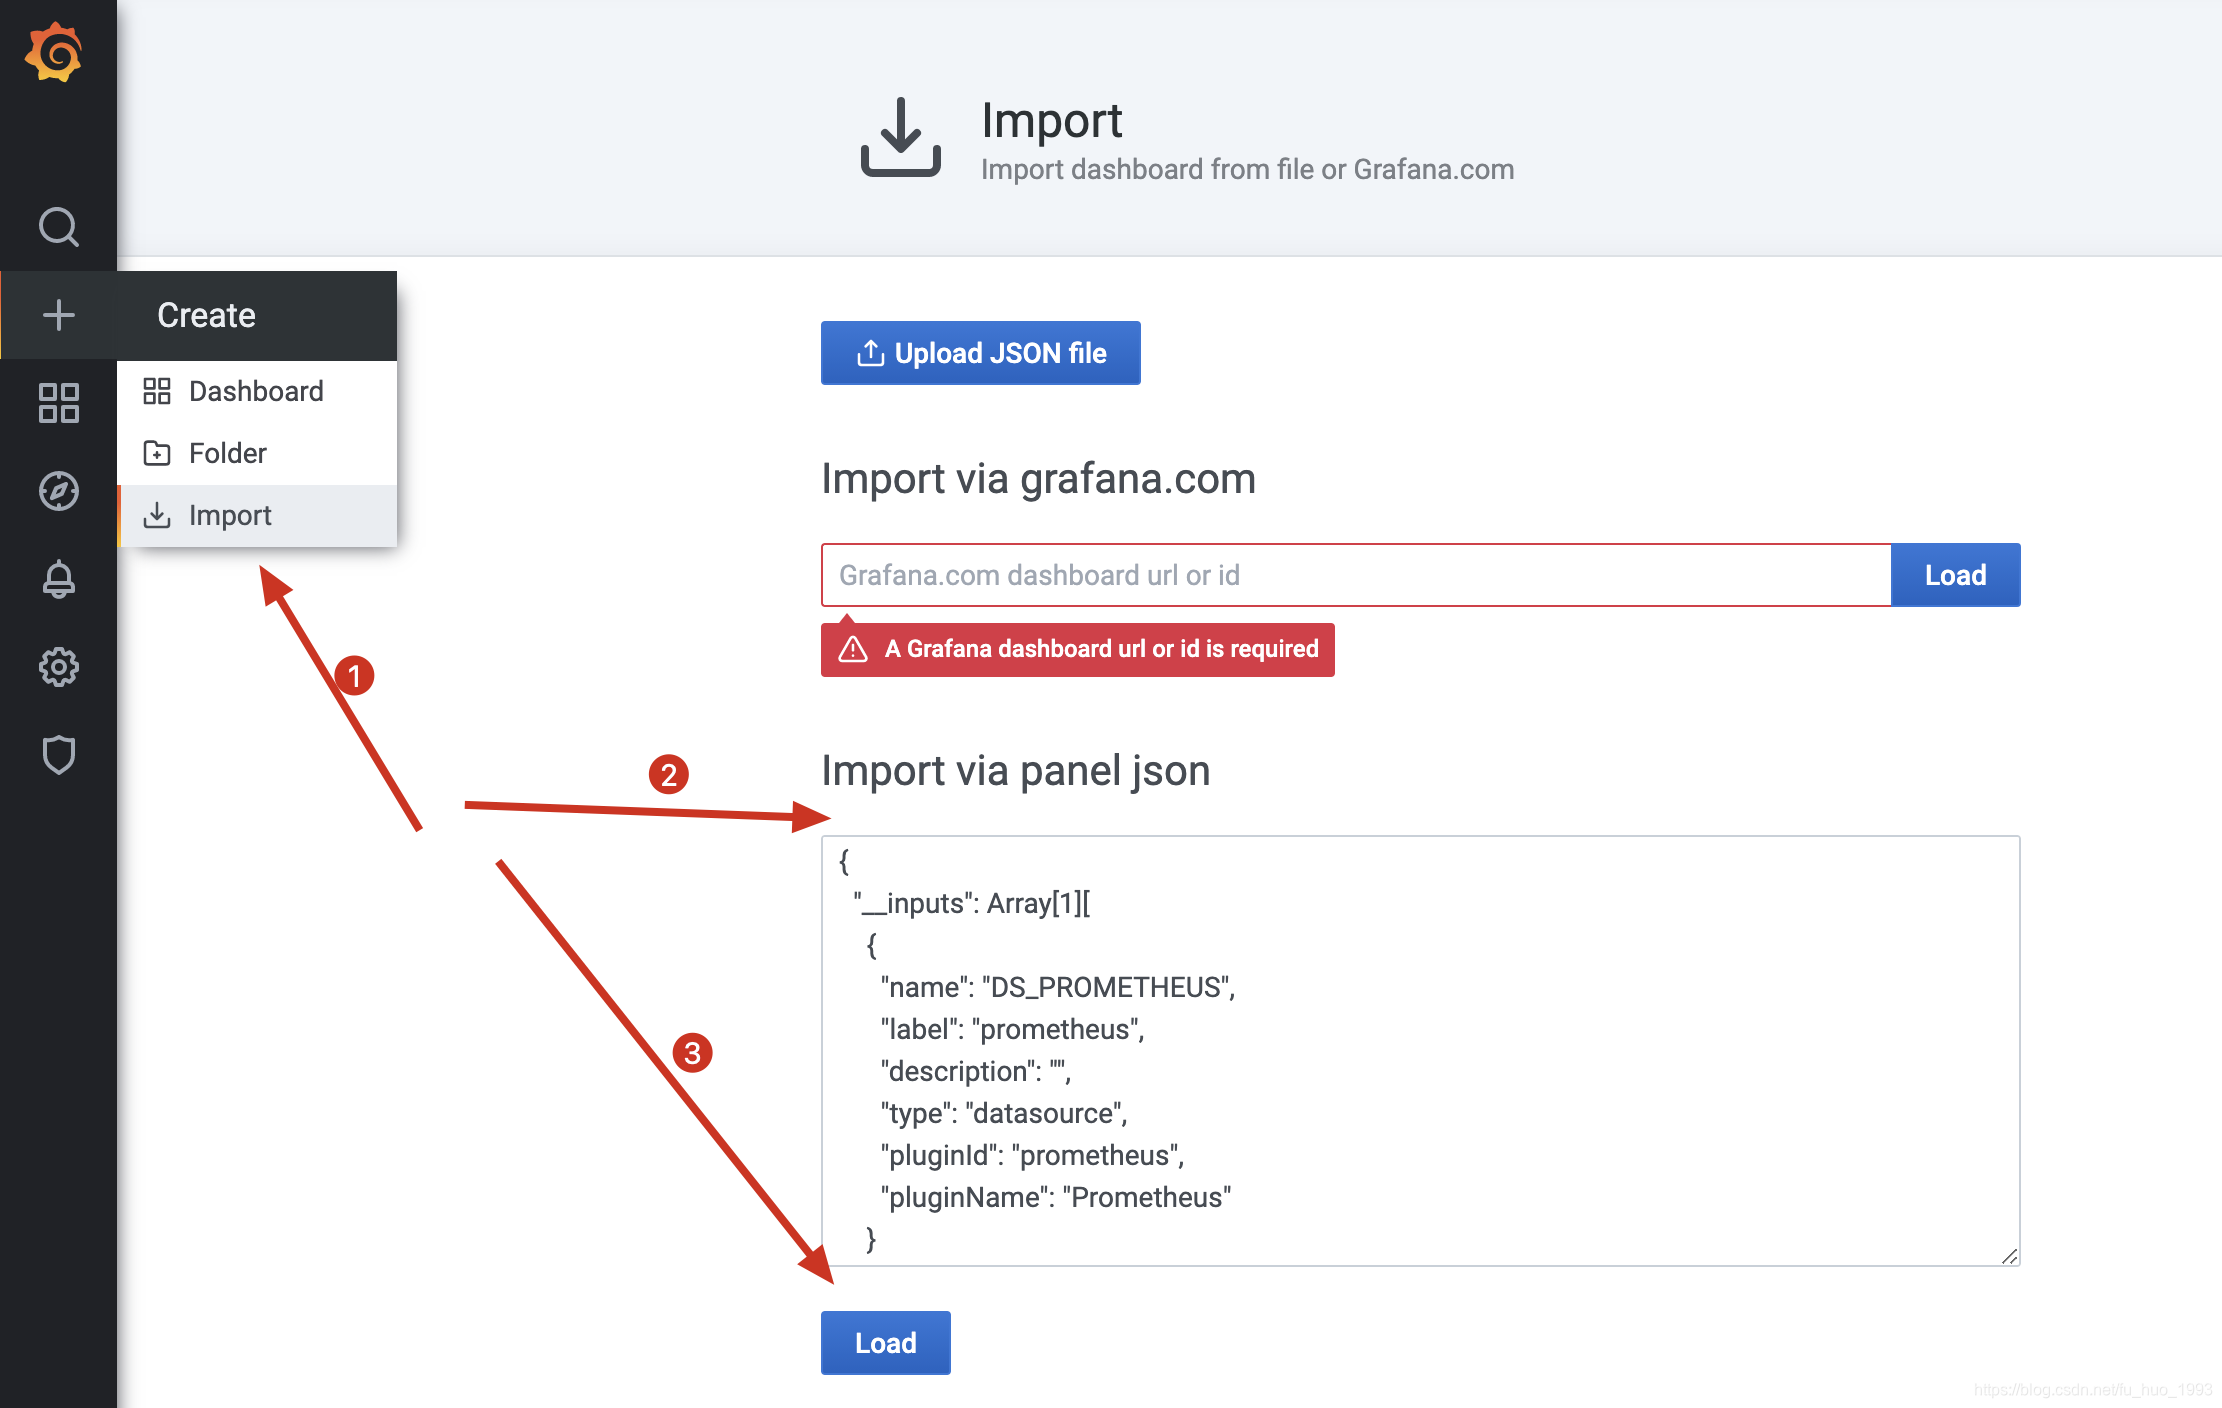
图表json数据
{
"__inputs": [
{
"name": "DS_PROMETHEUS",
"label": "prometheus",
"description": "",
"type": "datasource",
"pluginId": "prometheus",
"pluginName": "Prometheus"
}
],
"__requires": [
{
"type": "grafana",
"id": "grafana",
"name": "Grafana",
"version": "5.2.2"
},
{
"type": "panel",
"id": "graph",
"name": "Graph",
"version": "5.0.0"
},
{
"type": "datasource",
"id": "prometheus",
"name": "Prometheus",
"version": "5.0.0"
}
],
"annotations": {
"list": [
{
"builtIn": 1,
"datasource": "-- Grafana --",
"enable": true,
"hide": true,
"iconColor": "rgba(0, 211, 255, 1)",
"name": "Annotations & Alerts",
"type": "dashboard"
}
]
},
"editable": true,
"gnetId": null,
"graphTooltip": 0,
"id": null,
"iteration": 1536989235272,
"links": [],
"panels": [
{
"collapsed": false,
"gridPos": {
"h": 1,
"w": 24,
"x": 0,
"y": 0
},
"id": 30,
"panels": [],
"title": "Instance status",
"type": "row"
},
{
"aliasColors": {},
"bars": false,
"dashLength": 10,
"dashes": false,
"datasource": "$datasource",
"description": "Canal instance 基本信息。",
"fill": 1,
"gridPos": {
"h": 5,
"w": 6,
"x": 0,
"y": 1
},
"id": 24,
"legend": {
"alignAsTable": true,
"avg": false,
"current": false,
"hideEmpty": false,
"hideZero": false,
"max": false,
"min": false,
"rightSide": true,
"show": true,
"sideWidth": 500,
"total": false,
"values": false
},
"lines": true,
"linewidth": 1,
"links": [],
"nullPointMode": "null",
"percentage": false,
"pointradius": 5,
"points": false,
"renderer": "flot",
"repeat": null,
"seriesOverrides": [],
"spaceLength": 10,
"stack": false,
"steppedLine": false,
"targets": [
{
"expr": "canal_instance{destination=~\"$destination\"}",
"format": "time_series",
"instant": true,
"intervalFactor": 1,
"legendFormat": "Destination: {{destination}}",
"refId": "A"
},
{
"expr": "canal_instance_parser_mode{destination=~\"$destination\"}",
"format": "time_series",
"instant": true,
"intervalFactor": 1,
"legendFormat": "Parallel parser: {{parallel}}",
"refId": "B"
},
{
"expr": "canal_instance_store{destination=~\"$destination\"}",
"format": "time_series",
"instant": true,
"intervalFactor": 1,
"legendFormat": "Batch mode: {{batchMode}}",
"refId": "C"
},
{
"expr": "canal_instance_store{destination=~\"$destination\"}",
"format": "time_series",
"instant": true,
"intervalFactor": 1,
"legendFormat": "Buffer size: {{size}}",
"refId": "D"
}
],
"thresholds": [],
"timeFrom": null,
"timeShift": null,
"title": "Basic",
"tooltip": {
"shared": true,
"sort": 0,
"value_type": "individual"
},
"transparent": true,
"type": "graph",
"xaxis": {
"buckets": null,
"mode": "time",
"name": null,
"show": false,
"values": []
},
"yaxes": [
{
"format": "short",
"label": null,
"logBase": 1,
"max": null,
"min": null,
"show": false
},
{
"format": "short",
"label": null,
"logBase": 1,
"max": null,
"min": null,
"show": false
}
],
"yaxis": {
"align": false,
"alignLevel": null
}
},
{
"aliasColors": {
"inbound": "#bf1b00"
},
"bars": false,
"dashLength": 10,
"dashes": false,
"datasource": "$datasource",
"description": "Canal instance 网络带宽占用。\ninbound: 读取MySQL binlog.\noutbound: 对Client端传输格式化binlog.",
"fill": 1,
"gridPos": {
"h": 5,
"w": 6,
"x": 6,
"y": 1
},
"id": 6,
"legend": {
"avg": false,
"current": false,
"max": false,
"min": false,
"show": true,
"total": false,
"values": false
},
"lines": true,
"linewidth": 1,
"links": [],
"nullPointMode": "null",
"percentage": false,
"pointradius": 5,
"points": false,
"renderer": "flot",
"seriesOverrides": [],
"spaceLength": 10,
"stack": false,
"steppedLine": false,
"targets": [
{
"expr": "rate(canal_instance_received_binlog_bytes{destination=~\"$destination\", parser=\"0\"}[2m]) / 1024",
"format": "time_series",
"interval": "15s",
"intervalFactor": 2,
"legendFormat": "inbound",
"refId": "A"
},
{
"expr": "rate(canal_instance_client_bytes{destination=~\"$destination\"}[2m]) / 1024",
"format": "time_series",
"interval": "15s",
"intervalFactor": 2,
"legendFormat": "outbound",
"refId": "B"
},
{
"expr": "rate(canal_instance_received_binlog_bytes{destination=~\"$destination\", parser=\"1\"}[2m]) / 1024",
"format": "time_series",
"interval": "15s",
"intervalFactor": 2,
"legendFormat": "inbound-1",
"refId": "C"
},
{
"expr": "rate(canal_instance_received_binlog_bytes{destination=~\"$destination\", parser=\"2\"}[2m]) / 1024",
"format": "time_series",
"interval": "15s",
"intervalFactor": 2,
"legendFormat": "inbound-2",
"refId": "D"
}
],
"thresholds": [],
"timeFrom": null,
"timeShift": null,
"title": "Network bandwith",
"tooltip": {
"shared": true,
"sort": 0,
"value_type": "individual"
},
"type": "graph",
"xaxis": {
"buckets": null,
"mode": "time",
"name": null,
"show": true,
"values": []
},
"yaxes": [
{
"format": "KBs",
"label": null,
"logBase": 1,
"max": null,
"min": null,
"show": true
},
{
"format": "short",
"label": null,
"logBase": 1,
"max": null,
"min": null,
"show": true
}
],
"yaxis": {
"align": false,
"alignLevel": null
}
},
{
"aliasColors": {
"ack": "#f29191",
"get": "#cca300",
"put": "#1f78c1"
},
"bars": false,
"dashLength": 10,
"dashes": false,
"datasource": "$datasource",
"description": "master: Canal server相对于MySQL master的延时。通过master heartbeat机制能刷新idle状态下的延时。\nput: store put操作的时间点为基准。\nget: client get操作的时间点为基准。\nack: client ack操作的时间点为基准。",
"fill": 1,
"gridPos": {
"h": 5,
"w": 6,
"x": 12,
"y": 1
},
"id": 4,
"legend": {
"avg": false,
"current": false,
"max": false,
"min": false,
"show": true,
"total": false,
"values": false
},
"lines": true,
"linewidth": 1,
"links": [],
"nullPointMode": "null",
"percentage": false,
"pointradius": 5,
"points": false,
"renderer": "flot",
"seriesOverrides": [],
"spaceLength": 10,
"stack": false,
"steppedLine": false,
"targets": [
{
"expr": "canal_instance_traffic_delay{destination=~\"$destination\"} / 1000",
"format": "time_series",
"hide": false,
"interval": "15s",
"intervalFactor": 2,
"legendFormat": "master",
"refId": "D"
},
{
"expr": "canal_instance_put_delay{destination=~\"$destination\"} / 1000",
"format": "time_series",
"interval": "15s",
"intervalFactor": 2,
"legendFormat": "put",
"refId": "A"
},
{
"expr": "canal_instance_get_delay{destination=~\"$destination\"} / 1000",
"format": "time_series",
"interval": "15s",
"intervalFactor": 2,
"legendFormat": "get",
"refId": "B"
},
{
"expr": "canal_instance_ack_delay{destination=~\"$destination\"} / 1000",
"format": "time_series",
"interval": "15s",
"intervalFactor": 2,
"legendFormat": "ack",
"refId": "C"
}
],
"thresholds": [],
"timeFrom": null,
"timeShift": null,
"title": "Delay",
"tooltip": {
"shared": true,
"sort": 0,
"value_type": "individual"
},
"type": "graph",
"xaxis": {
"buckets": null,
"mode": "time",
"name": null,
"show": true,
"values": []
},
"yaxes": [
{
"format": "s",
"label": null,
"logBase": 1,
"max": null,
"min": null,
"show": true
},
{
"format": "short",
"label": null,
"logBase": 1,
"max": null,
"min": null,
"show": true
}
],
"yaxis": {
"align": false,
"alignLevel": null
}
},
{
"aliasColors": {},
"bars": false,
"dashLength": 10,
"dashes": false,
"datasource": "$datasource",
"description": "sink线程blocking占比;dump线程blocking占比(仅parallel mode)。",
"fill": 1,
"gridPos": {
"h": 5,
"w": 6,
"x": 18,
"y": 1
},
"hideTimeOverride": false,
"id": 2,
"legend": {
"avg": false,
"current": false,
"max": false,
"min": false,
"show": true,
"total": false,
"values": false
},
"lines": true,
"linewidth": 1,
"links": [],
"nullPointMode": "null",
"percentage": false,
"pointradius": 5,
"points": false,
"renderer": "flot",
"seriesOverrides": [],
"spaceLength": 10,
"stack": false,
"steppedLine": false,
"targets": [
{
"expr": "clamp_max(rate(canal_instance_publish_blocking_time{destination=~\"$destination\", parser=\"0\"}[2m]), 1000) / 10",
"format": "time_series",
"interval": "15s",
"intervalFactor": 2,
"legendFormat": "dump",
"refId": "B"
},
{
"expr": "clamp_max(rate(canal_instance_sink_blocking_time{destination=~\"$destination\"}[2m]), 1000) / 10",
"format": "time_series",
"interval": "15s",
"intervalFactor": 2,
"legendFormat": "sink",
"refId": "A"
},
{
"expr": "clamp_max(rate(canal_instance_publish_blocking_time{destination=~\"$destination\", parser=\"1\"}[2m]), 1000) / 10",
"format": "time_series",
"interval": "15s",
"intervalFactor": 2,
"legendFormat": "dump-1",
"refId": "C"
},
{
"expr": "clamp_max(rate(canal_instance_publish_blocking_time{destination=~\"$destination\", parser=\"2\"}[2m]), 1000) / 10",
"format": "time_series",
"interval": "15s",
"intervalFactor": 2,
"legendFormat": "dump-2",
"refId": "D"
}
],
"thresholds": [],
"timeFrom": null,
"timeShift": null,
"title": "Blocking",
"tooltip": {
"shared": true,
"sort": 0,
"value_type": "individual"
},
"type": "graph",
"xaxis": {
"buckets": null,
"mode": "time",
"name": null,
"show": true,
"values": []
},
"yaxes": [
{
"format": "percent",
"label": null,
"logBase": 1,
"max": null,
"min": null,
"show": true
},
{
"format": "short",
"label": null,
"logBase": 1,
"max": null,
"min": null,
"show": true
}
],
"yaxis": {
"align": false,
"alignLevel": null
}
},
{
"collapsed": false,
"gridPos": {
"h": 1,
"w": 24,
"x": 0,
"y": 6
},
"id": 32,
"panels": [],
"title": "Throughput",
"type": "row"
},
{
"aliasColors": {
"rowDatas": "#7eb26d",
"tableRows": "#c15c17"
},
"bars": false,
"dashLength": 10,
"dashes": false,
"datasource": "$datasource",
"description": "Instance处理binlog的TPS(以master变更行数table rows为基准计算)。\nput: put操作TPS。\nget: get操作TPS。\nack: ack操作TPS。",
"fill": 1,
"gridPos": {
"h": 5,
"w": 6,
"x": 0,
"y": 7
},
"id": 14,
"legend": {
"avg": false,
"current": false,
"max": false,
"min": false,
"show": true,
"total": false,
"values": false
},
"lines": true,
"linewidth": 1,
"links": [],
"nullPointMode": "null",
"percentage": false,
"pointradius": 5,
"points": false,
"renderer": "flot",
"seriesOverrides": [],
"spaceLength": 10,
"stack": false,
"steppedLine": false,
"targets": [
{
"expr": "rate(canal_instance_put_rows{destination=~\"$destination\"}[2m])",
"format": "time_series",
"interval": "15s",
"intervalFactor": 2,
"legendFormat": "put",
"refId": "A"
},
{
"expr": "rate(canal_instance_get_rows{destination=~\"$destination\"}[2m])",
"format": "time_series",
"interval": "15s",
"intervalFactor": 2,
"legendFormat": "get",
"refId": "B"
},
{
"expr": "rate(canal_instance_ack_rows{destination=~\"$destination\"}[2m])",
"format": "time_series",
"intervalFactor": 1,
"legendFormat": "ack",
"refId": "C"
}
],
"thresholds": [],
"timeFrom": null,
"timeShift": null,
"title": "TPS(table rows)",
"tooltip": {
"shared": true,
"sort": 0,
"value_type": "individual"
},
"type": "graph",
"xaxis": {
"buckets": null,
"mode": "time",
"name": null,
"show": true,
"values": []
},
"yaxes": [
{
"format": "iops",
"label": null,
"logBase": 1,
"max": null,
"min": null,
"show": true
},
{
"format": "short",
"label": null,
"logBase": 1,
"max": null,
"min": null,
"show": true
}
],
"yaxis": {
"align": false,
"alignLevel": null
}
},
{
"aliasColors": {
"transactions": "#f9ba8f"
},
"bars": false,
"dashLength": 10,
"dashes": false,
"datasource": "$datasource",
"description": "Canal instance 处理binlog的TPS,以MySQL transaction为单位计算。",
"fill": 1,
"gridPos": {
"h": 5,
"w": 6,
"x": 6,
"y": 7
},
"id": 12,
"legend": {
"avg": false,
"current": false,
"max": false,
"min": false,
"show": true,
"total": false,
"values": false
},
"lines": true,
"linewidth": 1,
"links": [],
"nullPointMode": "null",
"percentage": false,
"pointradius": 5,
"points": false,
"renderer": "flot",
"seriesOverrides": [],
"spaceLength": 10,
"stack": false,
"steppedLine": false,
"targets": [
{
"expr": "rate(canal_instance_transactions{destination=~\"$destination\"}[2m])",
"format": "time_series",
"interval": "15s",
"intervalFactor": 2,
"legendFormat": "transactions",
"refId": "A"
}
],
"thresholds": [],
"timeFrom": null,
"timeShift": null,
"title": "TPS(MySQL transaction)",
"tooltip": {
"shared": true,
"sort": 0,
"value_type": "individual"
},
"type": "graph",
"xaxis": {
"buckets": null,
"mode": "time",
"name": null,
"show": true,
"values": []
},
"yaxes": [
{
"format": "iops",
"label": null,
"logBase": 1,
"max": null,
"min": null,
"show": true
},
{
"format": "short",
"label": null,
"logBase": 1,
"max": null,
"min": null,
"show": true
}
],
"yaxis": {
"align": false,
"alignLevel": null
}
},
{
"collapsed": false,
"gridPos": {
"h": 1,
"w": 24,
"x": 0,
"y": 12
},
"id": 34,
"panels": [],
"title": "Client",
"type": "row"
},
{
"aliasColors": {},
"bars": false,
"dashLength": 10,
"dashes": false,
"datasource": "$datasource",
"description": "Canal instance接收到的请求统计,结果按packet type分类。",
"fill": 1,
"gridPos": {
"h": 5,
"w": 6,
"x": 0,
"y": 13
},
"id": 16,
"legend": {
"avg": false,
"current": false,
"max": false,
"min": false,
"show": true,
"total": false,
"values": false
},
"lines": true,
"linewidth": 1,
"links": [],
"nullPointMode": "null",
"percentage": false,
"pointradius": 5,
"points": false,
"renderer": "flot",
"seriesOverrides": [],
"spaceLength": 10,
"stack": false,
"steppedLine": false,
"targets": [
{
"expr": "canal_instance_client_packets{destination=~\"$destination\"}",
"format": "time_series",
"interval": "15s",
"intervalFactor": 2,
"legendFormat": "{{packetType}}",
"refId": "A"
}
],
"thresholds": [],
"timeFrom": null,
"timeShift": null,
"title": "Client requests",
"tooltip": {
"shared": true,
"sort": 0,
"value_type": "individual"
},
"type": "graph",
"xaxis": {
"buckets": null,
"mode": "time",
"name": null,
"show": true,
"values": []
},
"yaxes": [
{
"format": "none",
"label": null,
"logBase": 1,
"max": null,
"min": null,
"show": true
},
{
"format": "short",
"label": null,
"logBase": 1,
"max": null,
"min": null,
"show": true
}
],
"yaxis": {
"align": false,
"alignLevel": null
}
},
{
"aliasColors": {},
"bars": false,
"dashLength": 10,
"dashes": false,
"datasource": "$datasource",
"description": "client 请求的GET与ACK包的QPS。",
"fill": 1,
"gridPos": {
"h": 5,
"w": 6,
"x": 6,
"y": 13
},
"id": 38,
"legend": {
"avg": false,
"current": false,
"max": false,
"min": false,
"show": true,
"total": false,
"values": false
},
"lines": true,
"linewidth": 1,
"links": [],
"nullPointMode": "null",
"percentage": false,
"pointradius": 5,
"points": false,
"renderer": "flot",
"seriesOverrides": [],
"spaceLength": 10,
"stack": false,
"steppedLine": false,
"targets": [
{
"expr": "rate(canal_instance_client_packets{destination=~\"$destination\",packetType=\"GET\"}[2m])",
"format": "time_series",
"interval": "15s",
"intervalFactor": 2,
"legendFormat": "GET",
"refId": "A"
},
{
"expr": "rate(canal_instance_client_packets{destination=~\"$destination\",packetType=\"CLIENTACK\"}[2m])",
"format": "time_series",
"interval": "15s",
"intervalFactor": 2,
"legendFormat": "ACK",
"refId": "B"
}
],
"thresholds": [],
"timeFrom": null,
"timeShift": null,
"title": "Client QPS",
"tooltip": {
"shared": true,
"sort": 0,
"value_type": "individual"
},
"type": "graph",
"xaxis": {
"buckets": null,
"mode": "time",
"name": null,
"show": true,
"values": []
},
"yaxes": [
{
"format": "short",
"label": null,
"logBase": 1,
"max": null,
"min": null,
"show": true
},
{
"format": "short",
"label": null,
"logBase": 1,
"max": null,
"min": null,
"show": true
}
],
"yaxis": {
"align": false,
"alignLevel": null
}
},
{
"aliasColors": {},
"bars": false,
"dashLength": 10,
"dashes": false,
"datasource": "$datasource",
"description": "server响应GET请求,但返回空包的占比。",
"fill": 1,
"gridPos": {
"h": 5,
"w": 6,
"x": 12,
"y": 13
},
"id": 26,
"legend": {
"avg": false,
"current": false,
"max": false,
"min": false,
"show": true,
"total": false,
"values": false
},
"lines": true,
"linewidth": 1,
"links": [],
"nullPointMode": "null",
"percentage": false,
"pointradius": 5,
"points": false,
"renderer": "flot",
"seriesOverrides": [],
"spaceLength": 10,
"stack": false,
"steppedLine": false,
"targets": [
{
"expr": "rate(canal_instance_client_empty_batches{destination=~\"$destination\"}[2m])",
"format": "time_series",
"interval": "15s",
"intervalFactor": 2,
"legendFormat": "empty",
"refId": "A"
},
{
"expr": "rate(canal_instance_client_packets{destination=~\"$destination\", packetType=\"GET\"}[2m])",
"format": "time_series",
"intervalFactor": 1,
"legendFormat": "nonempty",
"refId": "B"
}
],
"thresholds": [],
"timeFrom": null,
"timeShift": null,
"title": "Empty packets",
"tooltip": {
"shared": true,
"sort": 0,
"value_type": "individual"
},
"type": "graph",
"xaxis": {
"buckets": null,
"mode": "time",
"name": null,
"show": true,
"values": []
},
"yaxes": [
{
"format": "wps",
"label": null,
"logBase": 1,
"max": null,
"min": null,
"show": true
},
{
"format": "short",
"label": null,
"logBase": 1,
"max": null,
"min": null,
"show": true
}
],
"yaxis": {
"align": false,
"alignLevel": null
}
},
{
"aliasColors": {},
"bars": false,
"dashLength": 10,
"dashes": false,
"datasource": "$datasource",
"description": "Canal client 请求响应时间的概况。",
"fill": 1,
"gridPos": {
"h": 5,
"w": 6,
"x": 18,
"y": 13
},
"id": 18,
"legend": {
"alignAsTable": false,
"avg": false,
"current": false,
"max": false,
"min": false,
"rightSide": false,
"show": true,
"total": false,
"values": false
},
"lines": true,
"linewidth": 1,
"links": [],
"nullPointMode": "null",
"percentage": false,
"pointradius": 5,
"points": false,
"renderer": "flot",
"seriesOverrides": [
{
"alias": "25.0",
"yaxis": 1
},
{
"alias": "100.0",
"yaxis": 1
}
],
"spaceLength": 10,
"stack": false,
"steppedLine": false,
"targets": [
{
"expr": "rate(canal_instance_client_request_latency_bucket{destination=~\"$destination\"}[2m])",
"format": "time_series",
"hide": false,
"interval": "15s",
"intervalFactor": 2,
"legendFormat": "{{le}}ms",
"refId": "A"
}
],
"thresholds": [],
"timeFrom": null,
"timeShift": null,
"title": "Response time",
"tooltip": {
"shared": true,
"sort": 0,
"value_type": "individual"
},
"transparent": false,
"type": "graph",
"xaxis": {
"buckets": null,
"mode": "time",
"name": null,
"show": true,
"values": []
},
"yaxes": [
{
"format": "short",
"label": null,
"logBase": 1,
"max": null,
"min": null,
"show": true
},
{
"format": "short",
"label": null,
"logBase": 1,
"max": null,
"min": null,
"show": true
}
],
"yaxis": {
"align": false,
"alignLevel": null
}
},
{
"collapsed": false,
"gridPos": {
"h": 1,
"w": 24,
"x": 0,
"y": 18
},
"id": 36,
"panels": [],
"title": "Store",
"type": "row"
},
{
"aliasColors": {},
"bars": false,
"dashLength": 10,
"dashes": false,
"datasource": "$datasource",
"description": "Canal instance ringbuffer内未释放的events数量。",
"fill": 1,
"gridPos": {
"h": 5,
"w": 6,
"x": 0,
"y": 19
},
"id": 20,
"legend": {
"avg": false,
"current": false,
"max": false,
"min": false,
"show": true,
"total": false,
"values": false
},
"lines": true,
"linewidth": 1,
"links": [],
"nullPointMode": "null",
"percentage": false,
"pointradius": 5,
"points": false,
"renderer": "flot",
"seriesOverrides": [],
"spaceLength": 10,
"stack": false,
"steppedLine": false,
"targets": [
{
"expr": "canal_instance_store_produce_seq{destination=~\"$destination\"} - canal_instance_store_consume_seq{destination=~\"$destination\"}",
"format": "time_series",
"interval": "15s",
"intervalFactor": 2,
"legendFormat": "events",
"refId": "A"
}
],
"thresholds": [],
"timeFrom": null,
"timeShift": null,
"title": "Store remain events",
"tooltip": {
"shared": true,
"sort": 0,
"value_type": "individual"
},
"type": "graph",
"xaxis": {
"buckets": null,
"mode": "time",
"name": null,
"show": true,
"values": []
},
"yaxes": [
{
"decimals": null,
"format": "none",
"label": "",
"logBase": 1,
"max": null,
"min": null,
"show": true
},
{
"decimals": null,
"format": "short",
"label": null,
"logBase": 1,
"max": null,
"min": null,
"show": true
}
],
"yaxis": {
"align": false,
"alignLevel": null
}
},
{
"aliasColors": {},
"bars": false,
"dashLength": 10,
"dashes": false,
"datasource": "$datasource",
"description": "Canal instance ringbuffer 内未释放events占用内存。",
"fill": 1,
"gridPos": {
"h": 5,
"w": 6,
"x": 6,
"y": 19
},
"id": 22,
"legend": {
"avg": false,
"current": false,
"max": false,
"min": false,
"show": true,
"total": false,
"values": false
},
"lines": true,
"linewidth": 1,
"links": [],
"nullPointMode": "null",
"percentage": false,
"pointradius": 5,
"points": false,
"renderer": "flot",
"seriesOverrides": [],
"spaceLength": 10,
"stack": false,
"steppedLine": false,
"targets": [
{
"expr": "(canal_instance_store_produce_mem{destination=~\"$destination\"} - canal_instance_store_consume_mem{destination=~\"$destination\"}) / 1024",
"format": "time_series",
"interval": "15s",
"intervalFactor": 2,
"legendFormat": "memsize",
"refId": "A"
}
],
"thresholds": [],
"timeFrom": null,
"timeShift": null,
"title": "Store remain mem",
"tooltip": {
"shared": true,
"sort": 0,
"value_type": "individual"
},
"type": "graph",
"xaxis": {
"buckets": null,
"mode": "time",
"name": null,
"show": true,
"values": []
},
"yaxes": [
{
"format": "deckbytes",
"label": null,
"logBase": 1,
"max": null,
"min": null,
"show": true
},
{
"format": "short",
"label": null,
"logBase": 1,
"max": null,
"min": null,
"show": true
}
],
"yaxis": {
"align": false,
"alignLevel": null
}
}
],
"refresh": false,
"schemaVersion": 16,
"style": "dark",
"tags": [
"canal"
],
"templating": {
"list": [
{
"current": {
"text": "prometheus",
"value": "prometheus"
},
"hide": 0,
"label": "datasource",
"name": "datasource",
"options": [],
"query": "prometheus",
"refresh": 1,
"regex": "",
"type": "datasource"
},
{
"allValue": null,
"current": {},
"datasource": "$datasource",
"hide": 0,
"includeAll": false,
"label": "destination",
"multi": false,
"name": "destination",
"options": [],
"query": "label_values(canal_instance, destination)",
"refresh": 1,
"regex": "",
"sort": 0,
"tagValuesQuery": "",
"tags": [],
"tagsQuery": "",
"type": "query",
"useTags": false
}
]
},
"time": {
"from": "now-6h",
"to": "now"
},
"timepicker": {
"refresh_intervals": [
"5s",
"10s",
"30s",
"1m",
"5m",
"15m",
"30m",
"1h",
"2h",
"1d"
],
"time_options": [
"5m",
"15m",
"1h",
"6h",
"12h",
"24h",
"2d",
"7d",
"30d"
]
},
"timezone": "",
"title": "Canal instances",
"uid": "8vh8NGpiz",
"version": 103
}
三、参考链接
1、https://github.com/alibaba/canal/wiki/Prometheus-QuickStart
Prometheus监控Canal的更多相关文章
- prometheus监控系统
关于Prometheus Prometheus是一套开源的监控系统,它将所有信息都存储为时间序列数据:因此实现一种Profiling监控方式,实时分析系统运行的状态.执行时间.调用次数等,以找到系统的 ...
- Kubernetes集群部署史上最详细(二)Prometheus监控Kubernetes集群
使用Prometheus监控Kubernetes集群 监控方面Grafana采用YUM安装通过服务形式运行,部署在Master上,而Prometheus则通过POD运行,Grafana通过使用Prom ...
- SpringCloud使用Prometheus监控(基于Eureka)
本文介绍SpringCloud使用Prometheus,基于Eureka服务发现. 1.Prometheus介绍 在之前写过两篇有关Prometheus使用的文章,如下: <SpringBoot ...
- SpringBoot使用prometheus监控
本文介绍SpringBoot如何使用Prometheus配合Grafana监控. 1.关于Prometheus Prometheus是一个根据应用的metrics来进行监控的开源工具.相信很多工程都在 ...
- Prometheus 监控Haproxy
Prometheus 监控Haproxy 普罗米修斯是一个完整的监控和趋势系统,包括基于时间序列数据的内置和主动刮削,存储,查询,绘图和警报,以下使用Prometheus+grafana对Haprox ...
- 使用 Docker 部署 Grafana + Prometheus 监控 MySQL 数据库
一.背景 在平时开发过程当中需要针对 MySQL 数据库进行监控,这里我们可以使用 Grafana 和 Prometheus 来实现监控功能.Grafana 是一款功能强大的仪表盘面板,支持多种数据源 ...
- Prometheus监控学习记录
官方文档 Prometheus基础文档 从零开始:Prometheus 进阶之路:Prometheus —— 技巧篇 进阶之路:Prometheus —— 理解篇 prometheus的数据类型介绍 ...
- Prometheus监控学习笔记之prometheus的federation机制
0x00 概述 有时候对于一个公司,k8s集群或是所谓的caas只是整个技术体系的一部分,往往这个时候监控系统不仅仅要k8s集群以及k8s中部署的应用,而且要监控传统部署的项目.也就是说整个监控系统不 ...
- Prometheus监控学习笔记之Prometheus不完全避坑指南
0x00 概述 Prometheus 是一个开源监控系统,它本身已经成为了云原生中指标监控的事实标准,几乎所有 k8s 的核心组件以及其它云原生系统都以 Prometheus 的指标格式输出自己的运行 ...
随机推荐
- Git 系列教程(2)- Git 安装
前言 直接复制官网的教程了,不对自己百度吧,不然就参考下我的几篇文章 Linux安装Git(源码安装) https://www.cnblogs.com/poloyy/p/12186802.html 在 ...
- WEB漏洞——文件上传
有关文件上传的知识 为什么文件上传存在漏洞 上传文件时,如果服务端代码未对客户端上传的文件进行严格的验证和过滤就容易造成可以上传任意文件的情況,包括上传脚本文件(asp.aspx.php.jsp等格式 ...
- IPSEC的实现方式
IPSEC的实现方式 在IPSEC通信中涉及到一个重要方面,那就是如何定义要保护的数据流(又称为感兴趣流).这不仅涉及到IPSEC最终要保护哪部分数据,还关系到IPSEC的实现方式,因此有必要把感兴趣 ...
- [第九篇]——Docker 镜像使用之Spring Cloud直播商城 b2b2c电子商务技术总结
Docker 镜像使用 当运行容器时,使用的镜像如果在本地中不存在,docker 就会自动从 docker 镜像仓库中下载,默认是从 Docker Hub 公共镜像源下载. 下面我们来学习: 1.管理 ...
- 如何在云效流水线 Flow中构建属于自己的NPM仓库
如何在云效流水线 Flow中构建属于自己的NPM仓库,Flow 通过各种构建组件,对各种语言提供了制品打包能力,让用户可以快速的使用流水线构建制品,并通过后续的部署任务进行部署.Flow 已经完成了与 ...
- 1 行Python代码能干哪些事,这 13个你知道吗?
首先你要了解一下Python之禅,一行代码输出"The Zen of Python": python -c "import this"""& ...
- 并发编程之:ForkJoin
大家好,我是小黑,一个在互联网苟且偷生的农民工. 在JDK1.7中引入了一种新的Fork/Join线程池,它可以将一个大的任务拆分成多个小的任务并行执行并汇总执行结果. Fork/Join采用的是分而 ...
- CodeForce-812B Sagheer, the Hausmeister(DFS)
Sagheer, the Hausmeister CodeForces - 812B 题意:有一栋楼房,里面有很多盏灯没关,为了节约用电小L决定把这些灯都关了. 这楼有 n 层,最左边和最右边有楼梯. ...
- Spring框架(第一天)
一. 引言 a) 什么是Spring框架?(spring官网:www.springsource.org) 3.x 不提供第三发依赖jar 目前已经到了5.x版本. Spring轻量级(代码入侵性小) ...
- Shell系列(33) - 多分支if语句简介及计算器例子
多分支if条件语句 if [ 条件判断式1 ] then 当条件判断式1成立时,执行程序1 elif [ 条件判断式2 ] then 当条件判断式2成立时,执行程序2 ...省略更多条件... els ...