在 Github Action 管道内集成 Code Coverage Report
Github Actions
我们的开源项目 Host 在 Github,并且使用它强大的 Actions 功能在做 CICD。单看 Github Actions 可能不知道是啥。其实它就是我们常说的 CICD pipeline 或者叫 workflow。当我们 Push 代码到 Github,它会自动触发这些管道。它会帮我们自动 build 代码,跑 test cases,构建镜像,发布镜像,等等。这一切还都是免费的。
今天我把 AgileConfig 的测试在 Github Actions 上跑通了。原来集成测试在 Actions 上跑一直有点问题,今天终于修好了。既然 test cases 都可以跑通了,那么能不能在 Actions 直接看到 code coverage 呢?答案当然是肯定的。
运行测试并收集结果
在我们每次运行单元测试的时候,微软的工具其实已经可以为我们生成结果描述文件了。请使用以下代码运行测试:
dotnet test --no-build --verbosity normal --collect:"XPlat Code Coverage" --results-directory ./coverage
运行完成后我们可以看到会生成多个 xml 文件,这些文件其实就是用来描述测试内容与结果的文件.
测试运行成功。

测试总数: 123

     通过数: 123

总时间: 2.6757 分钟

     1>已完成生成项目“D:\00WORKSPACE\AgileConfig\AgileConfig.sln”(VSTest 个目标)的操作。

已成功生成。

    0 个警告

    0 个错误

已用时间 00:02:43.08

附件:

  D:\00WORKSPACE\AgileConfig\coverage\1a7564b1-aa53-44ad-b34b-9abbb4b97c9f\coverage.cobertura.xml

  D:\00WORKSPACE\AgileConfig\coverage\45f571fb-2ec4-445b-b444-6879f784c925\coverage.cobertura.xml

  D:\00WORKSPACE\AgileConfig\coverage\ff1d49a5-9663-42f9-813b-2ef81fe5ed3f\coverage.cobertura.xml

  D:\00WORKSPACE\AgileConfig\coverage\6b502f8f-a99f-4931-8643-faf79db7273c\coverage.cobertura.xml

  D:\00WORKSPACE\AgileConfig\coverage\ff389298-7b68-4e60-a35c-d9c0db8cd640\coverage.cobertura.xml
在本地分析测试结果
有了这几个 xml 文件我们就可以进行分析了。当然用肉眼来分析是看不出来啥的。我们先在本地用插件来分析一波。
在 VS 里安装插件:
Fine Code Coverage
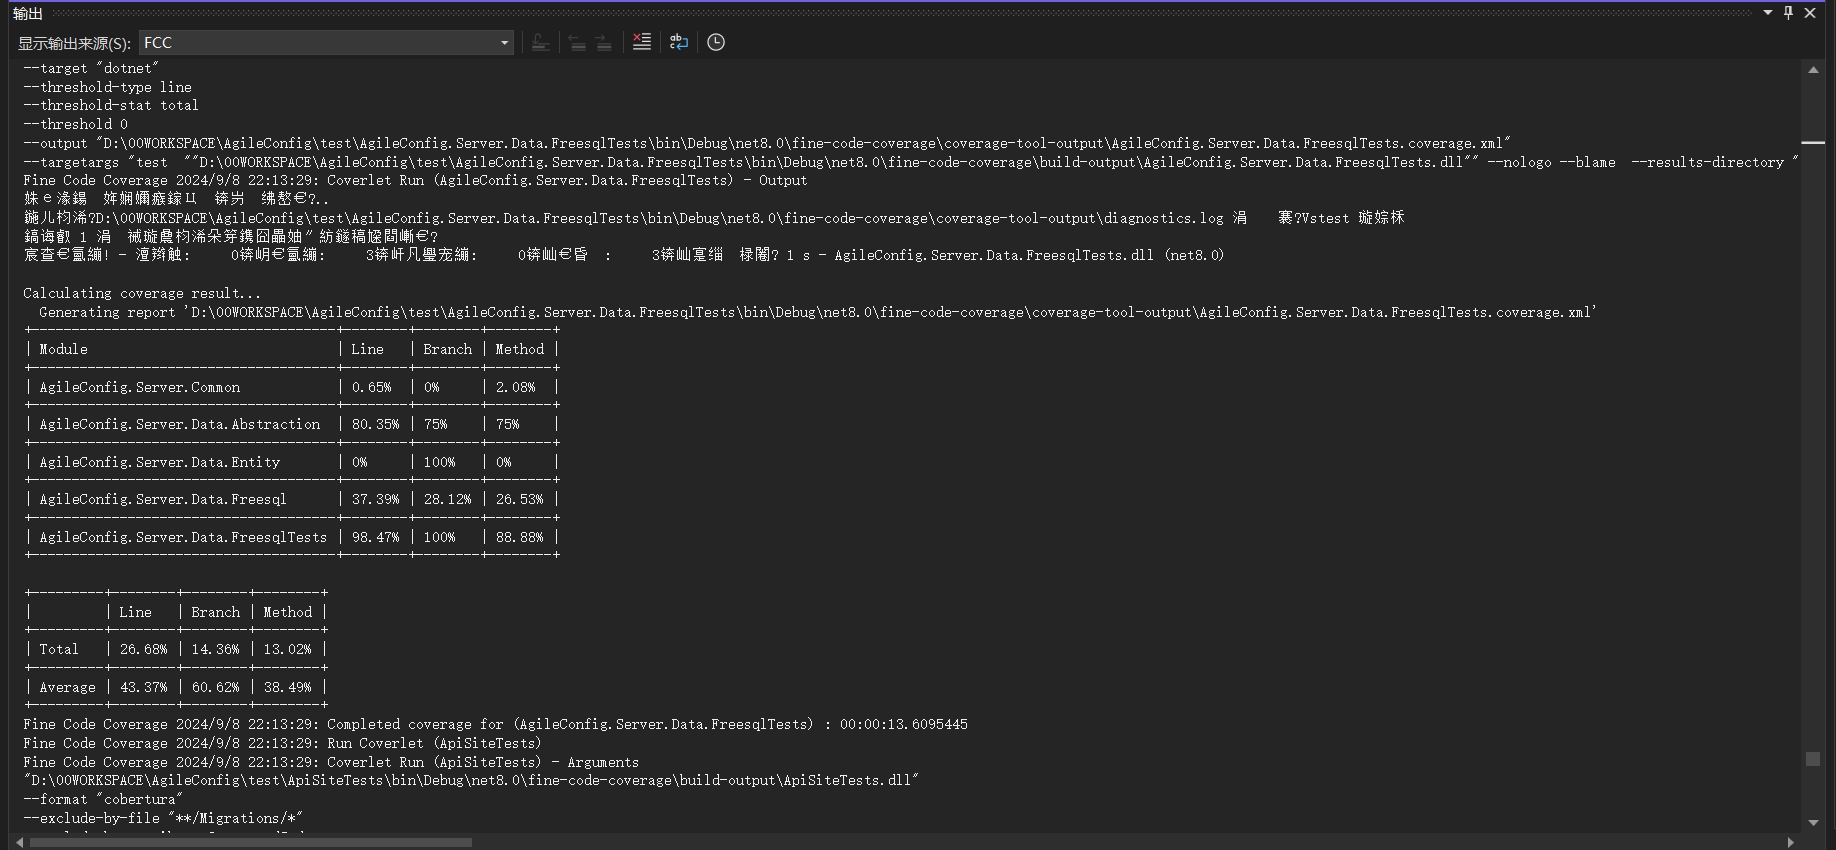
安装完后插件后,再次运行一下所有的测试用例。在 VS 的输出窗口我们选择 FCC 。
这个窗口内会打印出每个 project 的测试结果。
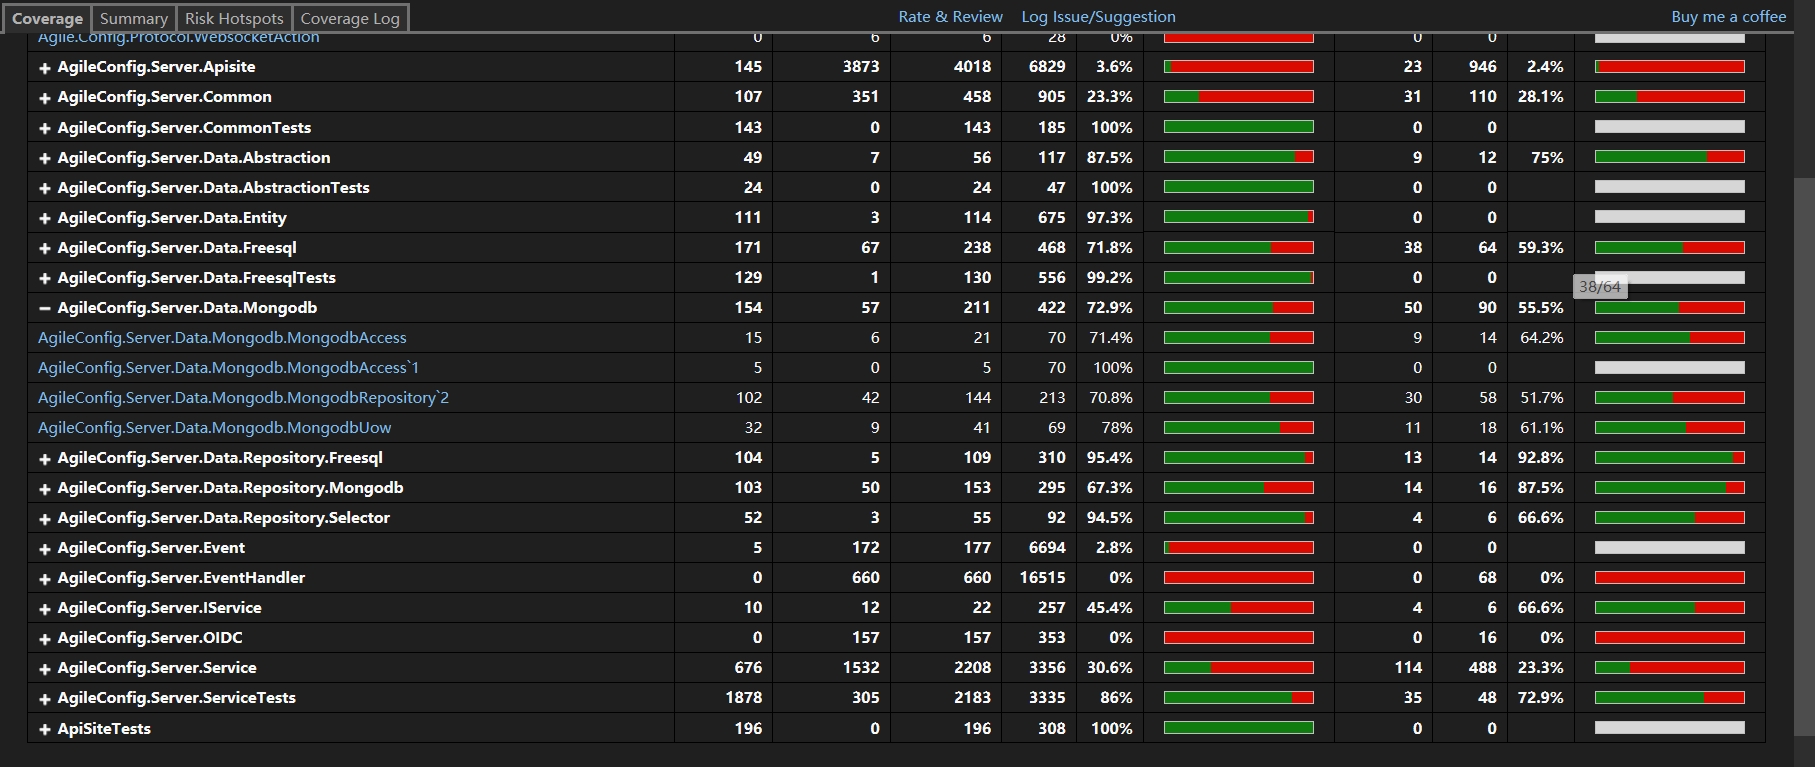
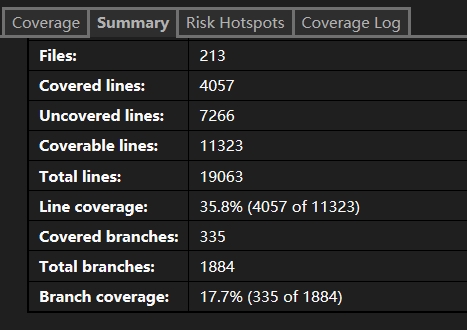
打开 “视图”>“其他窗口”>“Fine code coverage” ,我们能查看更详细的结果。
使用 CodeCoverageSummary
既然在本地能分析这些文件,那么我们显然只要能在 Github Actions 里面插入一步分析的步骤就可以了。显然已经有大佬实现了这个 Action,我们只要集成到自己的 workflow 文件里就行了。
CodeCoverageSummary:
A GitHub Action that reads Cobertura format code coverage files from your test suite and outputs a text or markdown summary. This summary can be posted as a Pull Request comment or included in Release Notes by other actions to give you an immediate insight into the health of your code without using a third-party site.
修改我们的 CI Workflow 文件:
  - name: Build

      run: dotnet build --no-restore

    - name: Test

      run: dotnet test --no-build --verbosity normal --collect:"XPlat Code Coverage" --results-directory ./coverage

    - name: Code Coverage Report

      uses: irongut/CodeCoverageSummary@v1.3.0

      with:

        filename: coverage/**/coverage.cobertura.xml

        badge: true

        fail_below_min: true

        format: markdown

        hide_branch_rate: false

        hide_complexity: true

        indicators: true

        output: both

        thresholds: '60 80'
使用起来非常简单。并且有非常多的配置项,这里不一一介绍了。有需要的直接看它的文档吧。
下面让我们跑一下这个 workflow 试试看。
Coverage File: /github/workspace/coverage/d497ebaf-5670-41ea-8215-dfb4f3a037d6/coverage.cobertura.xml
Coverage File: /github/workspace/coverage/83632b7c-8df2-4179-b0a8-e6410a71b1b7/coverage.cobertura.xml
Coverage File: /github/workspace/coverage/b434d3bb-7909-4a7d-b0f2-f8620d429cfc/coverage.cobertura.xml
Coverage File: /github/workspace/coverage/af81da37-b5c5-4edd-a409-74984355857e/coverage.cobertura.xml
Coverage File: /github/workspace/coverage/1b159b39-3eb4-4951-936e-afde68925b34/coverage.cobertura.xml

Package | Line Rate | Branch Rate | Health
-------- | --------- | ----------- | ------
AgileConfig.Server.IService | 41% | 67% |
Agile.Config.Protocol | 0% | 100% |
AgileConfig.Server.Data.Repository.Freesql | 95% | 93% |
AgileConfig.Server.Data.Freesql | 72% | 59% |
AgileConfig.Server.Service | 28% | 21% |
AgileConfig.Server.EventHandler | 0% | 0% |
AgileConfig.Server.Data.Mongodb | 73% | 54% |
AgileConfig.Server.Data.Abstraction | 77% | 50% |
AgileConfig.Server.Event | 0% | 100% |
AgileConfig.Server.Data.Repository.Mongodb | 67% | 88% |
AgileConfig.Server.Data.Entity | 97% | 100% |
AgileConfig.Server.Common | 1% | 0% |
AgileConfig.Server.Data.Repository.Selector | 95% | 67% |
AgileConfig.Server.Data.Freesql | 45% | 31% |
AgileConfig.Server.Data.Abstraction | 80% | 75% |
AgileConfig.Server.Data.Entity | 89% | 100% |
AgileConfig.Server.Common | 1% | 0% |
AgileConfig.Server.Data.Abstraction | 77% | 67% |
AgileConfig.Server.Data.Entity | 0% | 100% |
AgileConfig.Server.Common | 1% | 0% |
AgileConfig.Server.Common | 21% | 25% |
AgileConfig.Server.IService | 27% | 17% |
Agile.Config.Protocol | 0% | 100% |
AgileConfig.Server.Data.Repository.Freesql | 0% | 0% |
AgileConfig.Server.Data.Freesql | 0% | 0% |
AgileConfig.Server.Service | 2% | 2% |
AgileConfig.Server.EventHandler | 0% | 0% |
AgileConfig.Server.Data.Mongodb | 0% | 0% |
AgileConfig.Server.Data.Abstraction | 0% | 0% |
AgileConfig.Server.Event | 3% | 100% |
AgileConfig.Server.Data.Repository.Mongodb | 0% | 0% |
AgileConfig.Server.Data.Entity | 15% | 100% |
AgileConfig.Server.OIDC | 0% | 0% |
AgileConfig.Server.Common | 2% | 3% |
AgileConfig.Server.Data.Repository.Selector | 0% | 0% |
AgileConfig.Server.Apisite | 4% | 2% |
**Summary** | **18%** (2009 / 15061) | **15%** (337 / 3196) |
_Minimum allowed line rate is `60%`_
FAIL: Overall line rate below minimum threshold of 60%.
我们发现这个 workflow 跑失败了。原因是我们的 coverage 只有 18%。刚才我们配置了最小值是 60%,低于60就会直接跑出异常,中断 workflow。看日志我们也可以看到对每一个项目的统计。有 line rate,branch rate,health 等内容。
总结
这次我们演示了如何在本地使用 VS 插件对单元测试的结果进行分析获得 coverage。以及演示了如何通过 CodeCoverageSummary 在 Github Action 的 workflow 内对测试结果进行分析。还是非常简单的。希望对大家有帮助。
好了不说了,补单元测试去了。。。
关注我的公众号一起玩转技术

在 Github Action 管道内集成 Code Coverage Report的更多相关文章
- CI集成phpunit Error: No code coverage driver is available 的解决
CI集成phpunit时,运行报No code coverage driver is available的错误,如下图: yanglingdeMacBook-Pro:tests yangling$ p ...
- 用 GitHub Action 构建一套 CI/CD 系统
缘起 Nebula Graph 最早的自动化测试是使用搭建在 Azure 上的 Jenkins,配合着 GitHub 的 Webhook 实现的,在用户提交 Pull Request 时,加个 r ...
- 测试工具 - IDEA - IDEA Code Coverage
概述 使用 idea 自带的 code coverage 工具 背景 了解 白盒测试用例设计 和 测试覆盖率 之后, 大概就需要 实践 了 实践的话, 还是需要 工具 来检验效果 工具选取 选项 Ja ...
- Github Action 快速上手指南
前言 各位读者,新年快乐,我是过了年匆忙赶回上海努力搬砖的蛮三刀. Github之前更新了一个Action功能(应该是很久以前了),可以实现很多自动化操作.用来替代用户自己设置的自动化脚本(比如:钩子 ...
- 使用Github Action自动填写疫情通
使用Github Action自动填写疫情通 西电晨午晚检一天三次,通过企业号功能进行填写.实际上,西电企业号大部分功能是以网页模式工作的,通过构造connection发送合适的request,设置计 ...
- github action 实现CI/CD
两种github action 打包.Net Core 项目docker镜像推送到阿里云镜像仓库 1.GitHub Actions 是什么? 大家知道,持续集成由很多操作组成,比如抓取代码.运行测试. ...
- 白嫖GitHub Action实现开源项目CICD
什么是CI/CD?让你的项目变得更加敏捷! 在今天这个快速变化的时代,开发者们需要与时俱进,不断提升自己的工作效率.在这篇文章里,将一起探讨如何使用CI/CD和Github Action让你的项目更加 ...
- 代码覆盖率 (Code Coverage)从简到繁 (一)
代码覆盖率(Code Coverage)是反映测试用例对被测软件覆盖程度的重要指标,也是衡量测试工作进展情况的重要指标.它也是对测试工作进行量化的重要指标之一,测试工作往往不如开发那样激动人心,一个重 ...
- iOS 9 学习系列: Xcode Code Coverage
Code coverage 是一个计算你的单元測试覆盖率的工具. 高水平的覆盖给你的单元測试带来信心.也表明你的应用被彻底的測试过了. 你可能写了几千个单元測试,但假设覆盖率不高.那么你写的这套測试可 ...
- 使用Visual Studio Code Coverage和nunit上传单元测试覆盖率和单元测试结果到SonarQube上
SonarQube.Scanner.MSBuild.exe begin /k:"OMDCCQuotes" /d:sonar.host.url="http://myip:9 ...
随机推荐
- Nuitka打包
Nuitka打包PySide6/PyQt 本文仅供本人知识总结使用,所以内容会比较浅显,不喜勿喷. 文章目录 Nuitka打包PySide6/PyQt 一.需要C++编译器 二.安装Nuitka 三. ...
- java_父类子类
private 只有自身能访问自身 自身 同包子 不同包子类 同包类 其他类 可以访问 不能继承 不能继承 不能访问 不能访问 package/friendly/default == 不写 自身 同包 ...
- TwinCAT3 - 实现CiA402
目录 1,起缘 2,想办法 3,开搞 3.1,CANOpen通信 3.1.1 对象字典 3.1.2 通信建立 3.2,CiA402伺服状态机 3.3,伺服运行 3.3.1 操作模式 3.3.2 轮廓位 ...
- ArgoWorkflow教程(三)---使用 Artifacts 实现步骤间文件共享
上一篇我们分析了 Workflow.WorkflowTemplate.template 之间的关系.本篇主要分析如何在 argo-workflow 中使用 S3 存储 artifact 实现步骤之间的 ...
- 2024 NepCTF
NepCTF NepMagic -- CheckIn 直接玩游戏就能出 注意有一关要把隐藏的方块全找到 NepCamera 先使用tshark读取数据 结果文件中发现大量jpeg头ffd8ffe0. ...
- Docker网络上篇-网络介绍
通过前面的学习,我们已经可以把自己写的微服务项目通过dockerfile文件方式部署到docker上面了.那么微服务之间通信,怎么通信的?是在同一个网络还是在不同的网络环境下?docker中怎么配置网 ...
- pyinstaller 打包 win32ctypes.pywin32.pywintypes.error: (225, '', '无法成功完成操作,因为文件包含病毒或潜在的垃圾软件。')
背景: 使用python 写了一个程序,使用pyinstaller打包, 不使用-w --noconsole的命令打包隐藏命令行窗口时,是正常的, 但是使用-w或者--noconsole就会报错win ...
- 使用 nuxi init 创建全新 Nuxt 项目
title: 使用 nuxi init 创建全新 Nuxt 项目 date: 2024/9/6 updated: 2024/9/6 author: cmdragon excerpt: 摘要:本文介绍了 ...
- OCR技术的昨天今天和明天!2023年最全OCR技术指南!
OCR是一项科技革新,通过自动化大幅减少人工录入的过程,帮助用户从图像或扫描文档中提取文字,并将这些文字转换为计算机可读格式.这一功能在许多需要进一步处理数据的场景中,如身份验证.费用管理.自动报销. ...
- Angular Material 18+ 高级教程 – CDK Layout の Breakpoints
前言 CDK Layout 主要是用于处理 Breakpoints,它底层是依靠 window.matchMedia 来实现的. Material Design 2 & 3 Breakpoin ...