d3.js 教程 模仿echarts柱状图
由于最近工作不是很忙,隧由把之前的charts项目用d3.js重写的一下,其实d3.js文档很多,但是入门不是很难,可是想真的能做一个完成的,交互良好的图还是要下一番功夫的。今天在echarts找到了一个柱状图,如图。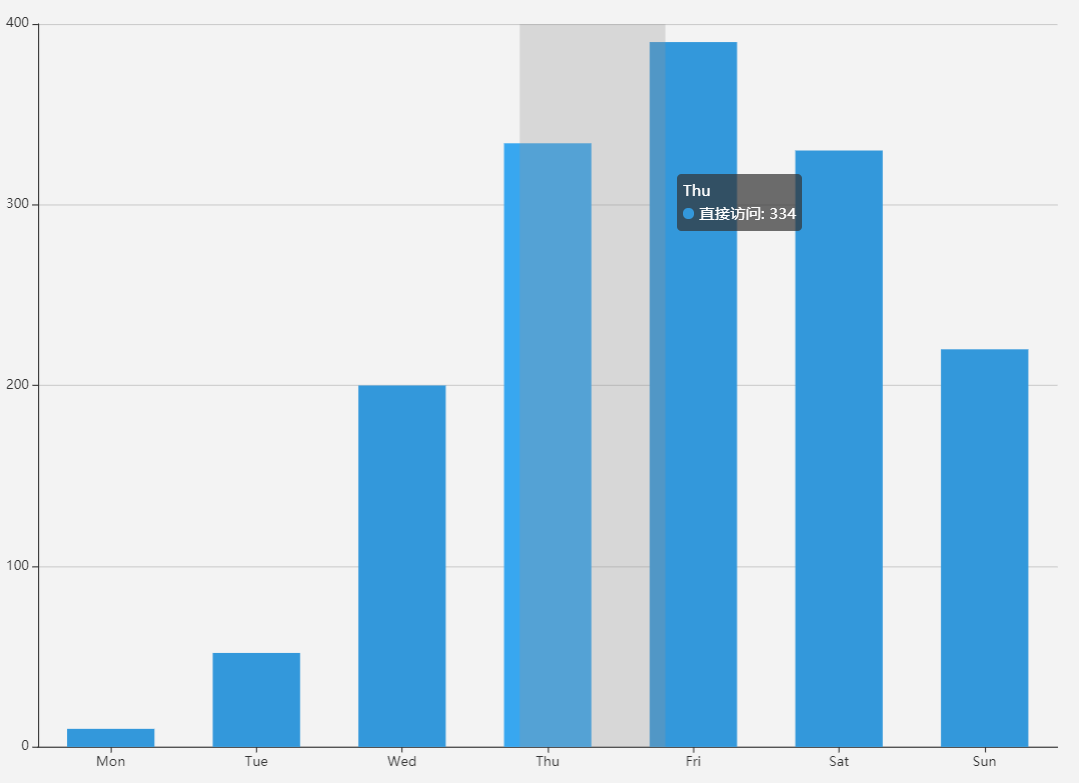
模仿了一番,废话不多说。下面就开始我们的代码(注意是D3.v4版本)。
1. js 类
class Bar {

    constructor() {

        this._width = 1000;

        this._height = 700;

        this._padding = 10;

        this._offset = 35;

        this._margins = {right: 40,bottom: 40,left: 40,top: 40};

        this._scaleX = d3.scaleBand().rangeRound([0, this._width - this._margins.left - this._margins.right]);

        this._scaleY = d3.scaleLinear().range([this._height - this._margins.top - this._margins.bottom, 0]);

        this._color = '#3398DB';

        this._data = [];

        this._svg = null;

        this._body = null;

        this._tooltip = null;

        this._shadow = null;

        this._ticks = 5;

        this._key = 'key';

        this._value = 'value';

    }

    render() {

        if(!this._tooltip) {

            this._tooltip = d3.select('body')

            .append('div')

            .style('left', '40px')

            .style('top', '30px')

            .attr('class', 'tooltip')

            .html('');

        }

        if(!this._svg) {

            this._svg = d3.select('body')

                .append('svg')

                .attr('width', this._width)

                .attr('height', this._height)

            this.renderAxes();

            this.renderClipPath();

        }

        this.renderBody();

    }

    renderAxes() {

        let axes = this._svg.append('g')

            .attr('class', 'axes');

        this.renderXAxis(axes);

        this.renderYAxis(axes);

    }

    renderXAxis(axes) {

        let xAxis = d3.axisBottom().scale(this._scaleX)

        axes.append('g')

            .attr('class', 'x axis')

            .attr('transform', `translate(${this.xStart()}, ${this.yStart()})`)

            .call(xAxis)

    }

    renderYAxis(axes) {

        let yAxis = d3.axisLeft().scale(this._scaleY).ticks(this._ticks);

        axes.append('g')

            .attr('class', 'y axis')

            .attr('transform', `translate(${this.xStart()}, ${this.yEnd()})`)

            .call(yAxis)

        d3.selectAll('.y .tick')

            .append('line')

            .attr('class', 'grid-line')

            .attr('x1', 0)

            .attr('y1', 0)

            .attr('x2', this.quadrantWidth())

            .attr('y2', 0)

    }

    renderClipPath() {

        this._svg.append('defs')

            .append('clip-path')

            .attr('id', 'body-clip')

            .append('rect')

            .attr('x', 0)

            .attr('y', 0)

            .attr('width', this.quadrantWidth())

            .attr('height', this.quadrantHeight())

    }

    renderBody() {

        if(!this._body) {

            this._body = this._svg.append('g')

                .attr('class', 'body')

                .attr('transform', `translate(${this._margins.left},${this._margins.top})`)

                .attr('clip-path', 'url(#clipPath)')

            this.renderShadow()

        }

        this.renderBar();

        this.listenMousemove();

    }

    renderShadow() {

        this._shadow = this._body.append('rect')

            .attr('x', 0)

            .attr('y', 0)

            .attr('width', this.everyWidth())

            .attr('height', this._scaleY(0))

            .attr('fill', '#000')

            .attr('fill-opacity', 0)

    }

    renderBar() {

        let barElements = this._body

            .selectAll('rect.bar')

            .data(this._data);

        let barEnter =  barElements

            .enter()

            .append('rect')

            .attr('class', 'bar')

            .attr('x', d => this._scaleX(d[this._key]) + this.everyWidth() * 0.18)

            .attr('y', () => this._scaleY(0))

            .attr('width', this.everyWidth() * 0.64)

            .attr('height', () => this.quadrantHeight() - this._scaleY(0))

        let barUpdate = barEnter

            .merge(barElements)

            .transition()

            .duration(800)

            .ease(d3.easeCubicOut)

            .attr('y', d => this._scaleY(d[this._value]))

            .attr('height', d => {

                console.log(this.quadrantHeight() - this._scaleY(d[this._value]))

                return this.quadrantHeight() - this._scaleY(d[this._value])

            });

        let barExit = barElements

            .exit()

            .transition()

            .attr('y', () => this._scaleY(0))

            .attr('height', () => this.quadrantHeight() - this._scaleY(0))

            .remove();

    }

    listenMousemove() {

        this._svg.on('mousemove', () => {

            let px = d3.event.offsetX;

            let py = d3.event.offsetY;

            if(px < this.xEnd() && px > this.xStart() && py < this.yStart() && py > this.yEnd()) {

                this.renderShadowAndTooltip(px, py, px - this.xStart());

            } else {

                this.hideShadowAndTooltip();

            }

        })

    }

    renderShadowAndTooltip(x, y, bodyX) {

        let cutIndex = Math.floor(bodyX / this.everyWidth());

        this._shadow.transition().duration(50).ease(d3.easeLinear).attr('fill-opacity', .12).attr('x', cutIndex * this.everyWidth());

        if(x > this.quadrantWidth() - this._tooltip.style('width').slice(0,-2) - this._padding * 2) {

            x = x - this._tooltip.style('width').slice(0,-2) - this._padding * 2 - this._offset * 2;

        }

        if(y > this.quadrantHeight() - this._tooltip.style('height').slice(0,-2) - this._padding * 2) {

            y = y - this._tooltip.style('height').slice(0,-2) - this._padding * 2 - this._offset * 2;

        }

        this._tooltip.html(`${this._data[cutIndex][this._key]}<br/>数量统计: ${this._data[cutIndex][this._value]}`).transition().duration(100).ease(d3.easeLinear).style('display', 'inline-block').style('opacity', .6).style('left', `${x + this._offset + this._padding}px`).style('top', `${y + this._offset + this._padding}px`);

    }

    hideShadowAndTooltip() {
    this._shadow.transition().duration(10).attr('fill-opacity', 0);
    this._tooltip.transition().duration(50).style('opacity', 0).on('end', function() {d3.select(this).style('display', 'none')})
  }

    everyWidth() {

        return this.quadrantWidth() / this._data.length;

    }

    quadrantWidth() {

        return this._width - this._margins.left - this._margins.right;

    }

    quadrantHeight() {

        return this._height - this._margins.top - this._margins.bottom;

    }

    xStart() {

        return this._margins.left;

    }

    xEnd() {

        return this._width - this._margins.right;

    }

    yStart() {

        return this._height - this._margins.bottom;

    }

    yEnd() {

        return this._margins.top;

    }

    scaleX(a) {

        this._scaleX = this._scaleX.domain(a);

    }

    scaleY(a) {

        this._scaleY = this._scaleY.domain(a)

    }

    key(k) {

        if(!arguments.length) return this._key;

        this._key = k;

        this.scaleX(this._data.map(d => d[this._key]))

        return this;

    }

    value(v) {

        if(!arguments.length) return this._value;

        this._value = v;

        let arr = this._data.map(d => d[this._value]);

        let ele = Math.pow(10, d3.max(arr).toString().length - 1);

        let max = Math.ceil(d3.max(arr) / ele) * ele;

        this.scaleY([0, max]);

        return this;

    }

    data(data) {

        if(!arguments.length) return this._data;

        this._data = data;

        return this;

    }

}
2 CSS 文件很简单
.domain {

  stroke-width:;

  fill: none;

  stroke: #888;

  shape-rendering: crispEdges;

}

.x .tick line {

  opacity: 0  ;

}

.tick text {

  font-size: 14px;

}

.grid-line {

  fill: none;

  stroke: #888;

  opacity: .4;

  shape-rendering: crispEdges;

}

.bar {

  fill: #3398DB;

}

.tooltip{

  font-size: 15px;

  width: auto;

  padding: 10px;

  height: auto;

  position: absolute;

  text-align: center;

  background-color: #000000;

  opacity: .6;

  border-radius:5px;

  color: #ffffff;

  display: none;

}
3 加下来就是html文件
<!DOCTYPE html>
<html lang="en">
<head>
<meta charset="UTF-8">
<title>$Title$</title>
<link rel="stylesheet" type="text/css" href="css/base.css"/>
<script type="text/javascript" src="js/d3.v4.js"></script>
<script type="text/javascript" src="js/bar.js"></script>
</head>
<body>
<script>
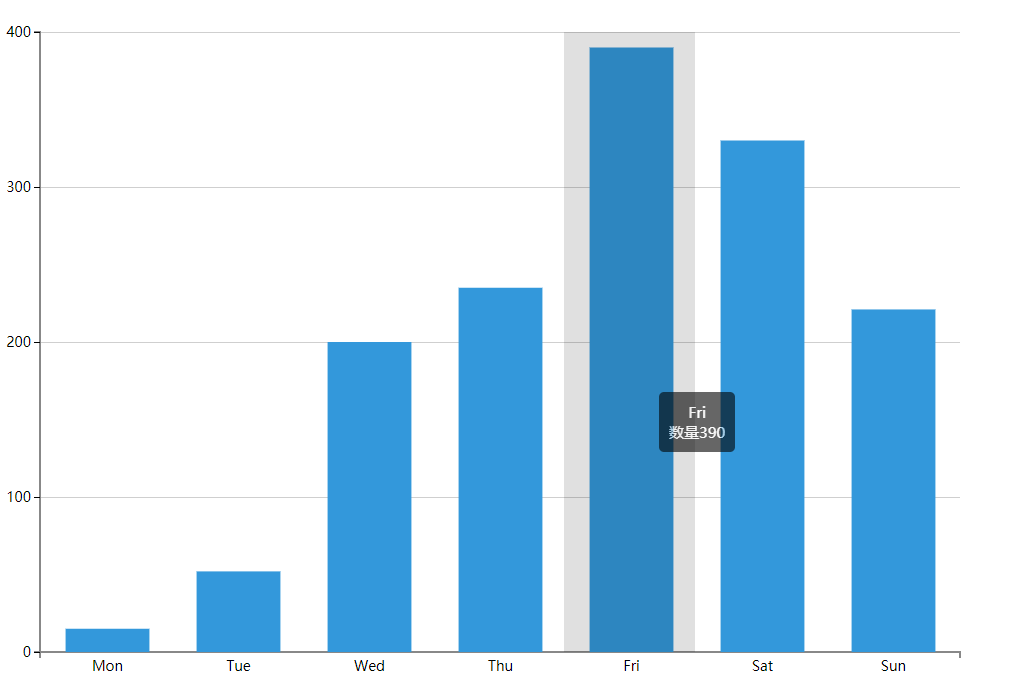
var dataset = [{date: 'Mon', label: 15},{date: 'Tue', label: 52},{date: 'Wed', label: 200},{date: 'Thu', label: 235},{date: 'Fri', label: 390},{date: 'Sat', label: 330},{date: 'Sun', label: 221}];
var bar = new Bar();
bar
.data(dataset)
.key('date')
.value('label')
.render();
</script>
</body>
</html>
4 接着是效果图
新上手的朋友们可以先学习一下ES6,然后在学习类的思想,d3.v3和v4 v5的版本差异比较大,直接学习d3.v4就可以了,最最后推荐一本书。D3 4.x数据可视化实战手册。这本书比较基础但是能够通过它养成良好的d3编程习惯。祝大家d3学习顺利。
如果想下载代码或者预览这个DEMO请移步到原文!!!
原文链接:http://www.bettersmile.cn
d3.js 教程 模仿echarts柱状图的更多相关文章
- d3.js 教程 模仿echarts折线图
今天我们来仿echarts折线图,这个图在echarts是折线图堆叠,但是我用d3改造成了普通的折线图,只为了大家学习(其实在简单的写一个布局就可以).废话不多说商行代码. 1 制作 Line 类 c ...
- d3.js 教程 模仿echarts legend功能
上一节记录没有加上echarts的legend功能,这一小节补一下. 1. 数据 我们可以从echarts中看出,折线数据并不是我们传进入的原始数据(多数情况下我们也不会修改原始数据),而是原始数组的 ...
- javascript实例教程使用canvas技术模仿echarts柱状图
canvas 画布是HTML5中新增的标签,可以通过js操作 canvas 绘图 API在网页中绘制图像. 百度开发了一个开源的可视化图表库ECharts,功能非常强大,可以实现折线图.柱状图.散点图 ...
- D3.js的v5版本入门教程(第三章)—— 选择元素和绑定数据
D3.js的v5版本入门教程(第三章) 在D3.js中,选择元素和绑定元素是最基本的内容,也是很重要的内容,等你看完整个教程后你会发现,这些D3.js教程都是在选择元素和绑定元素的基础上展开后续工作的 ...
- D3.js的v5版本入门教程(第九章)——完整的柱状图
D3.js的v5版本入门教程(第九章) 一个完整的柱状图应该包括的元素有——矩形.文字.坐标轴,现在,我们就来一一绘制它们,这章是前面几章的综合,这一章只有少量新的知识点,它们是 d3.scaleBa ...
- D3.js 入门教程
最近需要用到d3, 记录下d3的教程 网上搜了几个关于d3的教程 D3.js 入门教程 http://wiki.jikexueyuan.com/project/d3wiki/author.h ...
- 页面生成柱状图 --- D3.js
转载自:https://www.cnblogs.com/fastmover/p/7779660.html D3.js从入门到"放弃"指南 前言 近期略有点诸事不顺,趁略有闲余之时, ...
- D3.js的v5版本入门教程(第十一章)——交互式操作
D3.js的v5版本入门教程(第十一章) 与图形进行交互操作是很重要的!所谓的交互操作也就是为图形元素添加监听事件,比如说当你鼠标放在某个图形元素上面的时候,就会显示相应的文字,而当鼠标移开后,文字就 ...
- D3.js的v5版本入门教程(第八章)—— 坐标轴
D3.js的v5版本入门教程(第八章) D3中没有现成的坐标轴图形,需要我们自己用其他组件拼凑而成.D3中提供了坐标轴组件,使得我们在SVG中绘制一个坐标轴变得像添加一个普通元素那样简单 为了表绘制一 ...
随机推荐
- 01 | 健康之路 kubernetes(k8s) 实践之路 : 开篇及概况
近几年容器相关的技术大行其道,容器.docker.k8s.mesos.service mesh.serverless等名词相信大家多少都有听过,国内互联网公司无一不接触和使用相关技术. 健康之路早在2 ...
- CentOS7安装高版本gcc
CentOS7安装高版本gcc 下载 从hust镜像站下载gcc源码包. http://mirror.hust.edu.cn/gnu/gcc/ 我选择的是gcc-8.3.0.tar.gz. cd mk ...
- ASP.NET Core on K8S深入学习(2)部署过程解析与Dashboard
上一篇<K8S集群部署>中搭建好了一个最小化的K8S集群,这一篇我们来部署一个ASP.NET Core WebAPI项目来介绍一下整个部署过程的运行机制,然后部署一下Dashboard,完 ...
- Python实现网络多人聊天室
网络多人聊天室 文件结构: chatroom ├── client.py # 客户端代码 ├── language.py # 语言文件 ├── server.py # 服务端代码 └── set ...
- Linux基础进程管理优先级
一.进程优先级 Linux进程调度及多任务 每个cpu(或者cpu核心)在一个时间点上只能处理一个进程,通过时间片技术,Linux实际能够运行的进程(和线程数)可以超出实际可用的cpu及核心数量.Li ...
- 基于Spring注解的上下文初始化过程源码解析(二)
上一篇看完了register方法的代码,继续跟后面代码 后面执行refresh方法,代码清单如下: public void refresh() throws BeansException, Illeg ...
- java 各基本类型转 bytes 数组
java 将 基本类型转byte[] 数组时,需考虑大端小端问题 1. 大端格式下,基本类型与byte[]互转 BigByteUtil.java package com.ysq.util; impor ...
- Java中的时间二三事
实习过程中对于时间的处理有很多,有的还涉及到从数据库取出时间,所以做一些总结,想到那先写到哪,慢慢补充. 首先最常见的是java.util中的Date类,这个类封装了当前的日期和时间,它实际是计 ...
- 【C/C++】随机数的生成
C/C++:rand()函数 rand()函数的头文件:#include<stdlib.h> 该函数产生的随机数随机性差,速度慢,周期小(0-32767) 用法如下所示: #include ...
- red hat enterprise Linux 64 bit 配置IP
在win7 64位操作系统的台式机器上,安装了VMware® Workstation,9.0.1 build-894247.新建一个虚拟机安装linux.具体过程请搜索相关文档.安装的时候选择的网络连 ...