SpringBoot2.X&Prometheus使用
1、启动Prometheus
[root@ip101 prometheus-2.12.0.linux-amd64]# pwd

/opt/app/prometheus-2.12.0.linux-amd64

./prometheus --config.file=prometheus.yml  &

ps -ef|grep prometheus |grep -v grep
2、Prometheus 查看
2.1、Prometheus自身metrics
http://192.168.8.101:9090/metrics
2.2、 Prometheus自身graph
http://192.168.8.101:9090/graph
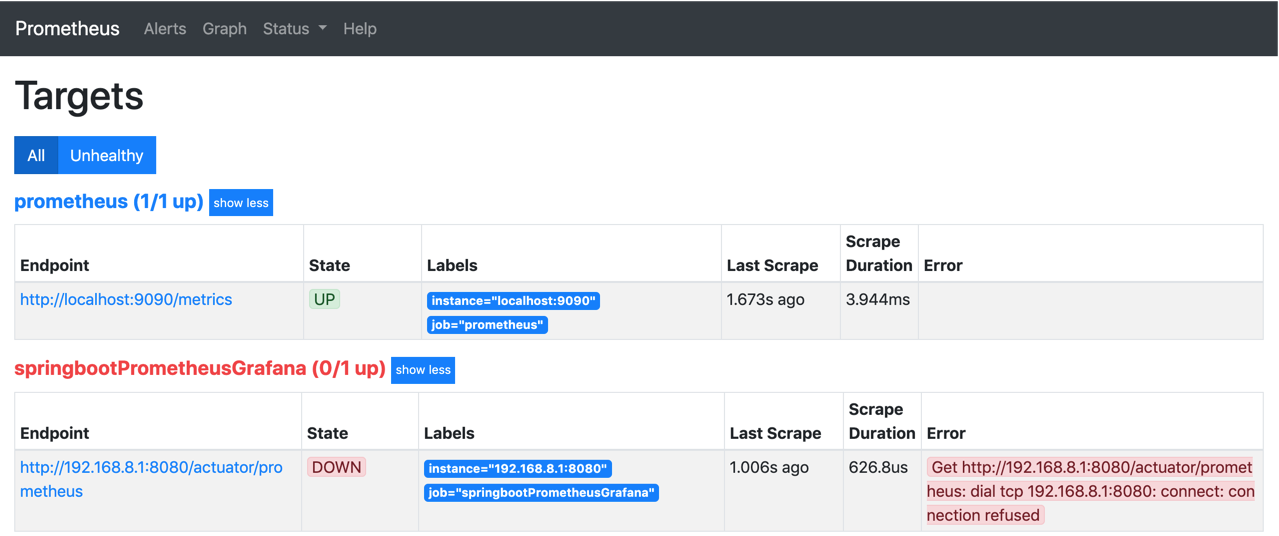
2.3、Prometheus自身targets
http://192.168.8.101:9090/targets
3、SpringBoot Actuator
server.port=8080

spring.application.name=springboot_prometheus

management.endpoints.web.exposure.include=*

management.metrics.tags.application=${spring.application.name}

#注意此处 如何配置为根目录的话,直接访问http://192.168.8.1:8080/prometheus

#http://192.168.8.1:8080/actuator/prometheus

management.endpoints.web.base-path=/actuator
Prometheus配置
global:

  scrape_interval: 15s

  scrape_timeout: 10s

  evaluation_interval: 15s

alerting:

  alertmanagers:

  - static_configs:

    - targets: []

    scheme: http

    timeout: 10s

    api_version: v1

scrape_configs:

- job_name: prometheus

  honor_timestamps: true

  scrape_interval: 15s

  scrape_timeout: 10s

  metrics_path: /metrics

  scheme: http

  static_configs:

  - targets:

    - localhost:9090

- job_name: springbootPrometheusGrafana

  honor_timestamps: true

  scrape_interval: 5s

  scrape_timeout: 5s

  metrics_path: /actuator/prometheus

  scheme: http

  static_configs:

  - targets:

    - 192.168.8.1:8080
访问SpringBoot的metrics_path: /actuator/prometheus
http://192.168.8.1:8080/actuator/prometheus
SpringBoot2.X&Prometheus使用的更多相关文章
- SpringBoot2配置prometheus浏览器访问404
背景:SpringBoot2的项目要配置 actuator + prometheus的健康检查,按照教程配置好之后再浏览器测试 http://localhost:port/prometheus 后40 ...
- SpringBoot2.x整合Prometheus+Grafana【附源码+视频】
图文并茂,新手入门教程,建议收藏 SpringBoot2.x整合Prometheus+Grafana[附源码+视频] 附源码+视频 目录 工程简介 简介 Prometheus grafana Spri ...
- Springboot2新特性概述
官方说明: https://github.com/spring-projects/spring-boot/wiki/Spring-Boot-2.0-Release-Notes 起码 JDK 8 和支持 ...
- Grafana+Prometheus打造springboot监控平台
1. 环境 springboot 1.5.10.RELEASE Grafana 5.4.2 Prometheus 2.6.0 jdk 1.8 2.通过micrometer与springboot应用和p ...
- 基于Docker+Prometheus+Grafana监控SpringBoot健康信息
在微服务体系当中,监控是必不可少的.当系统环境超过指定的阀值以后,需要提醒指定的运维人员或开发人员进行有效的防范,从而降低系统宕机的风险.在CNCF云计算平台中,Prometheus+Grafana是 ...
- 基于Prometheus搭建SpringCloud全方位立体监控体系
前提 最近公司在联合运维做一套全方位监控的系统,应用集群的技术栈是SpringCloud体系.虽然本人没有参与具体基础架构的研发,但是从应用引入的包和一些资料的查阅大致推算出具体的实现方案,这里做一次 ...
- 基于Prometheus和Grafana的监控平台 - 环境搭建
相关概念 微服务中的监控分根据作用领域分为三大类,Logging,Tracing,Metrics. Logging - 用于记录离散的事件.例如,应用程序的调试信息或错误信息.它是我们诊断问题的依据. ...
- 第七模块 :微服务监控告警Prometheus架构和实践
119.监控模式分类~1.mp4 logging:日志监控,Logging 的特点是,它描述一些离散的(不连续的)事件. 例如:应用通过一个滚动的文件输出 Debug 或 Error 信息,并通过日志 ...
- 3W字干货深入分析基于Micrometer和Prometheus实现度量和监控的方案
前提 最近线上的项目使用了spring-actuator做度量统计收集,使用Prometheus进行数据收集,Grafana进行数据展示,用于监控生成环境机器的性能指标和业务数据指标.一般,我们叫这样 ...
随机推荐
- mac 下拉取svn代码
svn checkout https://113.108.97.187/svn/zkteco/zks-app --username=lucy --password=lucy66 svn checkou ...
- fastadmin tp等模板变量在html中的js中如何使用?
<script> var a = {$b} </script>
- Jetson TX1 安装ROS操作系统
直接按照官网上的步骤安装即可,其中会出现很多bug,主要是依赖库安装的问题,添加清华源和中科大源,(注意:中科大源会有些问题)需要apt-get update 和 apt-get upgrade更新库 ...
- vim 绑定到 source insight 快捷键
1. optioons -> custom commands 2. 选择然后写入run命令: "D:\Program Files (x86)\Vim\vim74\gvim.exe&qu ...
- JAVA 从打包成jar到导入到IntelliJ IDEA使用
一. 使用常用命令打包: jar -cvf 目标jar包名称 待打包路径 例:jar -cvf myjar.jar com/dn/Demo 二. 打开IntelliJ IDEA (2017.2版本) ...
- Java语言基础(7)
1 for循环 案例:Demo1 1+1/2+1/3+1/4+1/5+1/6+...+1/100 = ? 1/1+1/2+1/3+1/4+1/5+1/6+...+1/100 = ? 分子都是1,分母是 ...
- java8学习之方法引用详解及默认方法分析
方法引用: 之前花了很多时间对Lambda表达式进行了深入的学习,接下来开启新的主题---方法引用(Method References),其实在之前的学习中已经使用过了,如: 那方法引用跟Lambda ...
- 第八章 watch监听 85 computed-计算属性的使用和3个特点
<!DOCTYPE html> <html lang="en"> <head> <meta charset="utf-8&quo ...
- js创建对象的几种方式(工厂模式、构造函数模式、原型模式)
普通方法创建对象 var obj = { name:"猪八戒", sayname:function () { alert(this.name); } } var obj1 = { ...
- 【JS】类型检测
本文首发于我的个人博客 : http://cherryblog.site/ 前言 js 中的类型检测也是很重要的一部分,所以说这篇文章我们就来讲一下怎么对 JavaScript 中的基本数据类型进行检 ...