Logistic Regression – Geometric Intuition
Logistic Regression – Geometric Intuition
Everybody who has taken a machine learning course probably knows the geometric intuition behind a support vector machine (SVM, great book): A SVM is a large margin classifier. In other words, it maximizes the geometric distance between the decision boundary and the classes of samples. Often you’ll find plots similar to this one:
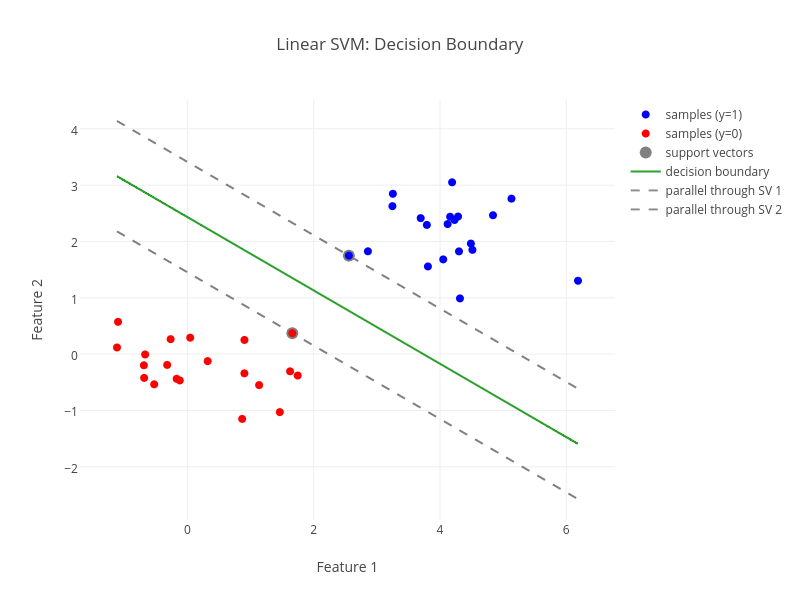
But what about logistic regression? What is the geometric intuition behind it and how does it compare to linear SVMs? Let’s find out.
Geometric intuition behind logistic regression
First, a quick reminder about the definition of the logistic function, given  features:

With that out of the way, let’s dive into the geometric aspects of logistic regression, starting with a toy example of only one feature:
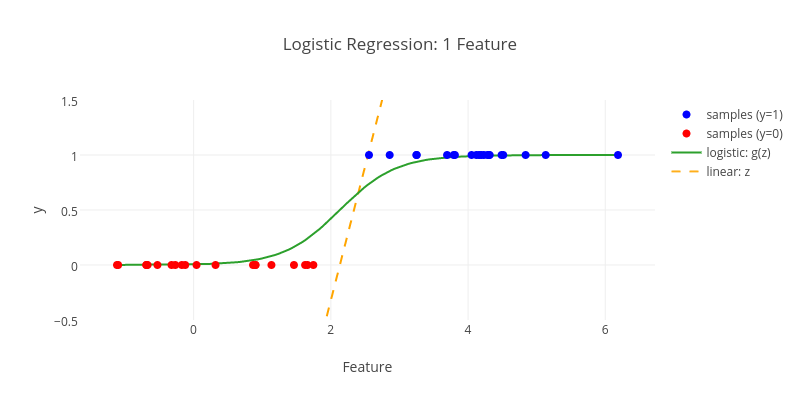
The blue samples of our feature data belong to class  , while the red dots are supposed to get assigned to
  . As we can see in the figure above, our data is fully separable and the logistic regression is able to demonstrate this property. From a geometric perspective, the algorithm essentially adds a new dimension for our dependent variable
  and fits a logistic function
  to the arising two-dimensional data in such a way that it separates the samples as good as possible within the range of
  . Once we have such a fitted curve, the usual method of prediction is to assign to everything
  and vice versa.
When thinking about logistic regression, I usually have its tight connection to linear regression somewhere in the back of my head (no surprise, both have “regression” as part of their names). Therefore, I was wondering what the line  would look like and added it to the plot. As we can easily see, differs significantly from the potential result of a linear regression for the given input data. While that was to be expected, I think it’s still nice to confirm it visually.
Note two details of the plot: For one, the logistic curve is not as steep as you might expect at first. This is due to the use of regularization, which logistic regression basically can’t live without. Second,  for
for  and not, as my intuition initially suggested, for
  . Not sure if this is particularly helpful, but I find it interesting nonetheless.
So far, so good. But what happens when we introduce an additional dimension? Let’s have a look at such a two feature scenario (feel free to pinch and zoom the plot):

What we see is the surface of the fitted logistic function for a classification task with two features. This time, instead of transforming a line to a curve, the equivalent happened for a plane. To make it easier to understand how to carry out predictions given such a model, the following plot visualizes the data points projected onto the surface of the logistic regression function:

Now we can again make decisions for our class based on a threshold  , which usually is
  :
:

So much about the geometric intuition behind logistic regression. Let’s see how that compares to linear SVMs.
Comparison of logistic regression to linear SVM
First of all, notice that with logistic regression we can use the value of a sample as a probability estimate for  . The responsive 3D-plots above created with the help of plotly’s fantastic library illustrate this property of logistic regression very well. I have yet to come across a real-world classification task where such probability estimates are not at least somewhat useful. Alas, SVMs (in their original version) aren’t able to provide them. Due to the way the model works, all it can tell you is whether a sample belongs to class or not.
I think at this point the most effective way of comparing logistic regression to linear SVM geometrically, is to add the decision boundary of logistic regression to the initial figure of the post. To make this happen, we need to project the decision boundary of the three-dimensional plot above onto the two-dimensional feature space. Doing so, we end up with the following figure:
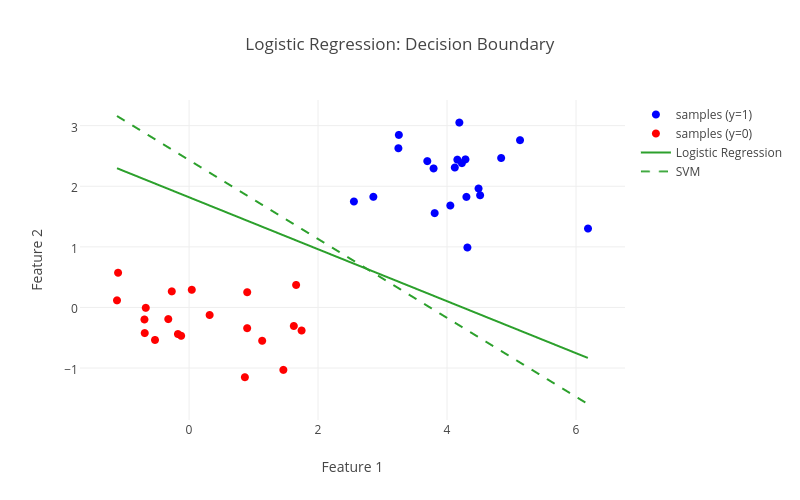
As we can see, the logistic regression does not follow the same large margin characteristic as a linear SVM. I’ll leave it to you to decide which is the better fit for the given data.
If you’d like to know further differences between logistic regression and linear SVMs aside from the geometrically motivated ones mentioned here, have a look at the excellent answers on quora.
The code for generating the plots of this post can be found on github.
Logistic Regression – Geometric Intuition的更多相关文章
- 课程一(Neural Networks and Deep Learning),第二周(Basics of Neural Network programming)—— 4、Logistic Regression with a Neural Network mindset
Logistic Regression with a Neural Network mindset Welcome to the first (required) programming exerci ...
- 机器学习 (三) 逻辑回归 Logistic Regression
文章内容均来自斯坦福大学的Andrew Ng教授讲解的Machine Learning课程,本文是针对该课程的个人学习笔记,如有疏漏,请以原课程所讲述内容为准.感谢博主Rachel Zhang 的个人 ...
- 逻辑回归 Logistic Regression
逻辑回归(Logistic Regression)是广义线性回归的一种.逻辑回归是用来做分类任务的常用算法.分类任务的目标是找一个函数,把观测值匹配到相关的类和标签上.比如一个人有没有病,又因为噪声的 ...
- logistic regression与SVM
Logistic模型和SVM都是用于二分类,现在大概说一下两者的区别 ① 寻找最优超平面的方法不同 形象点说,Logistic模型找的那个超平面,是尽量让所有点都远离它,而SVM寻找的那个超平面,是只 ...
- Logistic Regression - Formula Deduction
Sigmoid Function \[ \sigma(z)=\frac{1}{1+e^{(-z)}} \] feature: axial symmetry: \[ \sigma(z)+ \sigma( ...
- SparkMLlib之 logistic regression源码分析
最近在研究机器学习,使用的工具是spark,本文是针对spar最新的源码Spark1.6.0的MLlib中的logistic regression, linear regression进行源码分析,其 ...
- [OpenCV] Samples 06: [ML] logistic regression
logistic regression,这个算法只能解决简单的线性二分类,在众多的机器学习分类算法中并不出众,但它能被改进为多分类,并换了另外一个名字softmax, 这可是深度学习中响当当的分类算法 ...
- Stanford机器学习笔记-2.Logistic Regression
Content: 2 Logistic Regression. 2.1 Classification. 2.2 Hypothesis representation. 2.2.1 Interpretin ...
- Logistic Regression vs Decision Trees vs SVM: Part II
This is the 2nd part of the series. Read the first part here: Logistic Regression Vs Decision Trees ...
随机推荐
- 微信小程序中跳转另一个小程序
wx.navigateToMiniProgram({ appId: 'xxxxxxxxxxxxxxxxxx', // 要跳转的小程序的appid path: 'page/index/index', / ...
- Python读取ini配置文件封装方法
读取配置文件 ----rw_ini.py from configparser import ConfigParser def read_config(config_file_path:str): &q ...
- React笔记-首次渲染
渲染机制 渲染机制主要分为两部分: 首次渲染和更新渲染. 首次渲染 首先通过一个小例子,来讲解首次渲染过程. <!DOCTYPE html> <html lang="en& ...
- 使用devstack/pike部署多节点实验
目录 第一步:安装Ubuntu16.04 server并以stack为用户名创建用户 第二步:安装git及相关配置 第三步:安装Open vSwitch 2.5.X 第四步:获取devstack脚本 ...
- 父类与子类this相关问题
1.SinglyLinkedList: package No3_PolySinglyList; /*实现 带头结点的单链表SinglyLinkedList类*/ public class Singly ...
- 《Linux内核分析》第二周:操作系统是如何工作的
杨舒雯 20135324 北京电子科技学院 杨舒雯 原创作品转载请注明出处 <Linux内核分析>MOOC课程http://mooc.study.163.com/course/USTC-1 ...
- 框架-Spring
项目中都用到了Spring.Mybatis.SpringMVC框架,首先来谈一谈Spring框架,Spring框架以IOC.AOP作为主要思想. IOC----控制反转 IOC的全称为Inversio ...
- (Alpha)Let's-Chronos分数分配规则
Requirement: 每个团队开一个讨论会,协商讨论团队贡献分的分配方式.每个团队的团队贡献分为50分/人.每个人分数不能相同,请详细说明分数的分配规则. 为了完成此次的团队贡献分的分配任务,我们 ...
- Alpha答辩总结
[Alpha展示评审表格] 小组序号 小组名称 格式(20%) 内容(20%) PPT(20%) 演讲(20%) 答辩(20%) 总分 1 天机组 15 15 15 15 16 76 2 PMS 16 ...
- Window环境下RabbitMQ 添加用户、设置角色和权限
基本上新增用户.角色和权限的方法都一样,大概如下: REM 添加一个帐号 密码 rabbitmqctl.bat add_user zhangfujun zhangfujun123 REM 添加角色 r ...