Python Pandas 时间序列双轴折线图
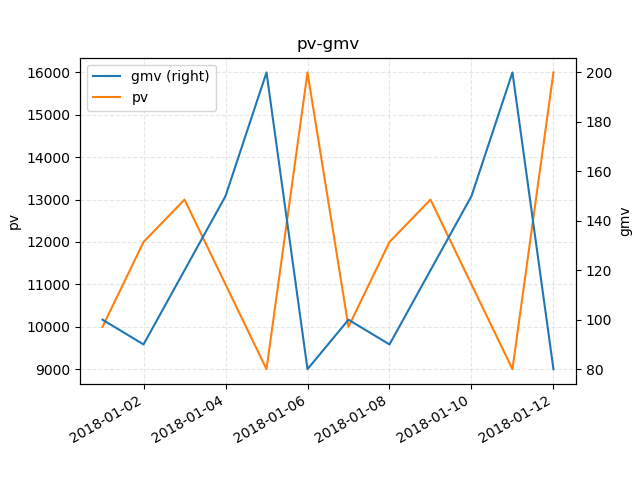
时间序列pv-gmv双轴折线图
import numpy as np

import pandas as pd

import matplotlib.pyplot as plt

n = 12

date_series = pd.date_range(start='2018-01-01', periods=n, freq="D")

data = {

    'pv': [10000, 12000, 13000, 11000, 9000, 16000, 10000, 12000, 13000, 11000, 9000, 16000],

    'gmv': [100, 90, 120, 150, 200, 80, 100, 90, 120, 150, 200, 80]

}

df = pd.DataFrame(data, index=date_series)

ax = df.plot(

    secondary_y=['gmv'],

    x_compat=True,

    grid=True)

ax.set_title("pv-gmv")

ax.set_ylabel('pv')

ax.grid(linestyle="--", alpha=0.3)

ax.right_ax.set_ylabel('gmv')

plt.show()
import math
import numpy as np
import pandas as pd
import matplotlib.pyplot as plt n = 12
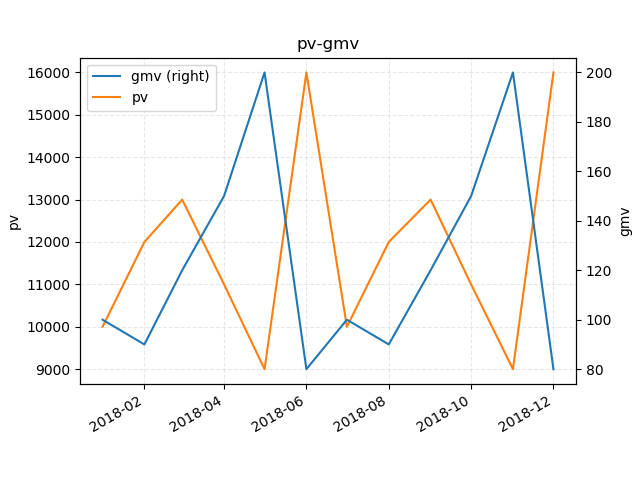
date_series = pd.period_range(start='2018-01', periods=n, freq="M") data = {
'pv': [10000, 12000, 13000, 11000, 9000, 16000, 10000, 12000, 13000, 11000, 9000, 16000],
'gmv': [100, 90, 120, 150, 200, 80, 100, 90, 120, 150, 200, 80]
} df = pd.DataFrame(data, index=date_series) ax = df.plot(
secondary_y=['gmv'],
x_compat=True,
grid=True) ax.set_title("pv-gmv")
ax.set_ylabel('pv')
ax.grid(linestyle="--", alpha=0.3) ax.right_ax.set_ylabel('gmv') plt.show()
Python Pandas 时间序列双轴折线图的更多相关文章
- 4-Highcharts曲线图之时间轴折线图
鼠标按住左键 左右移动可以试试<!DOCTYPE> <html lang='en'> <head> <title>4-Highcharts曲线图之时间轴 ...
- highcharts.js的时间轴折线图
工作中正好用到. 鼠标按住左键 左右移动可以试试 <!DOCTYPE> <html lang='en'> <head> <title>4-Highcha ...
- python的turtle模块画折线图
代码如下: import turtle yValues = [10.0,7.4,6.4,5.3,4.4,3.7,2.6] def main(): t = turtle.Turtle() t.hidet ...
- echarts双y轴折线图柱状图混合实时更新图
先看下效果,自己用ps做了张gif图,发现很好玩啊..不喜勿喷 自己下载个echarts.min.js 直接上代码: <!DOCTYPE html><html><head ...
- Python——Pandas 时间序列数据处理
介绍 Pandas 是非常著名的开源数据处理库,我们可以通过它完成对数据集进行快速读取.转换.过滤.分析等一系列操作.同样,Pandas 已经被证明为是非常强大的用于处理时间序列数据的工具.本节将介绍 ...
- python ---Pandas时间序列:生成指定范围的日期
引入包 import pandas as pd import numpy as np 1.生成指定范围的日期 print pd.date_range('11/1/2018','11/9/2018') ...
- python画最最简单的折线图
# encoding=utf-8import matplotlib.pyplot as pltfrom pylab import * #支持中文mpl.rcParams['font.sans-seri ...
- pandas 数据可视化之折线图
官网地址:https://openpyxl.readthedocs.io/en/stable/charts/line.html#id1 openpyxl+pandas # coding=utf-8 i ...
- matlab 双坐标折线图画法
%%各时段电量需求 clc close all clear all cost_gd = [2200 1800 3800 4600]; cost_bj = [2.7 2.2 1.8 3.6]; cost ...
随机推荐
- poj3268 Silver Cow Party(两次dijkstra)
https://vjudge.net/problem/POJ-3268 一开始floyd超时了.. 对正图定点求最短,对逆图定点求最短,得到任意点到定点的往返最短路. #include<iost ...
- pygame 笔记-8 背景音乐&子弹音效
游戏哪能没有音效?这节我们研究下如何加背景音乐,其实也很简单: # 加载背景音乐 pygame.mixer.music.load(music_base_path + "music.mp3&q ...
- MAC终端密钥登录自动输入密码
升级MAC系统后,发现用于MAC终端ssh服务器的登录脚本无法正常执行了,表现为:需要手动输入密钥密码,于是重新整理一下,恢复正常,在此记录一下: #!/usr/bin/expect -fspawn ...
- jquery动态添加元素无法触发绑定的事件的解决方案
方法一:绑定live事件(live事件只在jquery1.9以下才支持,高版本不支持). //jquery 1.9(不包括1.9)以下可以 $(".btn").live(" ...
- WPF中,输入完密码回车提交 ,回车触发按钮点击事件
类似与winform中窗体的AcceptButton属性,在wpf中,需要将按钮的IsDefault设置为true就行.
- http重定向到https
<?xml version="1.0" encoding="UTF-8"?> <configuration> <system.we ...
- servlet的xx方式传值中文乱码
protected void doGet(HttpServletRequest req, HttpServletResponse resp) throws ServletException, IOEx ...
- WebApp开发技术搭配
一:Ionic + angular + cordova + zipalign UI框架:lonic+angular 开发与编译打包框架:Cordova 优化工具:zipalign 二:MUI+HBui ...
- Python之Simple FTP (一)
一.引言: 好久之前想写一个ftpserver的小daemon,但是一直拖着就没有写,这回正好处于放假的时候可以有时间来写写. 二.FTP需求功能: 1.用户认证系统 2.文件上传和下载功能 a.支持 ...
- 《Java 9 揭秘》全目录汇总
Tips 做一个终身学习的人. 当写这篇文章时,关于Java 9的学习就先告一段落了. 首先介绍一下背景,大概两个月前,我突然有兴趣想看看Java 9,当时读了一本英文原著<Java 9 Rev ...