Python Pandas 时间序列双轴折线图
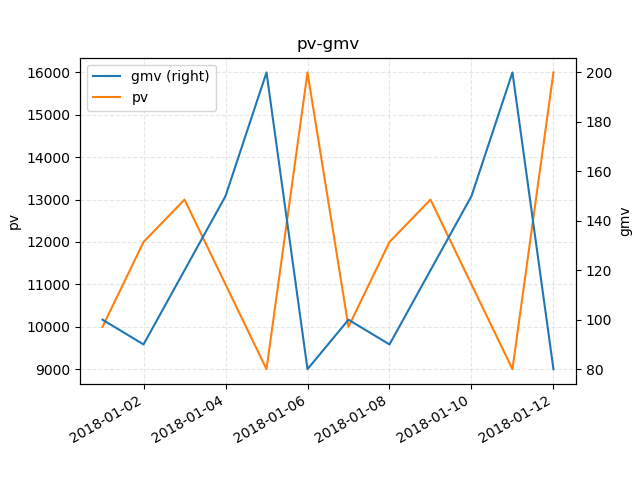
时间序列pv-gmv双轴折线图
import numpy as np

import pandas as pd

import matplotlib.pyplot as plt

n = 12

date_series = pd.date_range(start='2018-01-01', periods=n, freq="D")

data = {

    'pv': [10000, 12000, 13000, 11000, 9000, 16000, 10000, 12000, 13000, 11000, 9000, 16000],

    'gmv': [100, 90, 120, 150, 200, 80, 100, 90, 120, 150, 200, 80]

}

df = pd.DataFrame(data, index=date_series)

ax = df.plot(

    secondary_y=['gmv'],

    x_compat=True,

    grid=True)

ax.set_title("pv-gmv")

ax.set_ylabel('pv')

ax.grid(linestyle="--", alpha=0.3)

ax.right_ax.set_ylabel('gmv')

plt.show()
import math
import numpy as np
import pandas as pd
import matplotlib.pyplot as plt n = 12
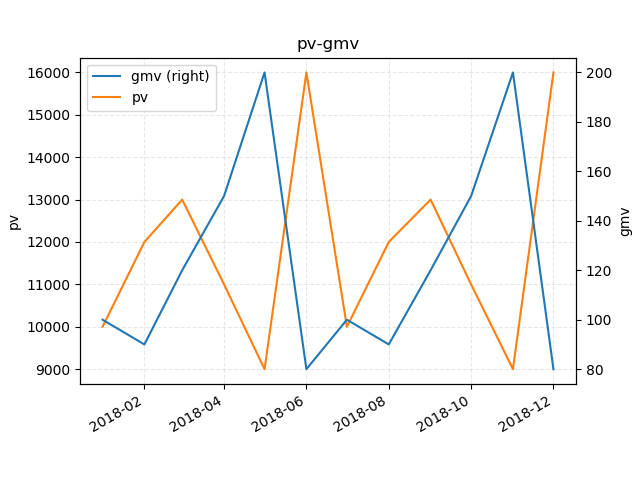
date_series = pd.period_range(start='2018-01', periods=n, freq="M") data = {
'pv': [10000, 12000, 13000, 11000, 9000, 16000, 10000, 12000, 13000, 11000, 9000, 16000],
'gmv': [100, 90, 120, 150, 200, 80, 100, 90, 120, 150, 200, 80]
} df = pd.DataFrame(data, index=date_series) ax = df.plot(
secondary_y=['gmv'],
x_compat=True,
grid=True) ax.set_title("pv-gmv")
ax.set_ylabel('pv')
ax.grid(linestyle="--", alpha=0.3) ax.right_ax.set_ylabel('gmv') plt.show()
Python Pandas 时间序列双轴折线图的更多相关文章
- 4-Highcharts曲线图之时间轴折线图
鼠标按住左键 左右移动可以试试<!DOCTYPE> <html lang='en'> <head> <title>4-Highcharts曲线图之时间轴 ...
- highcharts.js的时间轴折线图
工作中正好用到. 鼠标按住左键 左右移动可以试试 <!DOCTYPE> <html lang='en'> <head> <title>4-Highcha ...
- python的turtle模块画折线图
代码如下: import turtle yValues = [10.0,7.4,6.4,5.3,4.4,3.7,2.6] def main(): t = turtle.Turtle() t.hidet ...
- echarts双y轴折线图柱状图混合实时更新图
先看下效果,自己用ps做了张gif图,发现很好玩啊..不喜勿喷 自己下载个echarts.min.js 直接上代码: <!DOCTYPE html><html><head ...
- Python——Pandas 时间序列数据处理
介绍 Pandas 是非常著名的开源数据处理库,我们可以通过它完成对数据集进行快速读取.转换.过滤.分析等一系列操作.同样,Pandas 已经被证明为是非常强大的用于处理时间序列数据的工具.本节将介绍 ...
- python ---Pandas时间序列:生成指定范围的日期
引入包 import pandas as pd import numpy as np 1.生成指定范围的日期 print pd.date_range('11/1/2018','11/9/2018') ...
- python画最最简单的折线图
# encoding=utf-8import matplotlib.pyplot as pltfrom pylab import * #支持中文mpl.rcParams['font.sans-seri ...
- pandas 数据可视化之折线图
官网地址:https://openpyxl.readthedocs.io/en/stable/charts/line.html#id1 openpyxl+pandas # coding=utf-8 i ...
- matlab 双坐标折线图画法
%%各时段电量需求 clc close all clear all cost_gd = [2200 1800 3800 4600]; cost_bj = [2.7 2.2 1.8 3.6]; cost ...
随机推荐
- 4、css属性操作
前面说的主要是css的使用规则和选择器等,这篇主要讲解css的具体使用. 本篇导航: css text 背景属性 边框属性 列表属性 dispaly属性 外边距(margine)和内边距(paddin ...
- 控制WinForm中Tab键的跳转
一,需求 在Winform中,默认情况下,按下Tab键,光标会按照我们设定的TabIndex值从小到大进行跳转. 但如果用户要求按下Tab键跳转到特定的控件,这种要求还是很合理的,比如用户只想输入几个 ...
- Android定制:修改开机启动画面
转自:https://blog.csdn.net/godiors_163/article/details/72529210 引言 Android系统在按下开机键之后就会进入启动流程,这个过程本身需要一 ...
- nltk 的分词器punkt: ssl问题无法下载
报错: LookupError: ********************************************************************** Resource pu ...
- [Vuex] Lazy Load a Vuex Module at Runtime using TypeScript
Sometimes we need to create modules at runtime, for example depending on a condition. We could even ...
- [Python设计模式] 第20章 挨个买票——迭代器模式
github地址:https://github.com/cheesezh/python_design_patterns 迭代器模式 迭代器模式,提供一种方法顺序访问一个聚合对象中各个元素,而又不暴露该 ...
- Android获取通讯录并上传(包含通讯录加密)
好久没更新文章了,近期在做通讯录上传,把它分享出来,送给需要的朋友. 写了一个通讯录工具类,直接放代码吧,关键位置通过注释来解释. 这个工具类包含通讯录获取,加密,然后上传操作.看不懂的可以留言 im ...
- Docker在windows下的使用【一】
1.windows按照docker的基本要求 (1)64为操作系统,win7或者更高 (2)支持“ Hardware Virtualization Technology”,并且,“virtualiza ...
- 多线程处理N维度topk问题demo--[c++]
问题 -对多维度特征进行topk排序,使用c++ 优先队列模拟最大堆. /* ---------------------------------- Version : ?? File Name : d ...
- MYSQL单表可以存储多少条数据???
MYSQL单表可以存储多少条数据??? 单表存储四千万条数据,说MySQL不行的自己打脸吧. 多说一句话,对于爬虫来说,任何数据库,仅仅是存储数据的地方,最关心的是 能否存储数据和存储多少数据以及存储 ...