
python中建模分析零息票收益率曲线--复利和连续复利
收益率曲线(Yield Curve)是显示一组货币和信贷风险均相同,但期限不同的债券或其他金融工具收益率的图表。纵轴代表收益率,横轴则是距离到期的时间。在此用python建模分析零息票收益率曲线,输出图表并制图。
首先要理解收益率的计算方法,然后计算出连续复利和复利。再根据计算步骤在python中编写代码建模
此为连续复利的计算
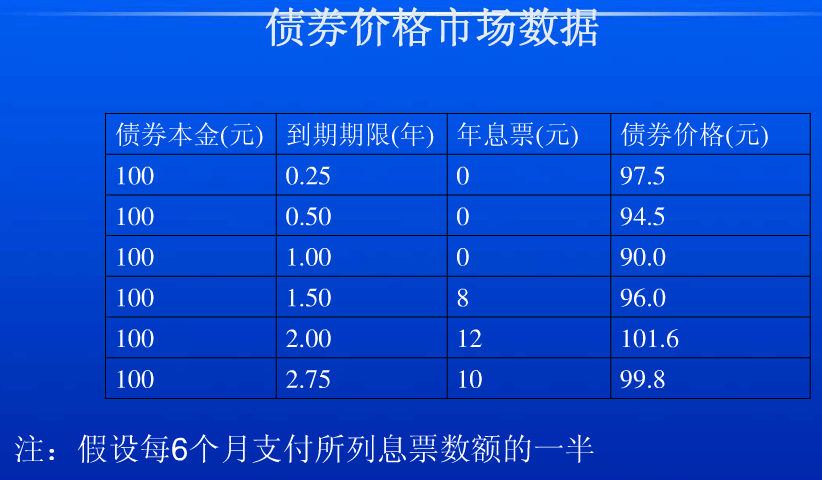
 # 没有年息票的一年期以内的零息票年收益率YTM=(log(面值/价格))/期限
 r1 = np.log(100/97.5)/0.25
 r2 = np.log(100/94.9)/0.5
 r3 = np.log(100/90)/1
 print('第0.25年年息票收益率:',round(r1,5))
 print('第0.5年年息票收益率:',round(r2,5))
 print('第1年年息票收益率:',round(r3,5))
 #每半年付息一次的有年息票的零息票年收益率YTM:零息票年收益率=[log((年息票/2+面值)/(债券价格-年息票/2*(前期价格/面值)))]/期限
 #价格=(年息票/2)*e^(-r2*0.5)+(年息票/2)*e^(-r3*1)+(年息票/2+面值)*e^(-r4*1.5)
 # r4=[log(104/(94-(94.9+90)/100)]/1.5
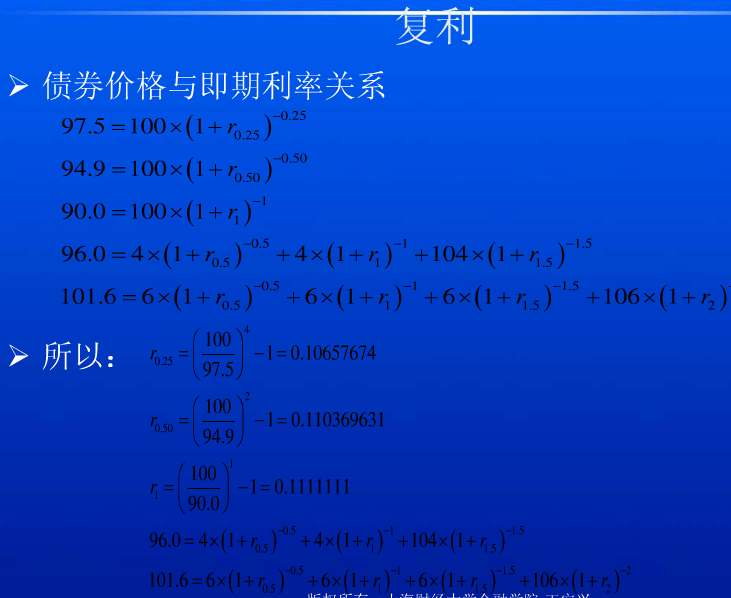
 #超过一年期的零息票年收益率YTM=(面值/价格)开期限n的次方根减1
 rate2 = math.pow(100 / 84.99, float(1) / float(3))-1
 print(rate2)
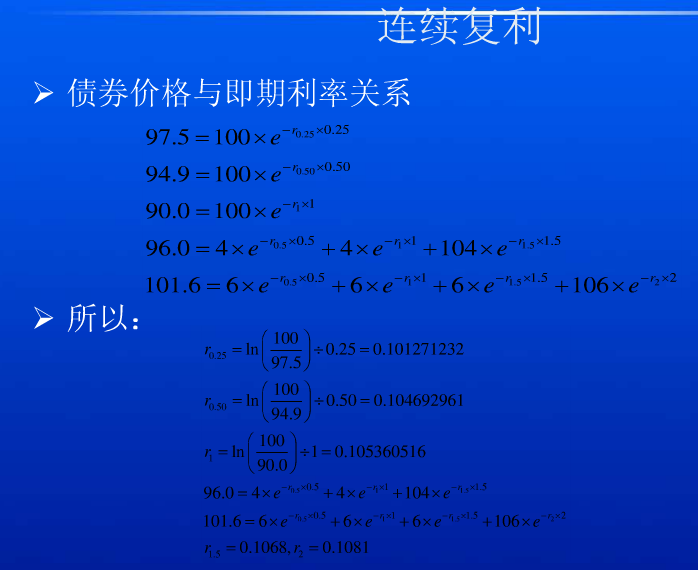
 # 96=4*(1+0.5*r2)^-1+4*(1+r3)^-1+104*(1+r4)^-1.5
 r4 = np.log(104/88.604)/1.5
 print('第1.5年年息票收益率:',round(r4,5))

 r5 = np.log(106/(101.6-(1.849*6+88.604/104*6)))/2#np.log(106/85.394)/2
 print('第2年年息票收益率:',round(r5,5))
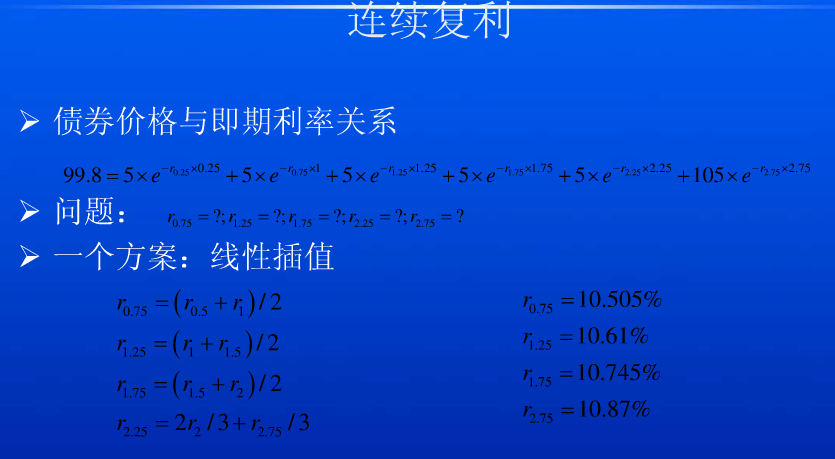
 #线性插值
 #第0.75年年息票收益率:
 r6 = (r2+r3)/2
 print('第0.75年年息票收益率:',round(r6,5))
 #第1.25年年息票收益率:
 r7 = (r3+r4)/2
 print('第1.25年年息票收益率:',round(r7,5))
 #第1.75年年息票收益率:
 r8 = (r4+r5)/2
 print('第1.75年年息票收益率:',round(r8,5))
 #第2.25年年息票收益率:
 # r9 = 2(r5)/3 +(r'第2.75年年息票收益率')/3
 # print('第2.25年年息票收益率:',round(r9,5))
1.我们需要在python中加载相应的模块来进行开发调式
 import pandas as pd
 import numpy as np
 import matplotlib.pyplot as plt
 import math
 import os
 import operator
 import sys#实现从程序外部向程序传递参数。
 import xlrd
2.确定输入及输出的文件路径,读取文件
 InputPath=sys.argv[1]#输入路径
 OutputPath=sys.argv[2]#输出路径
 filePath = InputPath#处理的文件为在输入路径中读取的文件
3.明确表中的字段,定义两个空字典输出计算的数值

上表为输入表,根据表中的字段来计算收益率,Period为付息频率,我们需要取CouponFrequency中的最大值来进行计算
 df = pd.read_excel(filePath)
 bondsCount = df.shape[0]

 dicE4Calc = {}#定义一个空的价格比计算表。价格/面值
 dicResult = {}#定义一个空的结果表

 Period = 1 / df['CouponFrequency'].max()#步长为0.5
4.定义一个价格合计,根据这个合计来进行迭代计算
 def getPreSum(pCoupon, targetTerm, startTerm):#前期价格合计
     sum = 0
     p = startTerm
     while (p < targetTerm):#要小于目标的期限
         sum += dicE4Calc[str(p)] * pCoupon
         p += Period#期限以0.5递增

     return sum#返回的是新计算出来的价格
5.定义线性插值法计算,利用前后两期数据可以求出中间的值
 def LinearInterpolation(pCoupon, targetTerm, interval):#线性插值法利用中位数求利率
     sum = 0
     p = interval
     while p < targetTerm:
         if str(p) not in dicResult:#结果表中没有的数据,left为前面一期,right为后面一期
             r_Left = str(p - interval)
             r_Right = str(p + interval)

             if r_Left in dicResult and r_Right in dicResult:#结果表中有前后的数据就用插值法计算
                 r = (dicResult[r_Left] + dicResult[r_Right]) / 2

             elif r_Left in dicResult and r_Right not in dicResult:#有前面的数据没有后面的数据
                 r_Left2 = str(p - interval - interval)#left为前2期
                 r = dicResult[r_Left2] + (dicResult[r_Left] - dicResult[r_Left2]) / (interval) * (p - float(r_Left2))

             dicResult[str(p)] = r
             dicE4Calc[str(p)] = pow(math.e, -r * p)#e的(-r*p)次方

         p += interval
6.读取表格
df['Coupon']=df['Coupon'].fillna(0)#若Coupon为空值则填充为0
for i in range(bondsCount):#读取表格中对应的列

    FaceValue = df.loc[i, 'FaceValue']
    Price = df.loc[i, 'Price']
    Term = df.loc[i, 'Term_Y']
    Coupon = df.loc[i, 'Coupon']
    CouponFrequency = df.loc[i, 'CouponFrequency']
    YTM = 0
    e4Calc = 0
7.计算有年息和无年息的收益率
  if Coupon == 0:

         e4Calc = Price / FaceValue

         YTM = math.log(FaceValue / Price) / Term

     else:#有息票的计算
         PeriodCoupon = Coupon * Period#年息票的0.5

         if Term % Period == 0:#从0.5年开始
             LinearInterpolation(PeriodCoupon, Term, Period)
             e4Calc = (Price - getPreSum(PeriodCoupon, Term, Period)) / (FaceValue + PeriodCoupon)

         else:#不是从0.5开始,需要在起始日期以0.5年递增
             LinearInterpolation(PeriodCoupon, Term, Term % Period)
             e4Calc = (Price - getPreSum(PeriodCoupon, Term, Term % Period)) / (FaceValue + PeriodCoupon)

         YTM = math.log(1 / e4Calc) / Term

     dicE4Calc[str(Term)] = e4Calc
     dicResult[str(Term)] = round(YTM, 9)
8.把计算结果写到输出表中
 sorted_dicResult = sorted(dicResult.items(),key =operator.itemgetter(0))#把求出的收益率按期限排序,把字典转为列表
 # print(dicResult)
 print(sorted_dicResult)
 Term = [i[0] for i in sorted_dicResult ]#遍历列表中的期限
 Yield = [i[1] for i in sorted_dicResult ]#遍历列表中的
 data={"Term":Term,"Yield":Yield}
 columns=['Term','Yield']
 df=pd.DataFrame(data=data,columns=columns)
 df['TermBase']='Y'
 df = df.set_index("TermBase")
 df.to_excel(OutputPath,sheet_name='OutPut')

 print(df)
9.绘制出收益率曲线图
 x = Term
 y = Yield
 plt.plot(x,y)
 plt.xlabel('CouponFrequency')#期限
 plt.ylabel('YTM')#收益率
 plt.title('Zero coupon yield curve')#命名
 plt.show()
最终结果如下:

复利的计算也类似,完整代码如下:
 #复利计算
 import pandas as pd
 import numpy as np
 import matplotlib.pyplot as plt
 import math
 import os
 import operator
 import sys
 import xlrd
 from openpyxl import Workbook
 from openpyxl import load_workbook
 from openpyxl.utils import get_column_letter
 from openpyxl.compat import range

 InputPath=sys.argv[1]
 OutputPath=sys.argv[2]
 print(InputPath)
 print(OutputPath)

 filePath = InputPath
 df = pd.read_excel(filePath)
 bondsCount = df.shape[0]
 dicE4Calc = {}
 dicResult = {}
 Period = 0.5

 def getPreSum(pCoupon, targetTerm, startTerm):
     sum = 0
     p = startTerm
     while (p < targetTerm):
         sum += dicE4Calc[str(p)] * pCoupon
         p += Period

     return sum

 def LinearInterpolation(pCoupon, targetTerm, interval):
     sum = 0
     p = interval
     while p < targetTerm:
         if str(p) not in dicResult:
             r_Left = str(p - interval)
             r_Right = str(p + interval)

             if r_Left in dicResult and r_Right in dicResult:
                 r = (dicResult[r_Left] + dicResult[r_Right]) / 2

             elif r_Left in dicResult and r_Right not in dicResult:
                 r_Left2 = str(p - interval - interval)
                 r = dicResult[r_Left2] + (dicResult[r_Left] - dicResult[r_Left2]) / (interval) * (p - float(r_Left2))

             dicResult[str(p)] = r
             dicE4Calc[str(p)] = pow(math.e, -r * p)

         p += interval
 Period = 1 / df['CouponFrequency'].max()
 df['Coupon']=df['Coupon'].fillna(0)
 for i in range(bondsCount):

     FaceValue = df.loc[i, 'FaceValue']
     Price = df.loc[i, 'Price']
     Term = df.loc[i, 'Term_Y']
     Coupon = df.loc[i, 'Coupon']
     CouponFrequency = df.loc[i, 'CouponFrequency']
     YTM = 0
     e4Calc = 0

     if Coupon == 0:

         e4Calc = Price / FaceValue

         YTM = pow(FaceValue / Price,1/ Term) -1

     else:
         PeriodCoupon = Coupon * Period

         if Term % Period == 0:
             LinearInterpolation(PeriodCoupon, Term, Period)

             e4Calc = (Price - getPreSum(PeriodCoupon, Term, Period)) / (FaceValue + PeriodCoupon)

         else:

             LinearInterpolation(PeriodCoupon, Term, Term % Period)
             e4Calc = (Price - getPreSum(PeriodCoupon, Term, Term % Period)) / (FaceValue + PeriodCoupon)

         YTM = pow(1 / e4Calc,1/ Term) - 1

     dicE4Calc[str(Term)] = e4Calc
     dicResult[str(Term)] = round(YTM, 9)

 # print(dicE4Calc)
 # print(dicResult)

 sorted_dicResult = sorted(dicResult.items(),key =operator.itemgetter(0))
 # print(dicResult)
 print(sorted_dicResult)
 Term = [i[0] for i in sorted_dicResult ]
 Yield = [i[1] for i in sorted_dicResult ]

 data={"Term":Term,"Yield":Yield}
 columns=['Term','Yield']
 df=pd.DataFrame(data=data,columns=columns)
 df['TermBase']='Y'
 df = df.set_index("TermBase")
 df.to_excel(OutputPath,sheet_name='OutPut')
 print(df)

 x = Term
 y = Yield
 plt.plot(x,y)
 plt.xlabel('CouponFrequency')
 plt.ylabel('YTM')
 plt.title('Zero coupon yield curve')
 plt.show()
python中建模分析零息票收益率曲线--复利和连续复利的更多相关文章
- Python中利用LSTM模型进行时间序列预测分析
时间序列模型 时间序列预测分析就是利用过去一段时间内某事件时间的特征来预测未来一段时间内该事件的特征.这是一类相对比较复杂的预测建模问题,和回归分析模型的预测不同,时间序列模型是依赖于事件发生的先后顺 ...
- Python中if __name__=="__main__" 语句在调用多进程Process过程中的作用分析
2018年2月27日 于创B515 引言 最近准备学习一下如何使用Python中的多进程.在翻看相关书籍.网上资料时发现所有代码都含有if __name__=="__main__" ...
- 《构建之法》教学笔记——Python中的效能分析与几个问题
<构建之法:现代软件工程>中第2章对效能分析进行了介绍,基于的工具是VSTS.由于我教授的学生中只有部分同学选修了C#,若采用书中例子讲解,学生可能理解起来比较困难.不过所有这些学生都学习 ...
- Python中方法的缺省参数问题分析
引言: 在Python中可以缺省给方法制定缺省值,但是这个缺省值在某些情况下确是和我们预期不太一致的-... 这个诡异的问题,曾经困然了我几天时间,才最终定位出来-.. 测试代码 from datet ...
- Python中的单继承与多继承实例分析
Python中的单继承与多继承实例分析 本文实例讲述了Python中的单继承与多继承.分享给大家供大家参考,具体如下: 单继承 一.介绍 Python 同样支持类的继承,如果一种语言不支持继承,类就没 ...
- 分析Python中解析构建数据知识
分析Python中解析构建数据知识 Python 可以通过各种库去解析我们常见的数据.其中 csv 文件以纯文本形式存储表格数据,以某字符作为分隔值,通常为逗号:xml 可拓展标记语言,很像超文本标记 ...
- Python中的浮点数原理与运算分析
Python中的浮点数原理与运算分析 本文实例讲述了Python中的浮点数原理与运算.分享给大家供大家参考,具体如下: 先看一个违反直觉的例子: >>> s = 0. > ...
- 第8.23节 Python中使用sort/sorted排序与“富比较”方法的关系分析
一. 引言 <第8.21节 Python中__lt__.gt__等 "富比较"("rich comparison")方法用途探究>和<第8.2 ...
- python中xrange用法分析
本文实例讲述了python中xrange用法.分享给大家供大家参考.具体如下: 先来看如下示例: >>> x=xrange(0,8) >>> print x xra ...
随机推荐
- oracle数据库连接 ORA-12638:身份证明检索失败
连数据库的时候突然报了一个这个 查找各种办法,发现自己从10g换成了11g,不过这个没有什么关系,跟oracle的安全设置有关系, 首先从开始菜单找到Net Manager 打开,选择本地,概要文件, ...
- [Leetcode 18]四数之和 4 Sum
[题目] Given an array nums of n integers and an integer target, are there elements a, b, c, and d in n ...
- python 实现求一个集合的子集
概要 今天偶然看到有个关于数学中集合的问题,就突发奇想的想用python实现下求一个集合的子集. 准备 我当然先要复习下,什么是集合,什么是子集? 比较粗犷的讲法,集合就是一堆确定的东西,细致一点的讲 ...
- Java 1.7 NQuery
package org.rx.common; import java.lang.reflect.Array; import java.util.*; /** * Created by wangxiao ...
- ionic3 使用swiper插件 实现轮播效果
由于app的更新迭代 我需要完成新版本设计图的开发 刚开始就遇到一个问题 首页的banner图需要实现某种效果 而ionic3自带的轮播图效果怎么改都改不到我想要的效果 效果图如下 自动播放 不断 ...
- ngnix——FastCGI 相关参数调优
当 LNMP 组合工作时,首先是用户通过浏览器输入域名请求 Nginx Web 服务,如果请求的是静态资源,则由 Nginx 解析返回给用户:如果是动态请求(如 PHP),那么 Nginx 就会把它通 ...
- cornerstone 使用-图标含义-分支-合并
http://www.jianshu.com/p/7f5c019c528b http://www.cnblogs.com/fyongbetter/p/5404697.html
- Cordova使用极光推送的方法
1.在极光推送官网注册账号.应用,注意注册的包名要和app的包名一致 2.添加插件 cordova plugin add jpush-phonegap-plugin --variable APP_KE ...
- wc语法
统计当前目录下的所有文件行数: wc -l * 当前目录以及子目录的所有文件行数: find . * | xargs wc -l 可以把*改成所要匹配的文件,例如Java文件,*.java这样就只统 ...
- 【转载】 强化学习(九)Deep Q-Learning进阶之Nature DQN
原文地址: https://www.cnblogs.com/pinard/p/9756075.html ------------------------------------------------ ...