centos中单进程监控
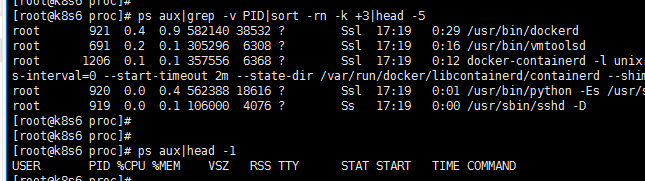
[root@k8s6 proc]# ps aux|grep -v PID|sort -rn -k +|head -

root         0.4  0.9   ?        Ssl  :   : /usr/bin/dockerd

root         0.2  0.1    ?        Ssl  :   : /usr/bin/vmtoolsd

root        0.1  0.1    ?        Ssl  :   : docker-containerd -l unix:///var/run/docker/libcontainerd/docker-containerd.sock --metrics-interval=0 --start-timeout 2m --state-dir /var/run/docker/libcontainerd/containerd --shim docker-containerd-shim --runtime docker-runc

root         0.0  0.4   ?        Ssl  :   : /usr/bin/python -Es /usr/sbin/tuned -l -P

root         0.0  0.1    ?        Ss   :   : /usr/sbin/sshd -D

[root@k8s6 proc]#

[root@k8s6 proc]#

[root@k8s6 proc]# ps aux|head -

USER       PID %CPU %MEM    VSZ   RSS TTY      STAT START   TIME COMMAND
一、用python实现前5个进程的监控
1)用该命令把内容实时更新推送至该文件
ps aux|grep -v PID|sort -rn -k +3|head -5 > test.txt
2)用python获取该文件的内容
status = []

with open('test.txt',mode='r',encoding='utf-8') as f:

    for line in f:

        line = line.split('\n')[].split(' ')

        for li in line:

            if len(li) != :

                pass

            else:

                line.remove(li)

        status.append(line)

for i in status:

    print(i)
3)利用传值的方式获取每个进程的cpu
import sys

run = sys.argv

cmd = int(run[]) -

status = []

with open('test.txt',mode='r',encoding='utf-8') as f:

    for line in f:

        line = line.split('\n')[].split(' ')

        for li in line:

            if len(li) != :

                pass

            else:

                line.remove(li)

        status.append(line)

print(status[cmd][])
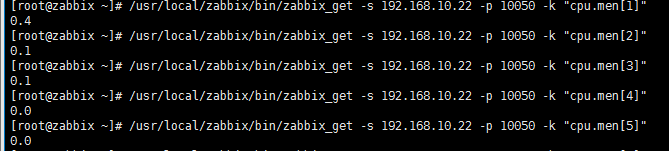
指定获取每行的cpu进程
python cpu_test.py         # 第1高进程

python cpu_test.py         # 第2高进程

python cpu_test.py         # 第3高进程

python cpu_test.py         # 第4高进程

python cpu_test.py         # 第5高进程
4)修改脚本文件,也可以实现获取到每个进程所占用的内存空间
import sys

run = sys.argv

cmd = int(run[]) -

status = []

with open('test.txt',mode='r',encoding='utf-8') as f:

    for line in f:

        line = line.split('\n')[].split(' ')

        for li in line:

            if len(li) != :

                pass

            else:

                line.remove(li)

        status.append(line)

print(status[cmd][])
获取每行的所占用的内存
python cpu_test.py         # 第1高进程

python cpu_test.py         # 第2高进程

python cpu_test.py         # 第3高进程

python cpu_test.py         # 第4高进程

python cpu_test.py         # 第5高进程
二、完善脚本,直接获取结果至内存
1) 针对cpu
import sys

import subprocess

run = sys.argv

cmd=int(run[]) -

status = []

obj=subprocess.Popen('ps aux|grep -v PID|sort -rn -k +3|head -3',

                 shell=True,

                 stdout=subprocess.PIPE,

                 stderr=subprocess.PIPE

                 )

result = obj.stdout

status = []

for line in result:

        line = line.split('\n')[].split(' ')

        for li in line:

            if len(li) != :

                pass

            else:

                line.remove(li)

        status.append(line)

result= float(status[cmd][]) *

print(result)
cpu.py
执行 python cpu.py 1 到 3
2)针对men
import sys

import subprocess

run = sys.argv

cmd=int(run[]) -

status = []

obj=subprocess.Popen('ps aux|grep -v PID|sort -rn -k +3|head -3',

                 shell=True,

                 stdout=subprocess.PIPE,

                 stderr=subprocess.PIPE

                 )

result = obj.stdout

status = []

for line in result:

        line = line.split('\n')[].split(' ')

        for li in line:

            if len(li) != :

                pass

            else:

                line.remove(li)

        status.append(line)

result= float(status[cmd][]) *

print(result)
men.py
执行 python men.py 1 到 3
三、监控cpu,内存
#!/usr/bin/env python
# -*- coding:utf-8 -*- -
import os, time last_worktime=0
last_idletime=0 def get_cpu():
global last_worktime, last_idletime
f=open("/proc/stat","r")
line=""
while not "cpu " in line: line=f.readline()
f.close()
spl=line.split(" ")
worktime=int(spl[2])+int(spl[3])+int(spl[4])
idletime=int(spl[5])
dworktime=(worktime-last_worktime)
didletime=(idletime-last_idletime)
rate=float(dworktime)/(didletime+dworktime)
last_worktime=worktime
last_idletime=idletime
if(last_worktime==0): return 0
return rate def get_mem_usage_percent():
try:
f = open('/proc/meminfo', 'r')
for line in f:
if line.startswith('MemTotal:'):
mem_total = int(line.split()[1])
elif line.startswith('MemFree:'):
mem_free = int(line.split()[1])
elif line.startswith('Buffers:'):
mem_buffer = int(line.split()[1])
elif line.startswith('Cached:'):
mem_cache = int(line.split()[1])
elif line.startswith('SwapTotal:'):
vmem_total = int(line.split()[1])
elif line.startswith('SwapFree:'):
vmem_free = int(line.split()[1])
else:
continue
f.close()
except:
return None
physical_percent = usage_percent(mem_total - (mem_free + mem_buffer + mem_cache), mem_total)
virtual_percent = 0
if vmem_total > 0:
virtual_percent = usage_percent((vmem_total - vmem_free), vmem_total)
return physical_percent, virtual_percent def usage_percent(use, total):
try:
ret = (float(use) / total) * 100
except ZeroDivisionError:
raise Exception("ERROR - zero division error")
return ret statvfs = os.statvfs('/') total_disk_space = statvfs.f_frsize * statvfs.f_blocks
free_disk_space = statvfs.f_frsize * statvfs.f_bfree
disk_usage = (total_disk_space - free_disk_space) * 100.0 / total_disk_space
disk_usage = int(disk_usage)
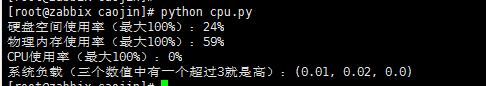
disk_tip = "硬盘空间使用率(最大100%):"+str(disk_usage)+"%"
print(disk_tip) mem_usage = get_mem_usage_percent()
mem_usage = int(mem_usage[0])
mem_tip = "物理内存使用率(最大100%):"+str(mem_usage)+"%"
print(mem_tip) cpu_usage = int(get_cpu()*100)
cpu_tip = "CPU使用率(最大100%):"+str(cpu_usage)+"%"
print(cpu_tip) load_average = os.getloadavg()
load_tip = "系统负载(三个数值中有一个超过3就是高):"+str(load_average)
print(load_tip)
cpu_disk_men
centos中单进程监控的更多相关文章
- centos 7中监控mysql 数据库脚本(监控端口)
centos 7中监控mysql 数据库脚本(监控端口) 监控mysql数据库的方法如下: 1.监控端口 netstat -nltp |grep 3306 2.监控进程 ps -ef |grep 33 ...
- 【SFTP】使用Jsch实现Sftp文件下载-支持断点续传和进程监控
参考上篇文章: <[SFTP]使用Jsch实现Sftp文件下载-支持断点续传和进程监控>:http://www.cnblogs.com/ssslinppp/p/6248763.html ...
- linux 进程监控
linux 进程监控 supervise Supervise是daemontools的一个工具,可以用来监控管理unix下的应用程序运行情况,在应用程序出现异常时,supervise可以重新启动指定程 ...
- linux 进程监控和自动重启的简单实现
目的:linux 下服务器程序会因为各种原因dump掉,就会影响用户使用,这里提供一个简单的进程监控和重启功能. 实现原理:由定时任务crontab调用脚本,脚本用ps检查进程是否存在,如果不存在则重 ...
- linux 进程监控和自动重启的简单实现(转)
目的:linux 下服务器程序会因为各种原因dump掉,就会影响用户使用,这里提供一个简单的进程监控和重启功能. 实现原理:由定时任务crontab调用脚本,脚本用ps检查进程是否存在,如果不存在则重 ...
- Prometheus — Process-exporter进程监控
由于我们常用的node_exporter并不能覆盖所有监控项,这里我们使用Process-exporter 对进程进行监控. 安装process-exporter wget https://githu ...
- centos服务器如何监控访问ip,并将非法ip通过防火墙禁用
centos服务器如何监控访问ip,并将非法ip通过防火墙禁用 上周给朋友帮忙,上架了一款小游戏(年年有鱼),项目刚一上线,就遇到了ddos攻击,阿里云连续给出了6次ddos预警提示,服务器一度处于黑 ...
- Zabbix4.0添加端口和进程监控
一:Zabbix设置主动模式: vim /etc/zabbix/zabbix_agent.conf Server=192.168.1.10 #被动模式的serverip地址,如果设置纯被动模式,可以注 ...
- CentOS下zabbix监控mysql5.6版本主从
目录 CentOS下zabbix监控mysql5.6版本主从 1. Zabbix添加自定义监控流程 2. 具体步骤 1. 编写监控mysql主从脚本 2. mysql赋权 3. 查看脚本执行效果 4. ...
随机推荐
- Cglib源码分析 invoke和invokeSuper的差别(转)
原文 https://blog.csdn.net/makecontral/article/details/79593732 Cglib的实例 本文重在源码的分析,Cglib的使用不再复述. //被代理 ...
- Failed to resolve: common Open File 导入项目问题
Failed to resolve: common Open File Warning:Configuration 'compile' is obsolete and has been replac ...
- Phpstorm 与 服务器 同步 代码
链接:(自己领悟就好了) Phpstorm同步代码
- git 修改客户端用户名和密码
1.修改某个具体项目中的用户名密码 vim xx/{yourProject dir }/.git/.git-credentials 在.git-credentials文件中配置用户名密码 https: ...
- 在C++程序中自动加入svn版本号
原创文章,欢迎阅读,如果您想转载,请在第一行醒目注明原作者和原始链接. 为了方便追查和确认软件bug等问题,给软件或者库赋予版本号是个好办法. 最简单的版本号管理是记录编译时间: cout<&l ...
- Python3 timeit的用法
Python3中的timeit模块可以用来测试小段代码的运行时间 其中主要通过两个函数来实现:timeit和repeat,代码如下: def timeit(stmt="pass", ...
- 在cxGrid表格中如何获得当前列的字段名
var GridDBTableView:TcxGridDBTableView; ColIndex:Integer; FieldName:string; begin GridDBTableView := ...
- php 处理上百万条的数据库如何提高处理查询速度
1.对查询进行优化,应尽量避免全表扫描,首先应考虑在 where 及 order by 涉及的列上建立索引. 2.应尽量避免在 where 子句中对字段进行 null 值判断,否则将导致引擎放弃使用索 ...
- python 的包的导入
已经写过一篇包的导入了,最近又遇到了点问题,所以想把这些再搞的明白点就又试了试 代码结构如下 在test目录下,有Admin包,home包,在home下有它的子包foo 各个文件代码如下 admins ...
- jquery之过滤filter,not
<body> <h1>欢迎来到我的主页</h1> <p>我是唐老鸭</p> <p class="intro"> ...