linux环境下 C++性能测试工具 gprof + kprof + gprof2dot
1.gprof
很有名了,google下很多教程
g++ -pg -g -o test test.cc
./test //会生成gmon.out
gprof ./test > prof.log
看一下对于我前面提到的huffman编码压缩+解码解压缩全部过程的一个程序
对于生成的prof.log ,wow, 很有用处的但是看起来有点累,不是吗:)

 Code
Code
Flat profile:
Each sample counts as 0.01 seconds.
% cumulative self self total
time seconds seconds calls s/call s/call name
32.51 1.71 1.71 13127166 0.00 0.00 glzip::HuffTree<unsigned char, glzip::decode_hufftree>::decode_byte(unsigned char, glzip::Buffer&, glzip::HuffNode<unsigned char>*&, int)
18.73 2.69 0.98 105017328 0.00 0.00 glzip::Buffer::write_bit(int)
16.63 3.57 0.88 24292128 0.00 0.00 glzip::Buffer::write_string(std::string const&)
7.22 3.95 0.38 61711820 0.00 0.00 glzip::Buffer::read_byte(unsigned char&)
5.80 4.25 0.30 37419691 0.00 0.00 glzip::Buffer::write_byte(unsigned char)
5.51 4.54 0.29 1 0.29 2.48 glzip::Encoder<unsigned char>::do_encode_file(glzip::char_tag)
5.13 4.82 0.27 105017721 0.00 0.00 glzip::HuffNode<unsigned char>::is_leaf()
3.04 4.97 0.16 1 0.16 0.31 glzip::Encoder<unsigned char>::do_caculate_frequency(glzip::char_tag)
2.47 5.11 0.13 1 0.13 2.42 glzip::HuffTree<unsigned char, glzip::decode_hufftree>::decode_file()
1.14 5.17 0.06 24292227 0.00 0.00 std::vector<std::string, std::allocator<std::string> >::operator[](unsigned int)
0.95 5.21 0.05 1 0.05 0.05 glzip::HuffTree<unsigned char, glzip::encode_hufftree>::do_serialize_tree(glzip::HuffNode<unsigned char>*, glzip::Buffer&)
0.29 5.23 0.01 24292133 0.00 0.00 glzip::HuffTreeBase<unsigned char>::root() const
0.29 5.25 0.01 574 0.00 0.00 glzip::Buffer::flush_buf()
0.19 5.25 0.01 6 0.00 0.00 glzip::Buffer::~Buffer()
0.10 5.26 0.01 unsigned int const& std::min<unsigned int>(unsigned int const&, unsigned int const&)
0.00 5.26 0.00 12901 0.00 0.00 std::_Deque_iterator<glzip::HuffNode<unsigned char>*, glzip::HuffNode<unsigned char>*&, glzip::HuffNode<unsigned char>**>::_Deque_iterator(std::_Deque_iterator<glzip::HuffNode<unsigned char>*, glzip::HuffNode<unsigned char>*&, glzip::HuffNode<unsigned char>**> const&)
0.00 5.26 0.00 6065 0.00 0.00 std::__deque_buf_size(unsigned int)
0.00 5.26 0.00 6056 0.00 0.00 std::_Deque_iterator<glzip::HuffNode<unsigned char>*, glzip::HuffNode<unsigned char>*&, glzip::HuffNode<unsigned char>**>::_S_buffer_size()
0.00 5.26 0.00 5656 0.00 0.00 std::_Deque_iterator<glzip::HuffNode<unsigned char>*, glzip::HuffNode<unsigned char>*&, glzip::HuffNode<unsigned char>**>::operator*() const
0.00 5.26 0.00 5656 0.00 0.00 std::_Deque_iterator<glzip::HuffNode<unsigned char>*, glzip::HuffNode<unsigned char>*&, glzip::HuffNode<unsigned char>**>::operator+=(int)
0.00 5.26 0.00 4871 0.00 0.00 std::_Deque_iterator<glzip::HuffNode<unsigned char>*, glzip::HuffNode<unsigned char>*&, glzip::HuffNode<unsigned char>**>::operator+(int) const
0.00 5.26 0.00 3126 0.00 0.00 glzip::HuffNode<unsigned char>::weight() const
0.00 5.26 0.00 1465 0.00 0.00 glzip::HuffTree<unsigned char, glzip::encode_hufftree>::HuffNodePtrGreater::operator()(glzip::HuffNode<unsigned char> const*, glzip::HuffNode<unsigned char> const*)
0.00 5.26 0.00 946 0.00 0.00 glzip::Buffer::fill_buf()
0.00 5.26 0.00 785 0.00 0.00 std::_Deque_iterator<glzip::HuffNode<unsigned char>*, glzip::HuffNode<unsigned char>*&, glzip::HuffNode<unsigned char>**>::operator-(int) const
0.00 5.26 0.00 785 0.00 0.00 std::_Deque_iterator<glzip::HuffNode<unsigned char>*, glzip::HuffNode<unsigned char>*&, glzip::HuffNode<unsigned char>**>::operator-=(int)
0.00 5.26 0.00 590 0.00 0.00 glzip::HuffNode<unsigned char>::left() const
0.00 5.26 0.00 590 0.00 0.00 glzip::HuffNode<unsigned char>::right() const
0.00 5.26 0.00 453 0.00 0.00 operator new(unsigned int, void*)  .
.
2.Kprof
sudo apt-get install kprof
kprof -f ./test //注意已经按照前面的用gprof生成 gmont.out 了。
将gprof , GUI化了,更加友好,还是很方便的,它也利用而来graphviz绘制了运行时流程图,但是对于大的程序,
似乎效果不太好,流程图感觉完全乱掉了,而且对于大程序,kprof运行的有点慢,在我的破机器上跑半天才出来。
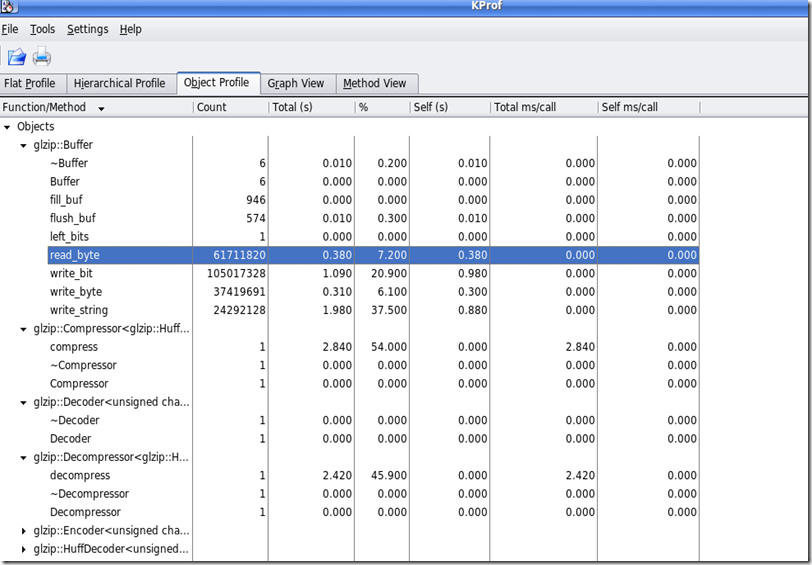
总的来说它的object profile还是很方便有用的。
object profile 示意图
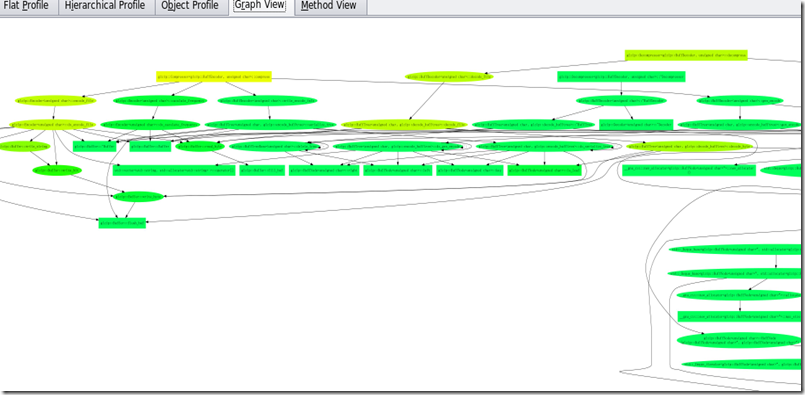
graph view 示意图,这个仅作参考吧,同样是用graphviz怎么和gprof2dot差距这么大呢?:)对比下下面gprof2dot的生成图吧!
3.gprof2dot.py
这个脚本太TMD的牛X了,速度快效果好,怪不得底下评论一片叫好,这就是life_saving的工具啊!
首先就是运行时的程序流程图,网上有很多工具有些就是利用gprof的,有很多文章介绍,都不用看了,就用这个吧。
然后很直观的看出每个步骤的占用时间百分比,函数调用次数,颜色能直观的表示出瓶颈所在。
gprof2dot安装看这里吧
http://www.51testing.com/?uid-13997-action-viewspace-itemid-79952
gprof ./test | gprof2dot.py | xdot
恩 去下载那个xdot.py吧 看dot文件,太方便了,不需要先生成图像了。
直接看效果图吧!
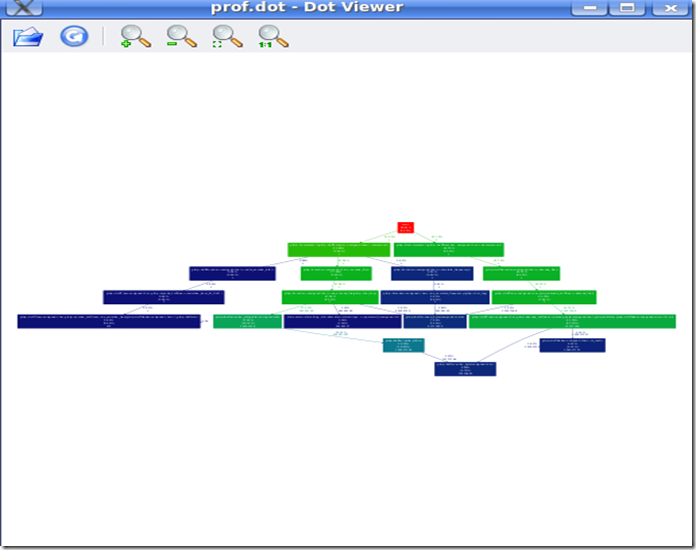
1.整体图
清晰多了吧,上面那么多冗余的东西。
2.局部图
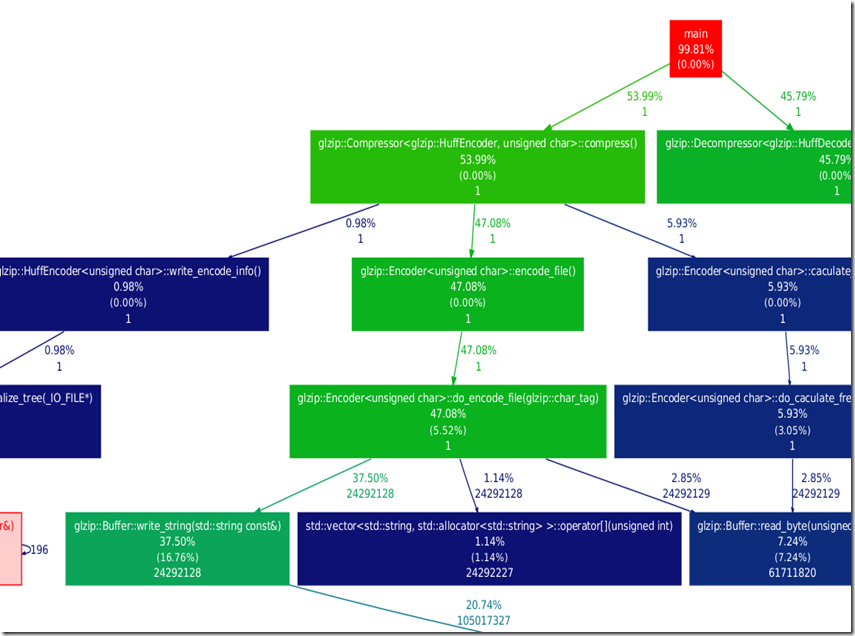
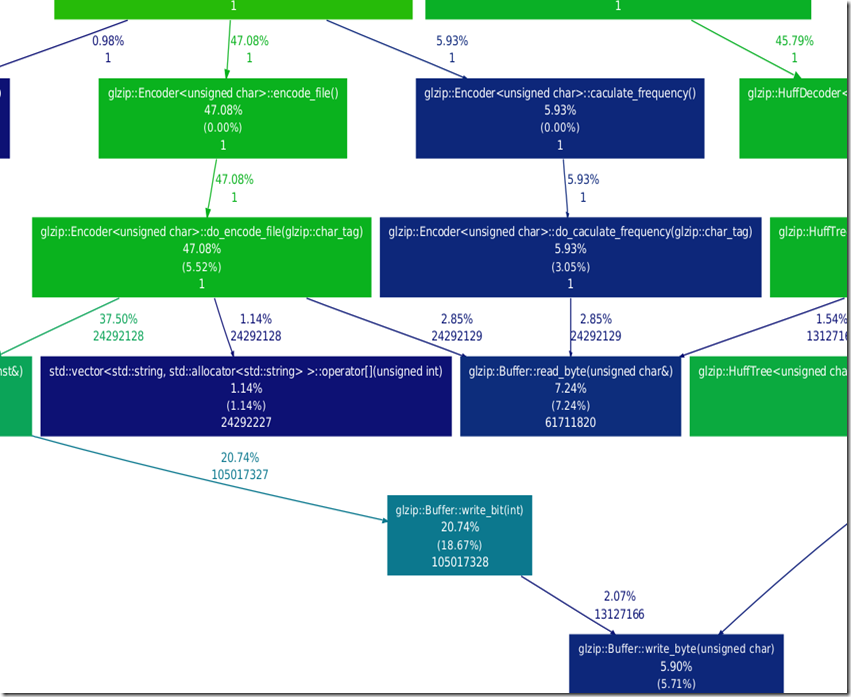
和我的程序执行过程完全对应,清晰明了,太赞了!
每个方框内部显示函数名称,函数整体包括内部子函数占用时间%比,函数自身,不包括内部子函数占用时间%比,函数执行次数。
边表示父函数调用该子函数占用的时间%比,调用次数。
之所以清晰是因为,gprof2dot默认是部分函数调用图,对性能影响不大的函数调用都不显示,例如上图中没有出现类的构造,析构函数,
如果想要显示全部的函数调用,可以 gprof2dot -n0 -e0 ,默认是n0.5即影响小于5%的函数就不显示了。
当然这样图片会很乱,因为显示内容很多,可以 gprof2dot -n0 -e0 -s #-s表示不显示诸如模板,函数入口参数等等,使得
函数名称显示更加精简。
恩,如果用户能决定只输出某个函数及其关联函数的显示信息图就更好了,例如上面有两个
独立的过程compress()和decompress()如果用户能够决定只是显示compress()就好了,
不过考虑到模板之类的稍微有点麻烦,但是应该也是能实现的!
4. google 还有一个开源的能测试工具
以后尝试一下
http://code.google.com/p/google-perftools/wiki/GooglePerformanceTools
linux环境下 C++性能测试工具 gprof + kprof + gprof2dot的更多相关文章
- Linux环境下apache性能测试工具ab使用详解
网站性能压力测试是服务器网站性能调优过程中必不可缺少的一环.只有让服务器处在高压情况下,才能真正体现出软件.硬件等各种设置不当所暴露出的问题. 性能测试工具目前最常见的有以下几种:ab.http_lo ...
- linux环境下安装tcping工具测试访问超时
wget https://sources.voidlinux.eu/tcping-1.3.5/tcping-1.3.5.tar.gz tar zxvf tcping-1.3.5.tar.gz cd t ...
- Linux环境下使用logrotate工具实现nginx日志切割
一. 前提背景及需求 nginx运行日志默认保存在nginx安装目录下的 /usr/local/nginx/logs 文件夹, 包含access.log和error.log两个文件. (1) acce ...
- Linux 环境下安装rlwrap工具
rlwrap项目是一个“readline包装器”,它使用GNU readline库来编辑任何其他命令的键 盘输入.通过rlwrap可以进行命令的上下切换,类似历史命令. 1.下载rlwrap rpm ...
- [原]Fedora Linux环境下的应用工具总结
一.办公类软件 1.Office办公:WPS 二.网络通信类软件 1.浏览器:Chrome 2.远程桌面:rdesktop(适用于Windows系列) 三.操作系统设置与优化 1.3D桌面管理:Com ...
- 高级工具gprof、gprof2dot.py、dot
可以研究程序性能.函数调用堆栈等,而且能用图标查看. linux环境下 C++性能测试工具 gprof + kprof + gprof2dot - 阁子 - 博客园 gprof.gprof2dot.p ...
- linux环境下的GUN make学习笔记(一)
第一章:概述 1.1:make概述 在linux环境下使用make工具能够比较容易的构建一个属于自己的工程,整个工程的编译只需要一个命令就可以完成编译.连接以至于最后的执行.不过我们需要投入一些时间去 ...
- linux环境下学习使用pro*c/c++工具
1.proc是oracle用来预编译嵌入SQL语句的c程序. 2.如何使用proc工具 在Linux环境下,首先确保gcc编译器正常使用,安装oracle数据库或者客户端,一般就会默认安装pro*c/ ...
- Linux环境下搭建禅道管理工具-包含软件资源
Linux环境下搭建禅道管理工具 1:百度云盘下载: 禅道--链接: https://pan.baidu.com/s/1Stu7nOZVIPO5TnpJWjWtiQ 提取码:dnik CentOs操 ...
随机推荐
- WordNet::Similarity的安装和使用
简介 WordNet::Similarity是一个Perl实现的软件包,可以用来计算两个概念(或者word sense)之间的语义相似度,它提供了六种计算相似度和三种计算概念之间关联度的方法,所有的这 ...
- Esper简介
1. CEP(Complex Event Processing, 复杂事件处理) 事件(Event)一般情况下指的是一个系统中正在发生的事,事件可能发生在系统的各个层面上,它可以是某个动作,例如客户下 ...
- [转]MVC Razor模板引擎 @RenderBody、@RenderPage、@RenderSection及Html.RenderPartial、Html.RenderAction
本文参考自下面文章整理 MVC Razor模板引擎 @RenderBody.@RenderPage.@RenderSection及Html.RenderPartial.Html.RenderActio ...
- [SQL Server] 无法连接到本地数据库
打开SQL Server配置管理器 启用下图两个协议 打开SQL Server服务 这一步可能出现这种情况: 故障原因是,安装Visual Studio 2012的时候,自动安装“Microsoft ...
- Pnel控件
分组类控件 面板控件(Panel) 分组框控件(GroupBox) 选项卡控件(TabControl)等控件 Panel 控件是由System.Windows.Forms.Panel类提供的,主要 ...
- FusionChart实现柱状图、饼状图的动态数据显示
<!DOCTYPE html PUBLIC "-//W3C//DTD XHTML 1.0 Transitional//EN" "http://www.w3.org/ ...
- Java基础教程(2)--Java开发环境
一.JVM.JRE和JDK的概念 对于初学者来说,这三个术语出现的频率很高,而且有关这它们的问题在面试题中也会经常出现.因此,理解它们的定义.区别和联系就显得尤为重要.在学习这几个专业术语之前,我 ...
- apache Header set Cache-Control
设置静态页面的缓存最大值 在.htaccess中添加下面的代码 <FilesMatch "\.(flv|gif|jpg|jpeg|png|ico|swf)$"> Hea ...
- 解决:springmvc maven 项目搭建完后没有src目录,而且maven导入很慢
前言:在搭建springmvc maven项目中遇到的问题做总结,比如搭建后没有src,同时这里也解决了搭建后maven导入很慢的问题. 问题: 1.发现创建出来的maven项目没有src文件 ,而且 ...
- UNIX IPC: POSIX 消息队列
首先在我的MAC OSX上试了一下虽然有_POSIX_MESSAGE_PASSING的宏定义,但是用gcc编译会提示没有mqueue.h头文件,先放一边.在Ubuntu上使用正常,不过POSIX消息队 ...