ArcGIS Overview Map(鹰眼/概览图)
一、说明
引用文件那块,可以参考我上一篇博文,arcgis api for javascript离线部署。
这篇博文中,地图占满整个body
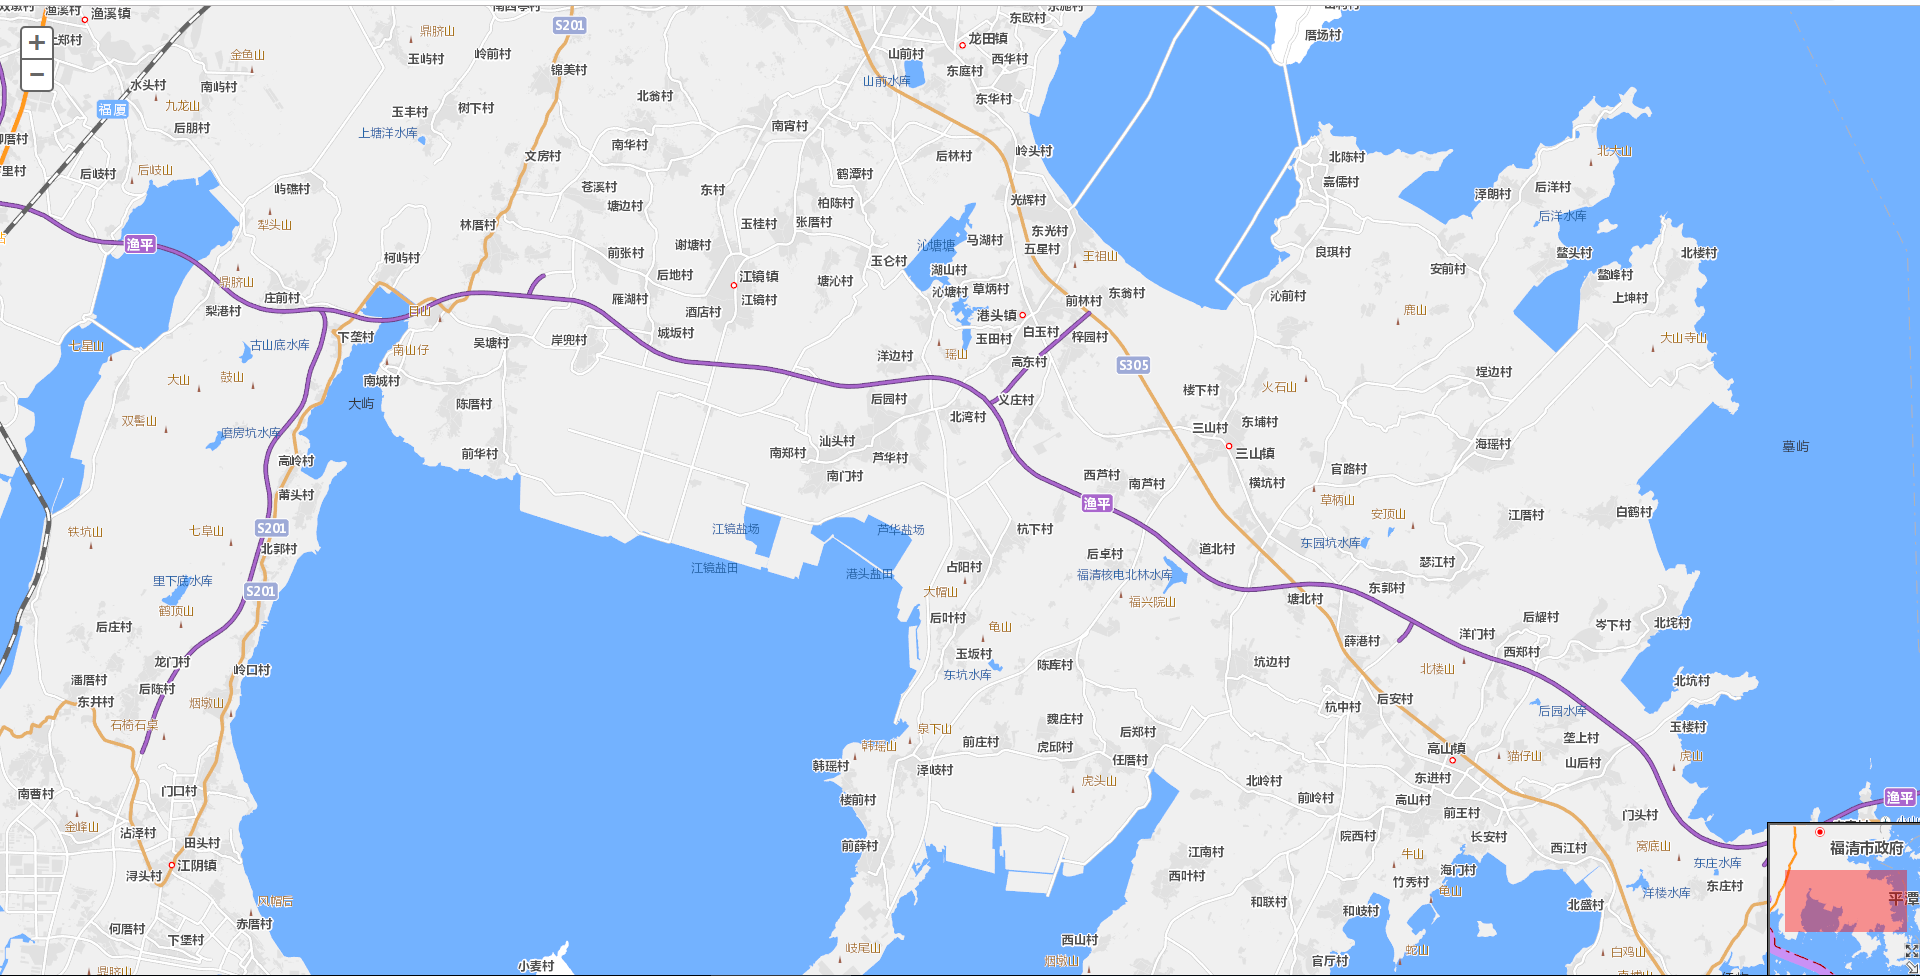
二、运行效果
三、HTML代码
<!DOCTYPE html>

<html>

  <head>

    <meta http-equiv="Content-Type" content="text/html; charset=utf-8">

      <meta http-equiv="X-UA-Compatible" content="IE=7,IE=9">

    <!--The viewport meta tag is used to improve the presentation and behavior of the samples on iOS devices-->

    <meta name="viewport" content="initial-scale=1, maximum-scale=1,user-scalable=no">

    <title>Overview Map</title>

      <link rel="stylesheet" type="text/css" href="http://localhost/arcgis_js3_api/library/3.3/jsapi/js/dojo/dijit/themes/claro/claro.css"/>

<link rel="stylesheet" type="text/css" href="http://localhost/arcgis_js3_api/library/3.3/jsapi/js/esri/css/esri.css" />

    <style>

      html, body { height:100%; width: 100%; margin: 0; padding: 0; }

    </style>

    <script>

        var dojoConfig = {

            parseOnLoad: true

        };

    </script>

     <script type="text/Javascript" src="http://localhost/arcgis_js3_api/library/3.3/jsapi/init.js"></script>

    <script>

        // 导入必要包

        dojo.require("dijit.layout.BorderContainer");

        dojo.require("dijit.layout.ContentPane");

        dojo.require("esri.map");

        dojo.require("esri.dijit.OverviewMap");

        var map;

        function init() {

            map = new esri.Map("map", { center: [-122.445, 37.752], zoom: 4 });

            MyTiledMapServiceLayer = new esri.layers.ArcGISTiledMapServiceLayer

            ("http://localhost/arcgis/rest/services/DZDT2012/MapServer");

            map.addLayer(MyTiledMapServiceLayer);

            dojo.connect(map, "onLoad", function (theMap) {

                // 添加概览地图

                var overviewMapDijit = new esri.dijit.OverviewMap({

                    map: map,   // 必要的

                    visible: true,  // 初始化可见,默认为false

                    attachTo: "bottom-right",   // 默认右上角

                    width: 150, // 默认值是地图高度的 1/4th

                    height: 150, // 默认值是地图高度的 1/4th

                    opacity: .40,    // 透明度 默认0.5

                    maximizeButton: true,   // 最大化,最小化按钮,默认false

                    expandFactor: 3,    //概览地图和总览图上显示的程度矩形的大小之间的比例。默认值是2,这意味着概览地图将至少是两倍的大小的程度矩形。

                    color: "red"    // 默认颜色为#000000

                });

                overviewMapDijit.startup();   // 开启

            });

        }

        dojo.ready(init);

    </script>

  </head>

  <body class="claro">

    <div data-dojo-type="dijit.layout.BorderContainer"

         data-dojo-props="design:'headline', gutters:false"

         style="width: 100%; height: 100%; margin:0;">

         <div id="map"

           data-dojo-type="dijit.layout.ContentPane"

           data-dojo-props="region:'center'"

           style="padding:0">

      </div>

    </div>

  </body>

</html>
注释:这篇文章中,地图我用的是我本机的("http://localhost/arcgis/rest/services/DZDT2012/MapServer");
如果你没有自己的地图可以使用下面的HTML代码
四、HTML(另外一种形式)
<!DOCTYPE html>

<html>

  <head>

    <meta http-equiv="Content-Type" content="text/html; charset=utf-8">

      <meta http-equiv="X-UA-Compatible" content="IE=7,IE=9">

    <!--The viewport meta tag is used to improve the presentation and behavior of the samples on iOS devices-->

    <meta name="viewport" content="initial-scale=1, maximum-scale=1,user-scalable=no">

    <title>Overview Map</title>

      <link rel="stylesheet" type="text/css" href="http://localhost/arcgis_js3_api/library/3.3/jsapi/js/dojo/dijit/themes/claro/claro.css"/>

<link rel="stylesheet" type="text/css" href="http://localhost/arcgis_js3_api/library/3.3/jsapi/js/esri/css/esri.css" />

    <style>

      html, body { height:100%; width: 100%; margin: 0; padding: 0; }

    </style>

    <script>

        var dojoConfig = {

            parseOnLoad: true

        };

    </script>

     <script type="text/Javascript" src="http://localhost/arcgis_js3_api/library/3.3/jsapi/init.js"></script>

    <script>

        // 导入必要包

        dojo.require("dijit.layout.BorderContainer");

        dojo.require("dijit.layout.ContentPane");

        dojo.require("esri.map");

        dojo.require("esri.dijit.OverviewMap");

        var map;

        function init() {

           map = new esri.Map("map", {

                basemap: "topo", // 指定的地图底图.有效选项:"streets","satellite","hybrid","topo","gray","oceans","national-geographic","osm".

                center: [-122.445, 37.752],   // 居中的经纬度

                zoom: 14  // 缩放深度级别

            });

            dojo.connect(map, "onLoad", function (theMap) {

                // 添加概览地图

                var overviewMapDijit = new esri.dijit.OverviewMap({

                    map: map,   // 必要的

                    visible: true,  // 初始化可见,默认为false

                    attachTo: "bottom-right",   // 默认右上角

                    width: 150, // 默认值是地图高度的 1/4th

                    height: 150, // 默认值是地图高度的 1/4th

                    opacity: .40,    // 透明度 默认0.5

                    maximizeButton: true,   // 最大化,最小化按钮,默认false

                    expandFactor: 3,    //概览地图和总览图上显示的程度矩形的大小之间的比例。默认值是2,这意味着概览地图将至少是两倍的大小的程度矩形。

                    color: "red"    // 默认颜色为#000000

                });

                overviewMapDijit.startup();   // 开启

            });

        }

        dojo.ready(init);

    </script>

  </head>

  <body class="claro">

    <div data-dojo-type="dijit.layout.BorderContainer"

         data-dojo-props="design:'headline', gutters:false"

         style="width: 100%; height: 100%; margin:0;">

         <div id="map"

           data-dojo-type="dijit.layout.ContentPane"

           data-dojo-props="region:'center'"

           style="padding:0">

      </div>

    </div>

  </body>

</html>
注意:直接拷贝代码的时候 要把引用文件的
arcgis_js3_api修改为
arcgis_js_api
例如:
<link rel="stylesheet" type="text/css" href="http://localhost/arcgis_js3_api/library/3.3/jsapi/js/dojo/dijit/themes/claro/claro.css"/>修改为
<link rel="stylesheet" type="text/css" href="http://localhost/arcgis_js_api/library/3.3/jsapi/js/dojo/dijit/themes/claro/claro.css"/>
因为我本机IIS文件夹名称是
arcgis_js3_api
ArcGIS Overview Map(鹰眼/概览图)的更多相关文章
- ArcGIS api for js OverviewMap(鹰眼/概览图)
说明.本篇博客中主要介绍 地图显示在某个div情况 1.运行效果 2.HTML <!DOCTYPE html> <html> <head> <meta htt ...
- ArcGIS Engine开发鹰眼图的功能(基础篇)
鹰眼是用于调节全视域范围内主地图显示范围情况的副地图.它体现了地图整体与详细局部的关系. 用户可以通过鼠标单击或者画框等动作实现鹰眼与主地图的交互情况. 鹰眼功能的原理是通过主地图窗口的地图控件和鹰眼 ...
- 【UML】NO.52.EBook.5.UML.1.012-【UML 大战需求分析】- 交互概览图(Interaction Overview Diagram)
1.0.0 Summary Tittle:[UML]NO.52.EBook.1.UML.1.012-[UML 大战需求分析]- 交互概览图(Interaction Overview Diagram) ...
- ArcGIS Engine开发鹰眼图的功能(代码优化篇)
在上一篇,ArcGIS Engine开发鹰眼图的功能(基础篇) 上一篇的实现效果图如下, 如果仔细观察,会发现一个问题,即在“鹰眼”的区域,只要在红色线框内的注记会被覆盖. 如果红色框包括整张图的话, ...
- Shadow Map阴影贴图技术之探 【转】
这两天勉勉强强把一个shadowmap的demo做出来了.参考资料多,苦头可不少.Shadow Map技术是目前与Shadow Volume技术并行的传统阴影渲染技术,而且在游戏领域可谓占很大优势.本 ...
- Arcgis for Javascript之featureLayer图和属性互操作性
说明:主要实现加载FeatureLayer并显示属性表,而要实现联动属性表与地图,首先,看看实施后的效果: 显示效果 如上图所看到的,本文章主要实现了下面几个功能:1.FeatureLayer属性表的 ...
- Arcgis for Javascript之featureLayer图和属性的互操作
说明:主要实现加载FeatureLayer与显示属性表,并实现属性表与地图的联动,首先,看看实现后的效果: 显示效果 如上图所示,本文章主要实现了以下几个功能:1.FeatureLayer属性表的分页 ...
- ArcGIS Server 缓存服务切图范围
win10 + Server 10.4 + ArcMap 10.4 ArcGIS Server 缓存服务分为创建服务后手动建立缓存和创建服务时同时自动建立缓存两种. 10.2帮助文档:http:/ ...
- ArcGIS教程:树状图
摘要 构造可显示特征文件里连续合并类之间的属性距离的树示意图(树状图). 使用方法 · 输入特征文件必须採用预定的特征文件格式. 特征文件可使用 Iso 聚类或创建特征工具来创建.该文件必须至少包括两 ...
随机推荐
- [Machine Learning with Python] Data Preparation through Transformation Pipeline
In the former article "Data Preparation by Pandas and Scikit-Learn", we discussed about a ...
- [Js]删除数组指定元素
写在前面 在最近的项目中,有用到js对数组的操作,之前自己几乎没有用到这种方法,这里就记录一下,算是对学到的东西的一种总结吧. 数组对象splice方法 splice() 方法向/从数组中添加/删除项 ...
- Android自定义控件-Path之贝赛尔曲线和手势轨迹、水波纹效果
从这篇开始,我将延续androidGraphics系列文章把图片相关的知识给大家讲完,这一篇先稍微进阶一下,给大家把<android Graphics(二):路径及文字>略去的quadTo ...
- C语言对文件的读写操作以及处理CSV文件的方法
#include <stdio.h> #define F_PATH "d:\myfile\file.txt" int main(void) { FILE *fp = N ...
- EasyMvc入门教程-图形控件说明(21)线形图+柱状图+饼形图
本章将介绍一些基本但常用的图形:线型图,柱状图和饼形图. 以上三种图形对于的数据都是键值对数组,请参考第一个例子: @{ var data = new List<LineItem>(); ...
- 给java类加static修饰编译器会说什么?
Illegal modifier for the class XXX;only public abstract & final are permitted.
- struts2学习笔记2 -struts2的开发步骤和工作原理
struts2的开发步骤: 1.先定义一个能发送请求的页面,可以是链接,也可以是表单(form) 2.开发action类,struts2对action并没有过多的要求,只要求: a 推荐实现actio ...
- 0x…… is not a valid instance ID怎么解决
<!DOCTYPE html PUBLIC "-//W3C//DTD XHTML 1.0 Transitional//EN" "http://www.w3.org/ ...
- koajs 项目实战(二)
此篇文章,接 koajs 项目实战(一)后写 (六)表单提交和参数接收 表单: <form method="post" action="./users/zhuce& ...
- jenkins构建一个python项目
Jenkins发布后端python代码 “系统管理”“管理插件”“已安装” 检查是否有“Git plugin”和“Publish Over SSH”两个插件,如果没有,则需点击“可选插件”,找到它 ...