Go语言的堆栈分析
本文为理解翻译,原文地址:http://www.goinggo.net/2015/01/stack-traces-in-go.html
Functions
先从这段代码开始:
02
03 func main() {
04 slice := make([]string, 2, 4)
05 Example(slice, "hello", 10)
06 }
07
08 func Example(slice []string, str string, i int) {
09 panic("Want stack trace")
10 }
Listing 2
goroutine 1 [running]:
main.Example(0x2080c3f50, 0x2, 0x4, 0x425c0, 0x5, 0xa)
/Users/bill/Spaces/Go/Projects/src/github.com/goinaction/code/
temp/main.go:9 +0x64
main.main()
/Users/bill/Spaces/Go/Projects/src/github.com/goinaction/code/
temp/main.go:5 +0x85
goroutine 2 [runnable]:
runtime.forcegchelper()
/Users/bill/go/src/runtime/proc.go:90
runtime.goexit()
/Users/bill/go/src/runtime/asm_amd64.s:2232 +0x1
goroutine 3 [runnable]:
runtime.bgsweep()
/Users/bill/go/src/runtime/mgc0.go:82
runtime.goexit()
/Users/bill/go/src/runtime/asm_amd64.s:2232 +0x1
Listing 3
02 main.Example(0x2080c3f50, 0x2, 0x4, 0x425c0, 0x5, 0xa)
/Users/bill/Spaces/Go/Projects/src/github.com/goinaction/code/
temp/main.go:9 +0x64
03 main.main()
/Users/bill/Spaces/Go/Projects/src/github.com/goinaction/code/
temp/main.go:5 +0x85
Listing 4
main.Example(slice []string, str string, i int)
// Call to Example by main.
slice := make([]string, 2, 4)
Example(slice, "hello", 10)
// Stack trace
main.Example(0x2080c3f50, 0x2, 0x4, 0x425c0, 0x5, 0xa)
Listing 5
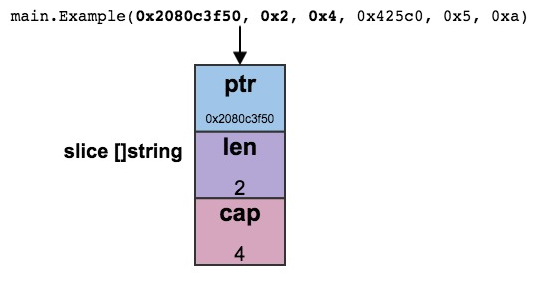
slice := make([]string, 2, 4)
// Slice header values
Pointer: 0x2080c3f50
Length: 0x2
Capacity: 0x4
// Declaration
main.Example(slice []string, str string, i int)
// Stack trace
main.Example(0x2080c3f50, 0x2, 0x4, 0x425c0, 0x5, 0xa)
Figure 1
Listing 6
"hello"
// String header values
Pointer: 0x425c0
Length: 0x5
// Declaration
main.Example(slice []string, str string, i int)
// Stack trace
main.Example(0x2080c3f50, 0x2, 0x4, 0x425c0, 0x5, 0xa)
Figure 2

Listing 7
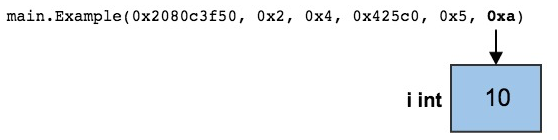
10
// Integer value
Base 16: 0xa
// Declaration
main.Example(slice []string, str string, i int)
// Stack trace
main.Example(0x2080c3f50, 0x2, 0x4, 0x425c0, 0x5, 0xa)
Figure 3
Methods
Listing 8
02
03 import "fmt"
04
05 type trace struct{}
06
07 func main() {
08 slice := make([]string, 2, 4)
09
10 var t trace
11 t.Example(slice, "hello", 10)
12 }
13
14 func (t *trace) Example(slice []string, str string, i int) {
15 fmt.Printf("Receiver Address: %p\n", t)
16 panic("Want stack trace")
17 }
Listing 9
panic: Want stack trace
01 goroutine 1 [running]:
02 main.(*trace).Example(0x1553a8, 0x2081b7f50, 0x2, 0x4, 0xdc1d0, 0x5, 0xa)
/Users/bill/Spaces/Go/Projects/src/github.com/goinaction/code/
temp/main.go:16 +0x116
03 main.main()
/Users/bill/Spaces/Go/Projects/src/github.com/goinaction/code/
temp/main.go:11 +0xae
Packing
Listing 10
02
03 func main() {
04 Example(true, false, true, 25)
05 }
06
07 func Example(b1, b2, b3 bool, i uint8) {
08 panic("Want stack trace")
09 }
Listing 11
02 main.Example(0x19010001)
/Users/bill/Spaces/Go/Projects/src/github.com/goinaction/code/
temp/main.go:8 +0x64
03 main.main()
/Users/bill/Spaces/Go/Projects/src/github.com/goinaction/code/
temp/main.go:4 +0x32
Listing 12
true, false, true, 25
// Word value
Bits Binary Hex Value
00-07 0000 0001 01 true
08-15 0000 0000 00 false
16-23 0000 0001 01 true
24-31 0001 1001 19 25
// Declaration
main.Example(b1, b2, b3 bool, i uint8)
// Stack trace
main.Example(0x19010001)
Conclusion
The Go runtime provides a great deal of information to help us debug our programs. In this post we concentrated on stack traces. The ability to decode the values that were passed into each function throughout the call stack is huge. It has helped me more than once to identify my bug very quickly. Now that you know how to read stack traces, hopefully you can leverage this knowledge the next time a stack trace happens to you.
Go语言的堆栈分析的更多相关文章
- Java线程堆栈分析
不知觉间工作已有一年了,闲下来的时候总会思考下,作为一名Java程序员,不能一直停留在开发业务使用框架上面.老话说得好,机会是留给有准备的人的,因此,开始计划看一些Java底层一点的东西,尝试开始在学 ...
- GDB调试32位汇编堆栈分析
GDB调试32位汇编堆栈分析 测试源代码 #include <stdio.h> int g(int x){ return x+5; } int f(int x){ return g(x)+ ...
- 20145318 GDB调试汇编堆栈分析
20145318 GDB调试汇编堆栈分析 代码 #include<stdio.h> short addend1 = 1; static int addend2 = 2; const sta ...
- 使用Tcmalloc进行堆栈分析
在前一篇译文<使用TCmalloc的堆栈检查>,介绍了Tcmalloc进行堆栈检查,今天翻译<heap-profiling using tcmalloc>,了解如何 TCmal ...
- 20145219 gdb调试汇编堆栈分析
20145219 gdb调试汇编堆栈分析 代码gdbdemo.c int g(int x) { return x+19; } int f(int x) { return g(x); } int mai ...
- 20145314郑凯杰《信息安全系统设计基础》GDB调试32位汇编堆栈分析
20145314郑凯杰<信息安全系统设计基础>GDB调试32位汇编堆栈分析 本篇博客将对第五周博客中的GDB调试32位汇编堆栈进行分析 首先放上以前环境配置的图: 图1: 测试代码: #i ...
- 利用R语言打造量化分析平台
利用R语言打造量化分析平台 具体利用quantmod包实现对股票的量化分析 1.#1.API读取在线行情2.#加载quantmod包3.if(!require(quantmod)){4. instal ...
- gdb运行时结合汇编堆栈分析
一.从源代码文件到可执行文件 从C文件到可执行文件,一般来说需要两步,先将每个C文件编译成.o文件,再把多个.o文件和链接库一起链接成可执行文件.但具体来说,其实是分为四步,下面以ex ...
- R语言重要数据集分析研究——需要整理分析阐明理念
1.R语言重要数据集分析研究需要整理分析阐明理念? 上一节讲了R语言作图,本节来讲讲当你拿到一个数据集的时候如何下手分析,数据分析的第一步,探索性数据分析. 统计量,即统计学里面关注的数据集的几个指标 ...
随机推荐
- webpack初试
前言: 知道这完儿,没用过.关于webpack有很多介绍了,就不多说了.放几个链接,方便新手理解.这是给纯没用过的人了解的.这里只是简单介绍一下webpack的基本用法.大多内容都是来自webpack ...
- ios 获取手机的IP地址
- (NSString *)getIPAddress:(BOOL)preferIPv4{ NSArray *searchArray = preferIPv4 ? @[ IOS_VPN @"/ ...
- Asp.Net中使用OpenRowSet操作Excel表,导入Sql Server(实例)
有两种接口可供选择:Microsoft.Jet.OLEDB.4.0(以下简称 Jet 引擎)和Microsoft.ACE.OLEDB.12.0(以下简称 ACE 引擎). Jet 引擎大家都很熟悉,可 ...
- Unity 依赖注入之一
在项目中引入Unity,建立一个接口IWork跟一个继承IWork接口的Work类 public interface IMyWork { void Work(); } public class MyW ...
- Lambda表达式详解
前言 1.天真热,程序员活着不易,星期天,也要顶着火辣辣的太阳,总结这些东西. 2.夸夸lambda吧:简化了匿名委托的使用,让你让代码更加简洁,优雅.据说它是微软自c#1.0后新增的最重要的功能之一 ...
- React,React Native中的es5和es6写法对照
es6用在React中的写法总结: 在es6还没有完全支持到浏览器的阶段里,已经有很多技术人员开始用es6的写法来超前编程了,因为有转义es6语法的工具帮助下,大家才可大量使用.解析看看es6写法用在 ...
- java合并pdf
一.开发准备 下载pdfbox-app-1.7.1.jar包;下载地址:http://download.csdn.net/detail/yanning1314/4852276 二.简单小例子 在开发中 ...
- apt 根据注解,编译时生成代码
apt: @Retention后面的值,设置的为CLASS,说明就是编译时动态处理的.一般这类注解会在编译的时候,根据注解标识,动态生成一些类或者生成一些xml都可以,在运行时期,这类注解是没有的~~ ...
- printf的特殊用法
printf的特殊用法:对于m.n的格式可以用如下方法表示 前边的 * 定义的是总的宽度,后边的 * 定义的是输出的个数.分别对应外面的参数m和n .这种方法的好处是可以在语句之外对参数m和n赋值 ...
- / fluxChatDemo / 系列 ——fluxDemoChat 组件编写
还是用各部分来表示过程吧,没文采,就先这样记着吧 嘻嘻 梳理问题: 编写es6风格的组件时,需要引入import React from ‘react’ 然后页面就华丽丽的展示出了我写的1.2两个字 在 ...